概述
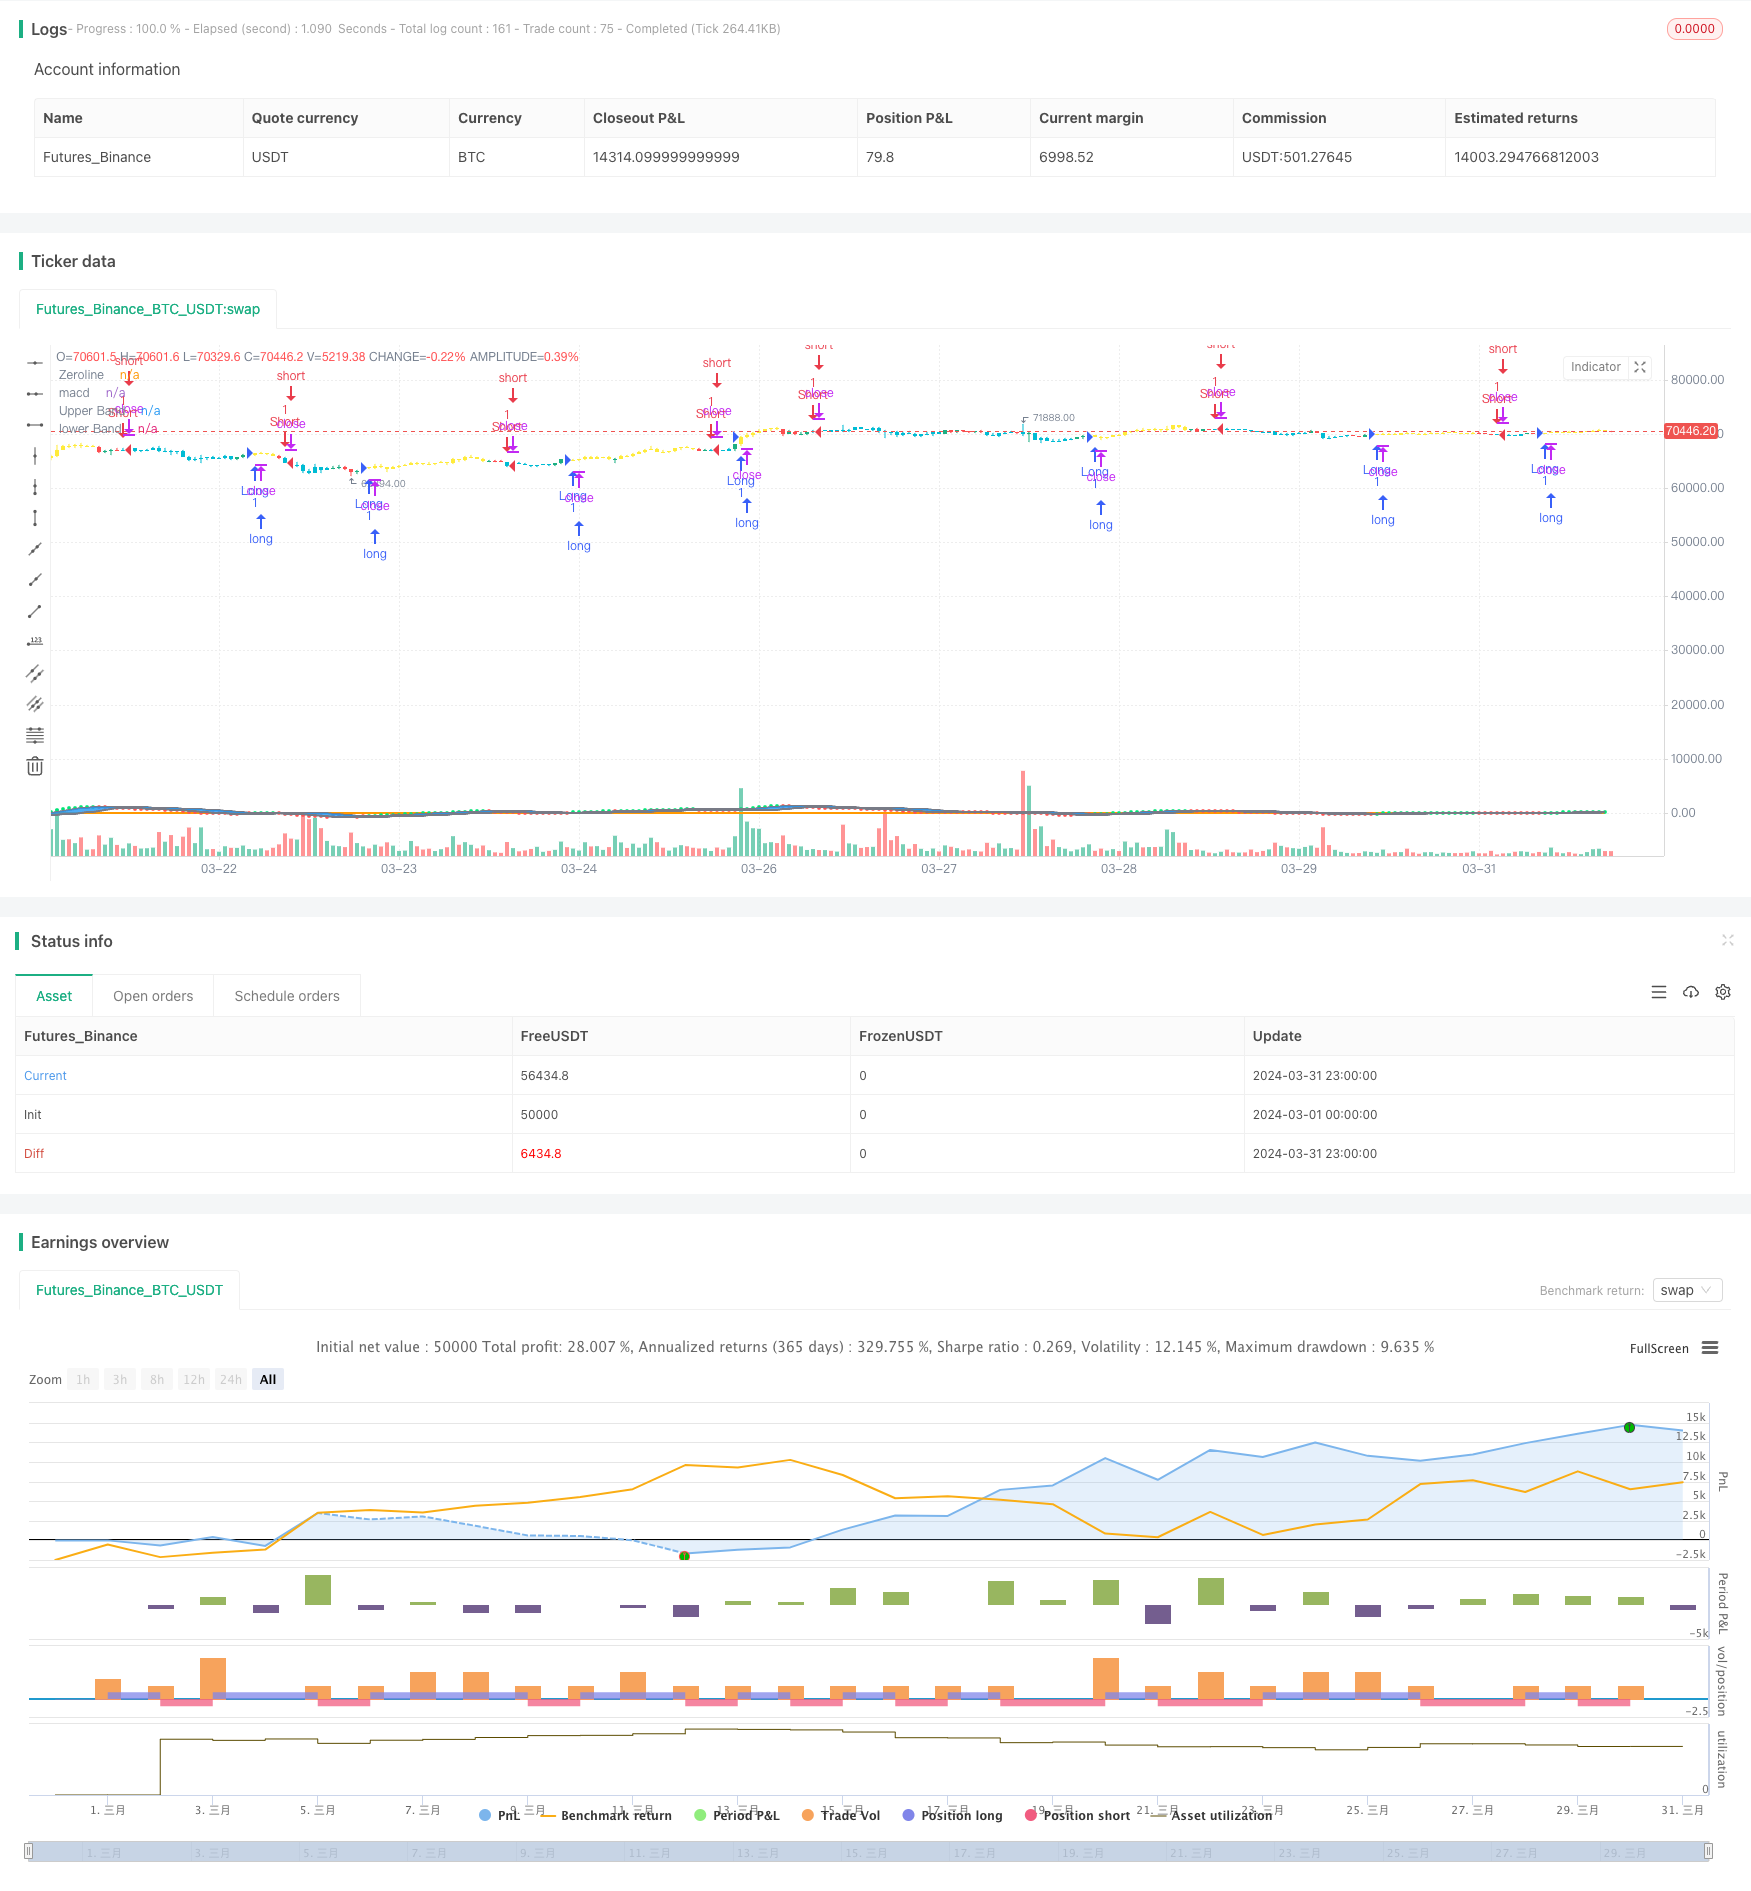
MACD BB 波段突破策略是一种基于 MACD 指标和布林带指标的交易策略。该策略利用 MACD 指标捕捉市场的短期趋势,同时使用布林带指标来确定市场的超买和超卖区域。当 MACD 指标突破布林带上轨时,策略开多单;当 MACD 指标突破布林带下轨时,策略开空单。该策略旨在捕捉市场的短期趋势,并在趋势形成的早期阶段进行交易。
策略原理
MACD BB 波段突破策略的原理如下: 1. 计算 MACD 指标:使用快速移动平均线(EMA)和慢速移动平均线(EMA)计算 MACD 指标。 2. 计算布林带:使用 MACD 指标的简单移动平均线(SMA)和标准差计算布林带上轨和下轨。 3. 多头信号:当 MACD 指标突破布林带上轨时,策略开多单。 4. 空头信号:当 MACD 指标突破布林带下轨时,策略开空单。 5. 止盈止损:策略可以设置止盈和止损百分比,以管理交易风险。
策略优势
- 趋势捕捉:MACD 指标能够有效捕捉市场的短期趋势,使策略能够在趋势形成的早期阶段进行交易。
- 波动性考量:布林带指标考虑了价格的波动性,帮助策略在市场波动加剧时避免错误的交易信号。
- 参数灵活:策略的参数,如 MACD 的快慢线周期、布林带的周期和标准差倍数,都可以根据市场特点进行优化调整。
策略风险
- 幅度风险:策略在趋势形成的早期阶段进行交易,可能面临较大的回撤风险。
- 频繁交易:若参数设置不当,策略可能产生过多的交易信号,导致频繁交易和高额交易成本。
- 参数优化:策略的表现依赖于参数的选择,不恰当的参数可能导致策略表现不佳。
策略优化方向
- 趋势确认:在产生交易信号后,可以结合其他指标或价格行为来确认趋势的有效性,以过滤掉一些错误信号。
- 动态止损:根据市场波动性或价格行为动态调整止损位置,以更好地控制风险。
- 参数自适应:通过机器学习或优化算法,实现策略参数的自适应调整,以适应不同的市场状况。
总结
MACD BB 波段突破策略通过结合 MACD 指标和布林带指标,在趋势形成的早期阶段进行交易。策略的优势在于能够捕捉短期趋势并考虑价格波动性,但也面临着幅度风险、频繁交易和参数优化的挑战。通过趋势确认、动态止损和参数自适应等优化方向,可以进一步提升策略的稳健性和适应性。
策略源码
/*backtest
start: 2024-03-01 00:00:00
end: 2024-03-31 23:59:59
period: 1h
basePeriod: 15m
exchanges: [{"eid":"Futures_Binance","currency":"BTC_USDT"}]
*/

//@version=5
//AK MACD BB
strategy("AK MACD BB strategy", overlay = true)

// Inputs for TP and SL
tp_percent = input.float(1.0, title="Take Profit %") / 100
sl_percent = input.float(1.0, title="Stop Loss %") / 100

length = input.int(10, minval=1, title="BB Periods")
dev = input.float(1, minval=0.0001, title="Deviations")

//MACD
fastLength = input.int(12, minval=1, title="fastLength")
slowLength=input.int(26,minval=1)
signalLength=input.int(9,minval=1)
fastMA = ta.ema(close, fastLength)
slowMA = ta.ema(close, slowLength)
macd = fastMA - slowMA

//BollingerBands

Std = ta.stdev(macd, length)
Upper = (Std * dev + (ta.sma(macd, length)))
Lower = ((ta.sma(macd, length)) - (Std * dev))


Band1 = plot(Upper, color=color.gray, style=plot.style_line, linewidth=2,title="Upper Band")
Band2 = plot(Lower, color=color.gray, style=plot.style_line, linewidth=2,title="lower Band")
fill(Band1, Band2, color=color.blue, transp=75,title="Fill")

mc = macd >= Upper ? color.lime:color.red

// Indicator

plot(macd, color=mc, style =plot.style_circles,linewidth = 3, title="macd")
zeroline = 0
plot(zeroline,color= color.orange,linewidth= 2,title="Zeroline")

//buy
barcolor(macd >Upper ? color.yellow:na)
//short
barcolor(macd <Lower ? color.aqua:na)
if macd > Upper
    strategy.entry("Long", strategy.long)
    // strategy.exit("Long TP/SL", "Long", limit=close * (1 + tp_percent), stop=close * (1 - sl_percent), comment = "Long Exit" )

if macd < Lower
    strategy.entry("Short", strategy.short)
    // strategy.exit("Short TP/SL", "Short", limit=close * (1 - tp_percent), stop=close * (1 + sl_percent), comment = "Short Exit")
相关推荐