资源加载中... loading...

Bollinger Bands and EMA Trend Following Strategy

Author: ChaoZhang, Date: 2024-05-29 16:49:14
Tags: BBEMASMASTDDEV

img

Overview

The Bollinger Bands and EMA Trend Following Strategy combines two technical indicators, Bollinger Bands and Exponential Moving Average (EMA), to identify potential short-term price movements in the market. Bollinger Bands are used to measure price volatility, while EMA is used to assess the direction of the trend. When the closing price crosses above the EMA and exceeds the upper band, it indicates a potential continuation of an uptrend, triggering a long position. Conversely, when the closing price crosses below the EMA and falls below the lower band, it suggests a potential continuation of a downtrend, prompting a short position. The strategy also incorporates risk management techniques such as stop loss and take profit levels to control downside risk and lock in profits. Overall, the strategy provides traders with a systematic approach to trading based on well-defined entry and exit conditions, increasing the probability of successful trades.

Strategy Principle

The core of this strategy lies in the combination of Bollinger Bands and EMA to identify potential trading opportunities. Bollinger Bands consist of three lines: the middle band (usually a simple moving average), the upper band (middle band plus a certain number of standard deviations), and the lower band (middle band minus a certain number of standard deviations). Price breakouts above the upper band or below the lower band typically indicate strong market volatility, while prices moving near the middle band suggest relative market stability. EMA is a trend-following indicator that assigns higher weights to recent price changes, making it more responsive to price movements compared to simple moving averages.

The trading logic of this strategy is as follows:

  1. When the closing price crosses above the EMA and exceeds the upper band, open a long position, indicating a potential continuation of an uptrend.
  2. When the closing price crosses below the EMA and falls below the lower band, open a short position, suggesting a potential continuation of a downtrend.
  3. Set stop loss and take profit levels to manage downside risk and lock in profits. The stop loss price is calculated based on a certain percentage of loss, while the take profit price is determined based on a certain percentage of gain.
  4. Calculate position size based on the risk amount per trade to control the risk exposure of each trade.

Strategy Advantages

  1. Trend Following: By combining Bollinger Bands and EMA, the strategy can effectively identify and follow market trends, capturing short-term price fluctuations.
  2. Risk Management: The strategy sets well-defined stop loss and take profit levels to control downside risk and lock in profits. This helps limit potential losses and ensures timely exits when trends reverse.
  3. Position Sizing: The strategy calculates position size based on the risk amount per trade, ensuring that the risk exposure of each trade is within an acceptable range. This helps achieve reasonable risk allocation and control.
  4. Adaptability: The technical indicators used in this strategy have a certain degree of flexibility and can be optimized based on different market conditions and trading instruments to adapt to various trading environments.

Strategy Risks

  1. Parameter Sensitivity: The performance of the strategy depends to some extent on the parameter settings of Bollinger Bands and EMA. Inappropriate parameter choices may lead to incorrect trading signals, affecting the overall performance of the strategy. Therefore, careful optimization and testing of parameters are necessary.
  2. Market Noise: Under certain market conditions, prices may exhibit frequent fluctuations and false breakouts, causing the strategy to generate incorrect trading signals. This can result in unnecessary trades and potential losses.
  3. Trend Reversal: The strategy is primarily suited for trending markets, and its performance may be impacted during trend reversals or choppy markets. When the market lacks clear trend direction, the strategy may produce false signals, leading to potential losses.
  4. Slippage and Trading Costs: In real trading, slippage may occur due to market volatility and liquidity constraints, resulting in a difference between the actual execution price and the expected price. Additionally, frequent trading may incur higher transaction costs, impacting the overall profitability of the strategy.

Strategy Optimization Directions

  1. Parameter Optimization: Optimize the parameters of Bollinger Bands and EMA, such as adjusting the length of Bollinger Bands, the number of standard deviations, and the period of EMA, to adapt to different market conditions and trading instruments. Parameter optimization can improve the adaptability and robustness of the strategy.
  2. Trend Confirmation: Incorporate additional trend confirmation indicators, such as ADX or MACD, into the entry conditions to filter out false breakouts and noisy signals. This can enhance the reliability of trading signals and reduce potential losses caused by false signals.
  3. Dynamic Stop Loss and Take Profit: Consider implementing dynamic stop loss and take profit mechanisms, such as trailing stops or volatility-based stops/targets, to better adapt to market changes. Dynamically adjusting stop loss and take profit levels can help the strategy better protect profits and limit risks.
  4. Position Sizing Optimization: Optimize position sizing rules, such as considering dynamic position sizing based on volatility or risk factors. Proper position sizing can help the strategy achieve better risk-adjusted returns across different market environments.
  5. Multiple Timeframe Analysis: Combine signals from different timeframes, such as confirming the trend direction on higher timeframes and seeking entry points on lower timeframes. Multi-timeframe analysis can provide a more comprehensive market perspective and help the strategy make more informed trading decisions.

Conclusion

The Bollinger Bands and EMA Trend Following Strategy offers traders a systematic approach to capture short-term price movements in the market by combining a volatility indicator and a trend-following indicator. The strategy’s strengths lie in its ability to effectively identify and follow market trends while incorporating risk management and position sizing techniques. However, the strategy also faces risks such as parameter sensitivity, market noise, trend reversals, and needs to be improved and optimized through parameter optimization, trend confirmation, dynamic stop loss and take profit, position sizing optimization, and multi-timeframe analysis. Overall, the Bollinger Bands and EMA Trend Following Strategy provides traders with a viable trading framework, but it requires appropriate adjustments and optimizations based on specific market conditions and trading objectives in practical applications.


/*backtest
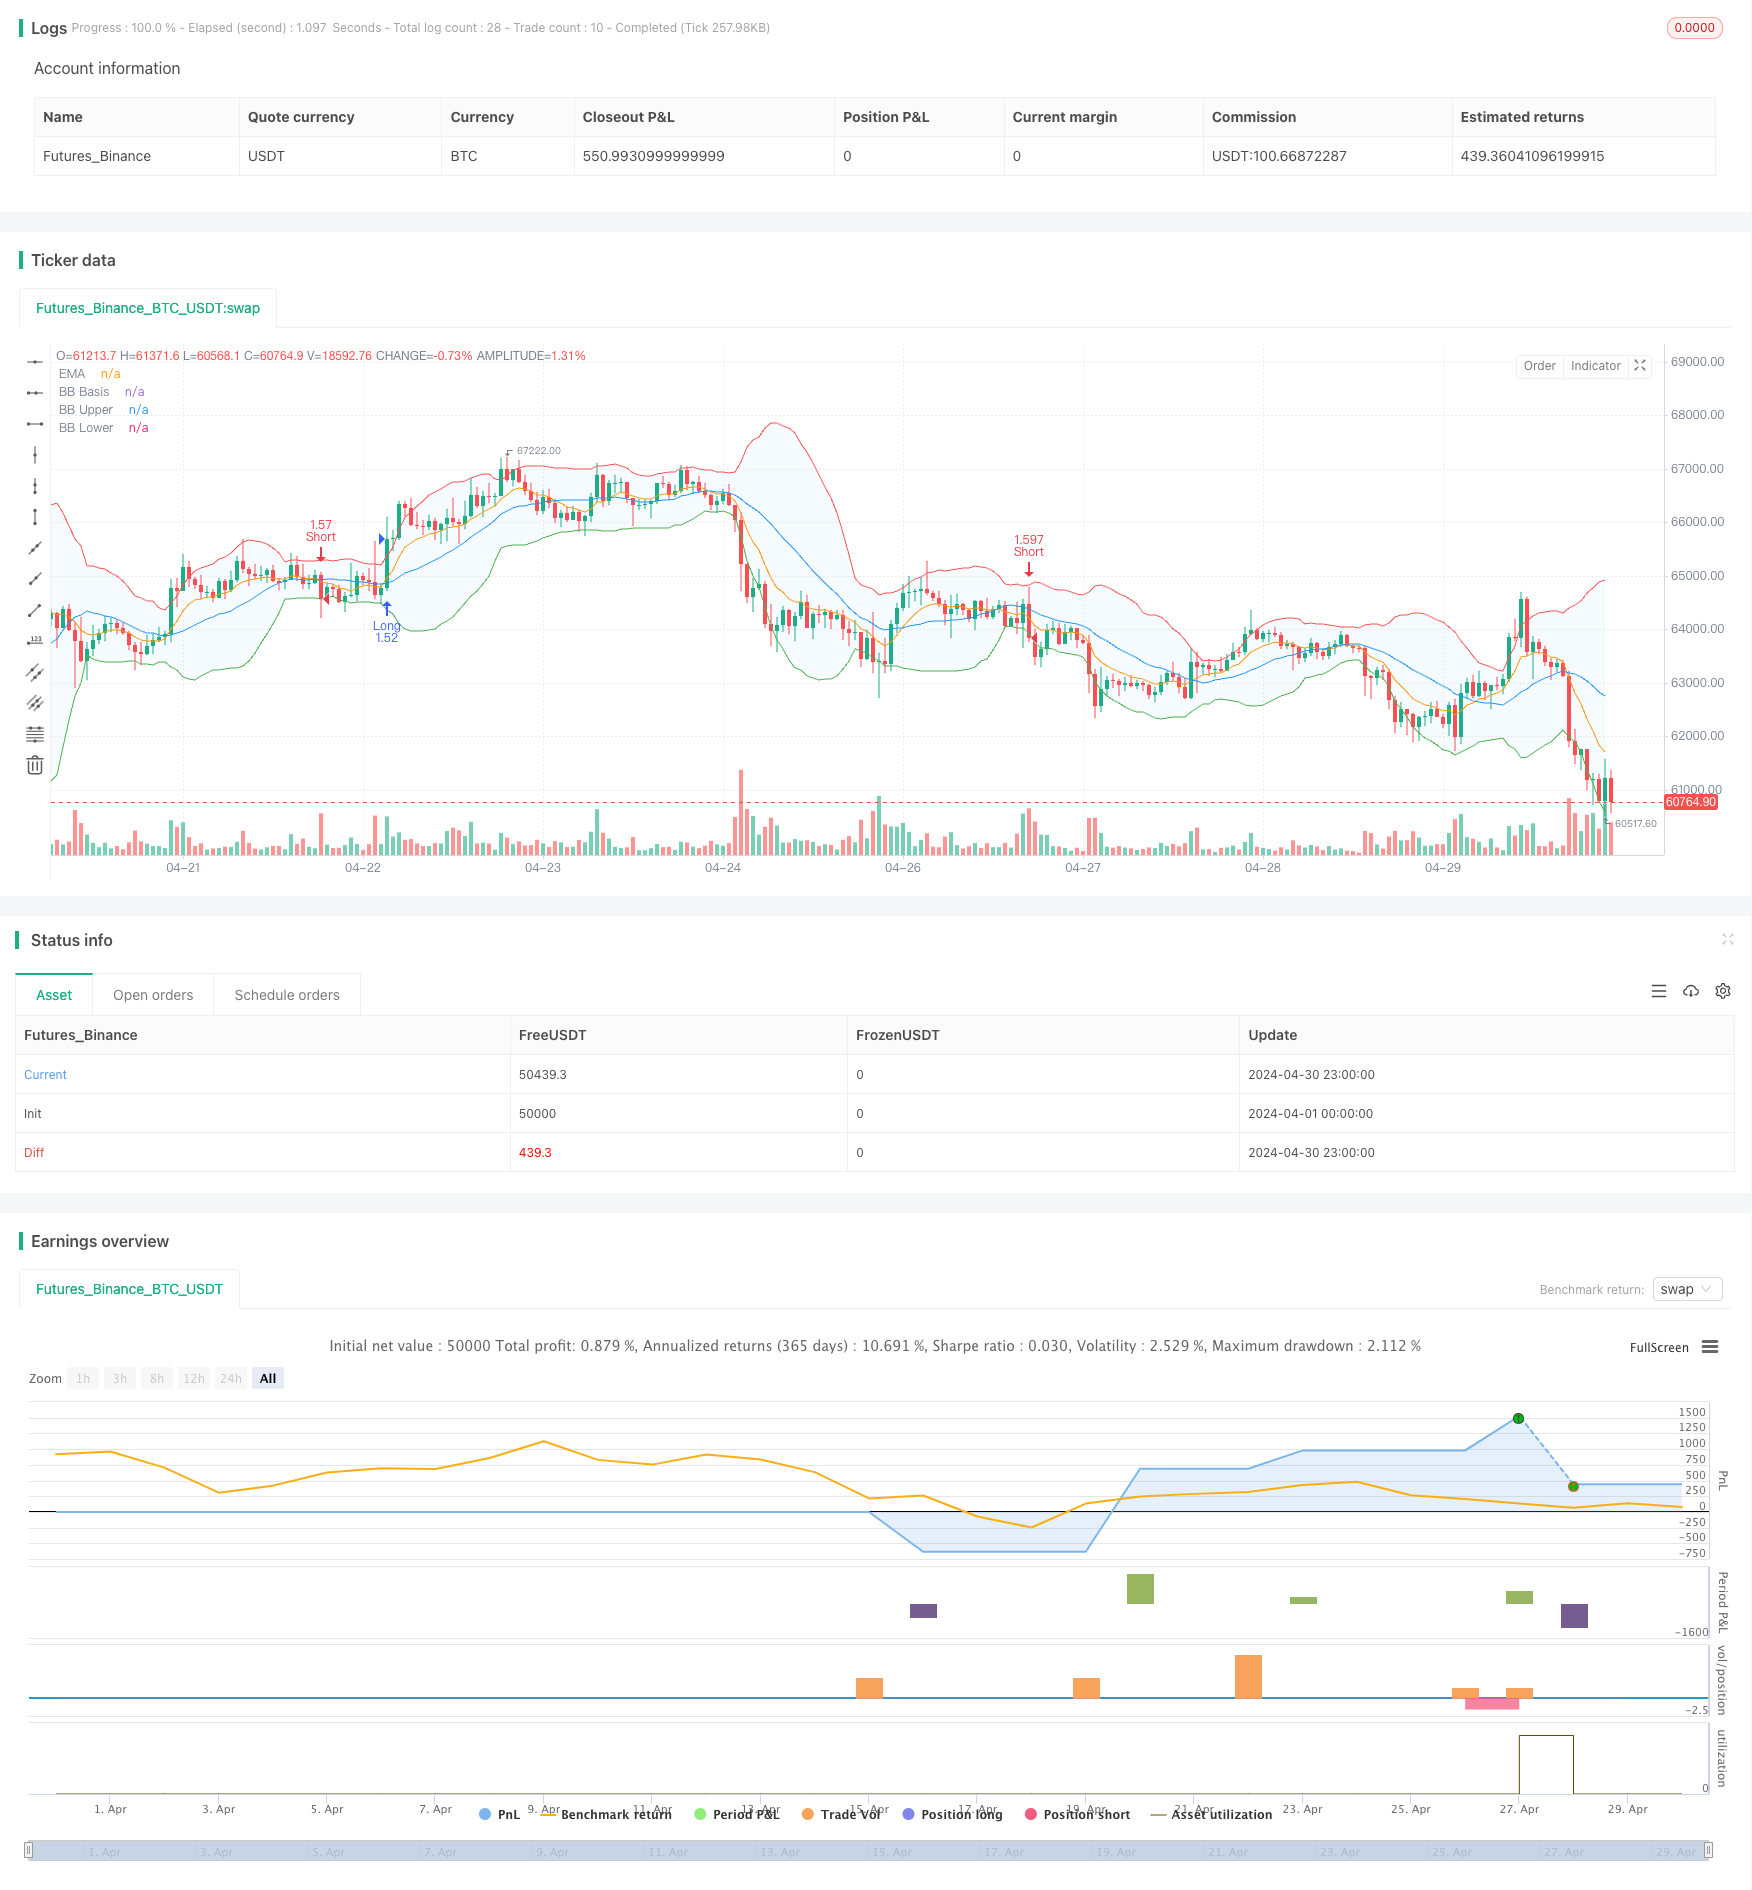
start: 2024-04-01 00:00:00
end: 2024-04-30 23:59:59
period: 1h
basePeriod: 15m
exchanges: [{"eid":"Futures_Binance","currency":"BTC_USDT"}]
*/

//@version=5
strategy("Bollinger Bands and EMA Strategy", overlay=true)

// Bollinger Bands Inputs
bb_length = input.int(20, minval=1, title="Bollinger Bands Length")
bb_mult = input.float(2.0, minval=0.001, maxval=50, title="Bollinger Bands StdDev")
bb_src = input(close, title="Bollinger Bands Source")
bb_offset = input.int(0, title="Bollinger Bands Offset", minval=-500, maxval=500)

// EMA Inputs
ema_period = input.int(9, minval=1, title="EMA Period")
ema_src = input(close, title="EMA Source")
ema_offset = input.int(0, title="EMA Offset", minval=-500, maxval=500)

// Calculate Bollinger Bands
bb_basis = ta.sma(bb_src, bb_length)
bb_dev = bb_mult * ta.stdev(bb_src, bb_length)
bb_upper = bb_basis + bb_dev
bb_lower = bb_basis - bb_dev

// Plot Bollinger Bands
plot(bb_basis, "BB Basis", color=color.blue, offset=bb_offset)
p1 = plot(bb_upper, "BB Upper", color=color.red, offset=bb_offset)
p2 = plot(bb_lower, "BB Lower", color=color.green, offset=bb_offset)
fill(p1, p2, title="BB Background", color=color.rgb(33, 150, 243, 95))

// Calculate EMA
ema_value = ta.ema(ema_src, ema_period)

// Plot EMA
plot(ema_value, title="EMA", color=color.orange, offset=ema_offset)

// Strategy Conditions
long_condition = ta.crossover(close, ema_value) and close > bb_upper
short_condition = ta.crossunder(close, ema_value) and close < bb_lower

// Define Stop Loss and Take Profit Levels
stop_loss_pct = input.float(0.5, title="Stop Loss (%)")
take_profit_pct = input.float(1.0, title="Take Profit (%)")
stop_loss_level_long = close * (1 - stop_loss_pct / 100)
take_profit_level_long = close * (1 + take_profit_pct / 100)
stop_loss_level_short = close * (1 + stop_loss_pct / 100)
take_profit_level_short = close * (1 - take_profit_pct / 100)

// Calculate Position Size Based on Risk Per Trade
risk_per_trade = input.float(1.0, title="Risk Per Trade (%)")
capital_at_risk = strategy.equity * risk_per_trade / 100
risk_per_unit_long = math.abs(close - stop_loss_level_long)
risk_per_unit_short = math.abs(close - stop_loss_level_short)
position_size_long = capital_at_risk / risk_per_unit_long
position_size_short = capital_at_risk / risk_per_unit_short

// Enter Long and Short Trades
if long_condition
    strategy.entry("Long", strategy.long, qty=position_size_long)
    strategy.exit("Take Profit", "Long", limit=take_profit_level_long)
    strategy.exit("Stop Loss", "Long", stop=stop_loss_level_long)

if short_condition
    strategy.entry("Short", strategy.short, qty=position_size_short)
    strategy.exit("Take Profit", "Short", limit=take_profit_level_short)
    strategy.exit("Stop Loss", "Short", stop=stop_loss_level_short)


Related

More