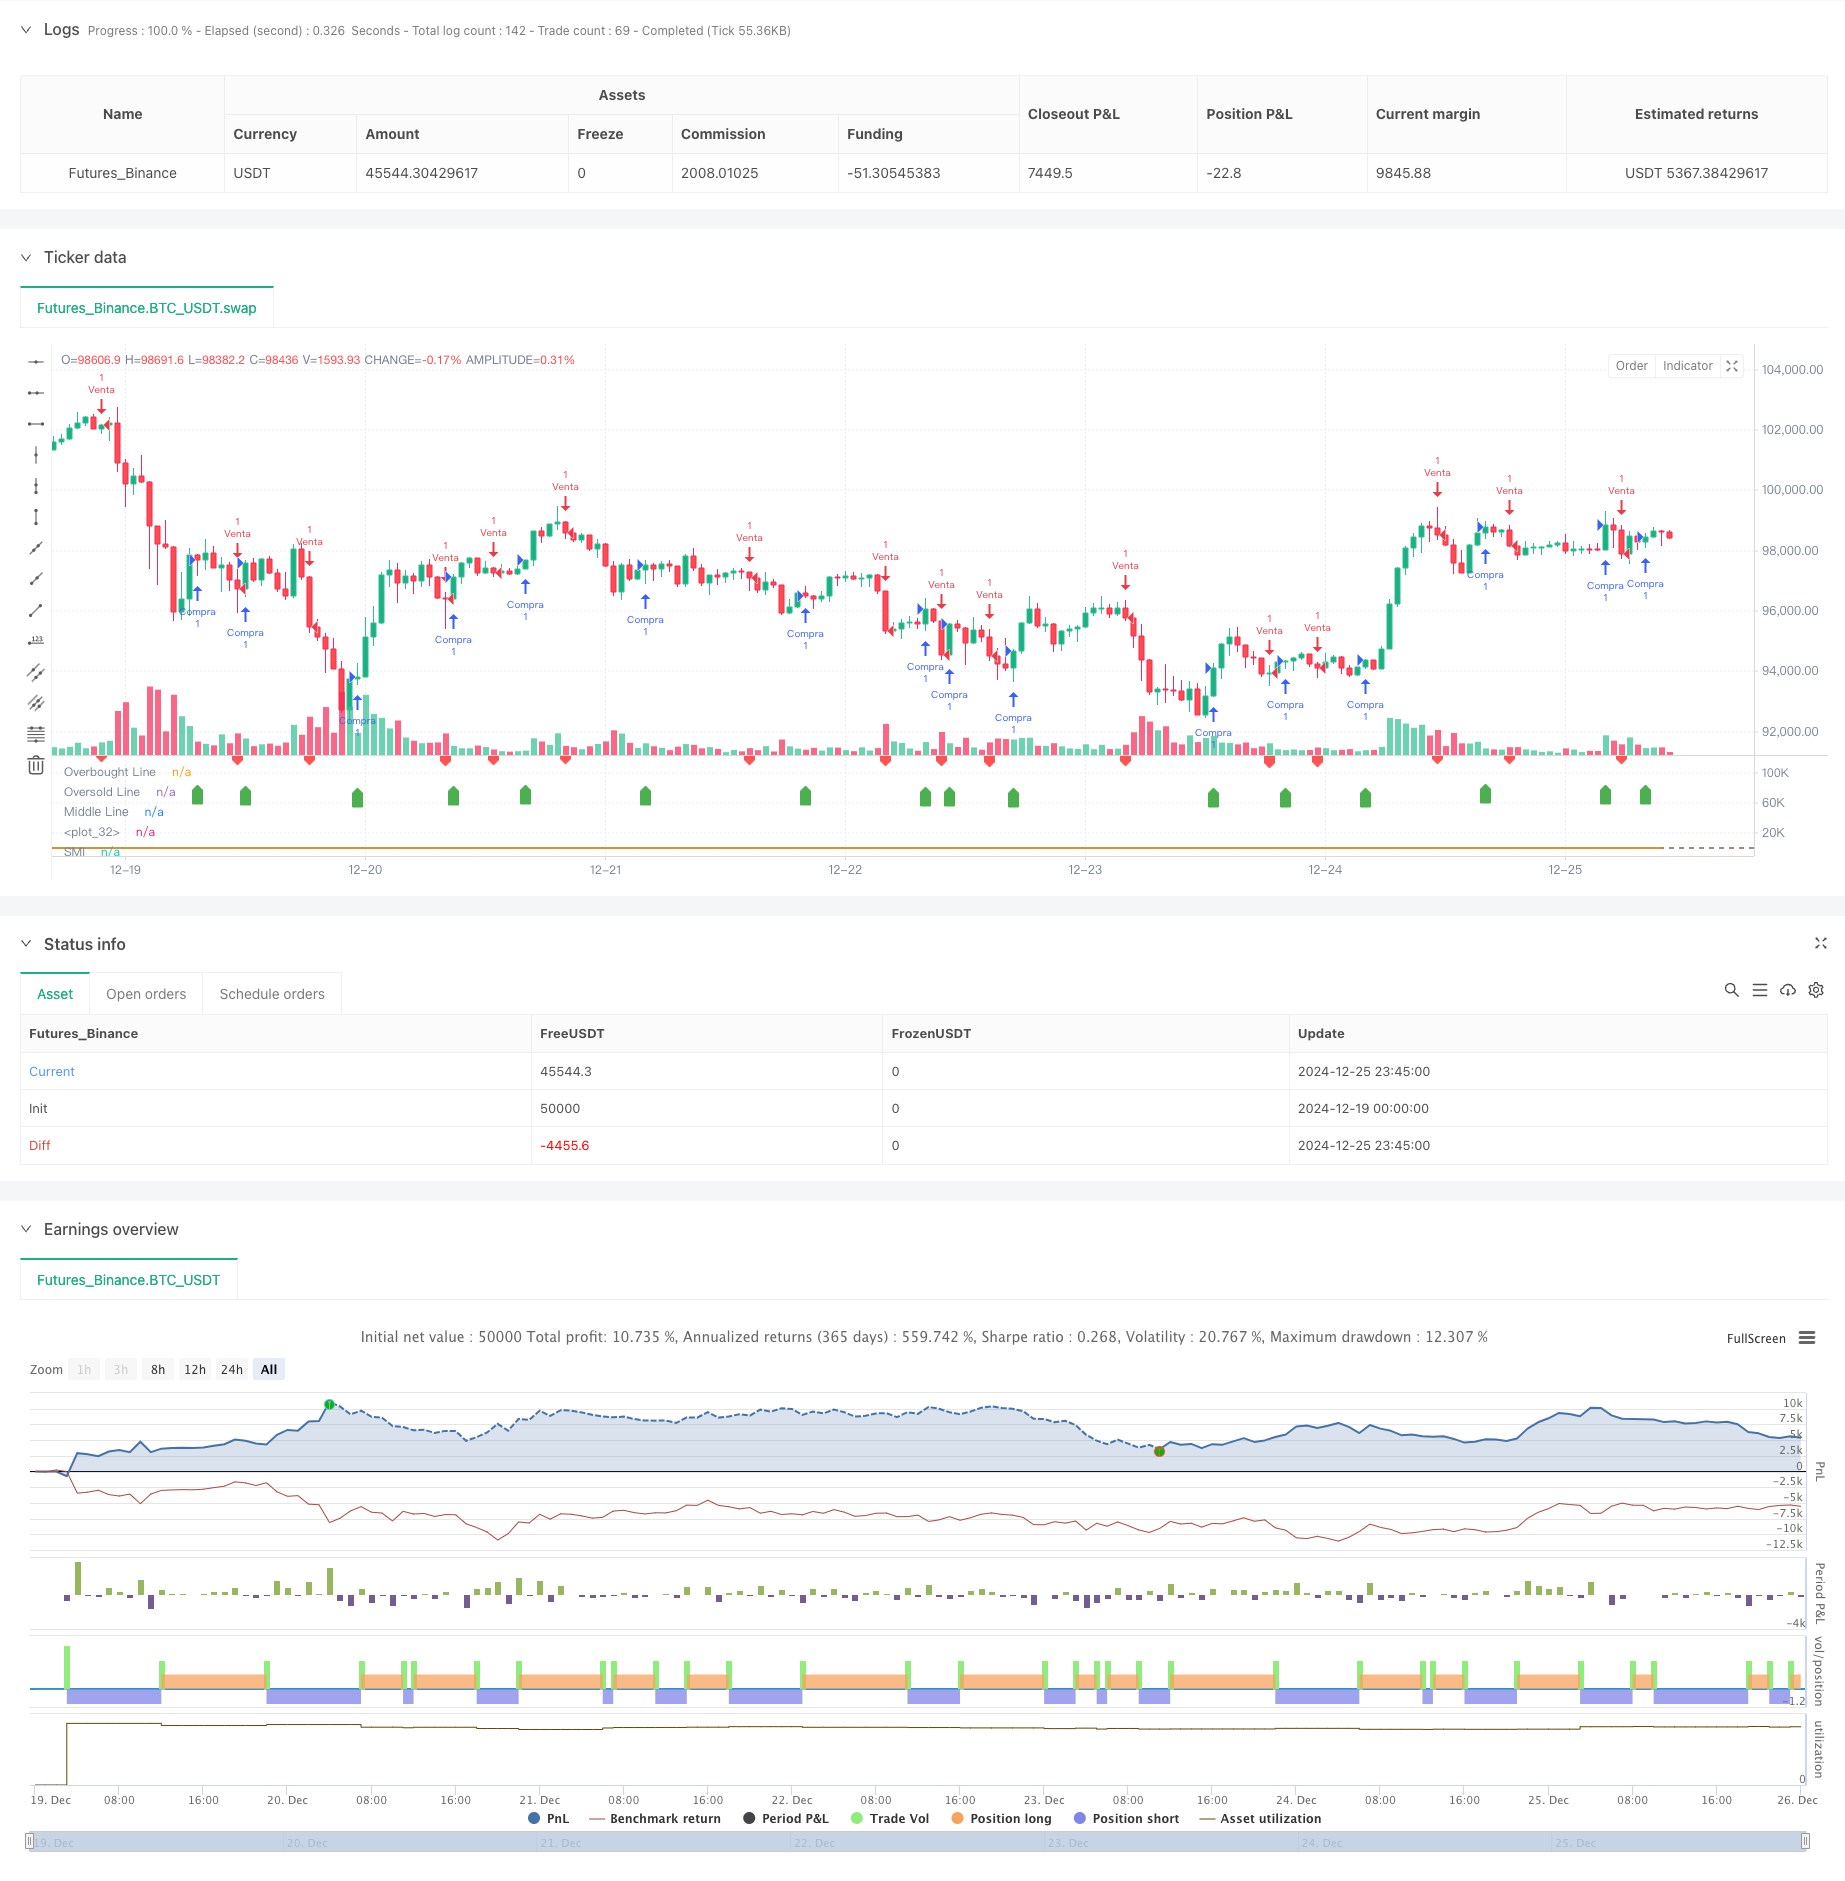
概述
该策略是一个基于随机动量指标(SMI)的自适应交易系统。它通过分析SMI指标与其信号线的交叉来预测市场走势,并在关键位置自动发出买卖信号。策略采用双重指数移动平均(EMA)来平滑数据,提高信号的可靠性。该系统特别适用于中长期交易,能有效捕捉市场主要趋势转折点。
策略原理
策略的核心是通过计算随机动量指标(SMI)来衡量价格动量。首先计算特定周期内的最高价和最低价范围,然后将收盘价相对于该范围的位置标准化。通过对相对范围和价格范围应用双重EMA平滑处理,得到更稳定的SMI值。当SMI线与其信号线(SMI的EMA)发生黄金交叉时,触发买入信号;死亡交叉时,触发卖出信号。同时设置了超买超卖区间(+40/-40),用于确认信号的可靠性。
策略优势
- 信号明确性强:使用交叉信号作为交易触发条件,避免了判断的主观性
- 抗噪性好:采用双重EMA平滑处理,能有效过滤市场噪音
- 适应性强:通过参数优化可适应不同市场环境
- 风险控制完善:设置超买超卖区间,避免在极端行情下的误判
- 可视化程度高:使用渐变填充直观显示市场状态
策略风险
- 滞后性风险:由于使用多重均线计算,信号会有一定滞后
- 震荡市风险:在横盘震荡市场可能产生虚假信号
- 参数敏感性:不同参数组合可能导致截然不同的结果
- 市场环境依赖:在趋势明显的市场表现更好,震荡市场效果欠佳
策略优化方向
- 引入成交量指标:结合成交量变化验证信号有效性
- 添加趋势过滤器:使用长周期均线确认整体趋势方向
- 优化参数自适应:根据市场波动率动态调整参数
- 增加止损机制:设置移动止损保护既有利润
- 完善风险管理:加入仓位管理和资金管理模块
总结
这是一个基于SMI指标的成熟交易策略,通过技术指标交叉产生交易信号,具有较强的实用性。策略的核心优势在于信号明确、抗噪性强,但也存在一定的滞后性。通过增加成交量验证、趋势过滤等优化手段,可以进一步提升策略的稳定性和可靠性。该策略特别适合追踪中长期趋势,对于想要构建系统化交易系统的投资者来说是一个很好的选择。
策略源码
/*backtest
start: 2024-12-19 00:00:00
end: 2024-12-26 00:00:00
period: 45m
basePeriod: 45m
exchanges: [{"eid":"Futures_Binance","currency":"BTC_USDT"}]
*/

// This Pine Script™ code is subject to the terms of the Mozilla Public License 2.0 at https://mozilla.org/MPL/2.0/
// © Iban_Boe

//@version=6
strategy("SMI Strategy with Signals", "SMI Strategy", overlay=false)

// Parámetros del SMI
lengthK   = input.int(14, "%K Length",  minval=1, maxval=15000)
lengthD   = input.int(3,  "%D Length",  minval=1, maxval=4999)
lengthEMA = input.int(3,  "EMA Length", minval=1, maxval=4999)

// Función de doble EMA
emaEma(source, length) => ta.ema(ta.ema(source, length), length)

// Cálculos del SMI
highestHigh = ta.highest(lengthK)
lowestLow = ta.lowest(lengthK)
highestLowestRange = highestHigh - lowestLow
relativeRange = close - (highestHigh + lowestLow) / 2
smi = 200 * (emaEma(relativeRange, lengthD) / emaEma(highestLowestRange, lengthD))
smiSignal = ta.ema(smi, lengthEMA)

// Gráficos del SMI
smiPlot = plot(smi, "SMI", color=color.blue)
plot(smiSignal, "SMI-based EMA", color=color.orange)

// Level lines
hline(40, "Overbought Line", color=color.green)
hline(-40, "Oversold Line", color=color.red)
hline(0, "Middle Line", color=color.gray)

midLinePlot = plot(0, color = na, editable = false, display = display.none)
fill(smiPlot, midLinePlot, 120,  40,   top_color = color.new(#4caf4f, 50),    bottom_color = color.new(color.green, 100), title = "Overbought Gradient Fill")
fill(smiPlot, midLinePlot, -40, -120,  top_color = color.new(color.red, 100), bottom_color = color.new(color.red, 50),    title = "Oversold Gradient Fill")

// Señales de compra y venta
buySignal = ta.crossover(smi, smiSignal) // Detect crossover
sellSignal = ta.crossunder(smi, smiSignal) // Detect crossover

// Graficar señales de compra/venta
plotshape(series=buySignal, style=shape.labelup, location=location.belowbar, color=color.green, size=size.tiny, title="Señal de Compra")
plotshape(series=sellSignal, style=shape.labeldown, location=location.abovebar, color=color.red, size=size.tiny, title="Señal de Venta")

// Lógica de la estrategia
if (buySignal)
    strategy.entry("Compra", strategy.long)

if (sellSignal)
    strategy.entry("Venta", strategy.short)

// Alertas
alertcondition(buySignal, title="Alerta de Compra", message="¡Señal de Compra Detectada!")
alertcondition(sellSignal, title="Alerta de Venta", message="¡Señal de Venta Detectada!")
相关推荐