ringkasan
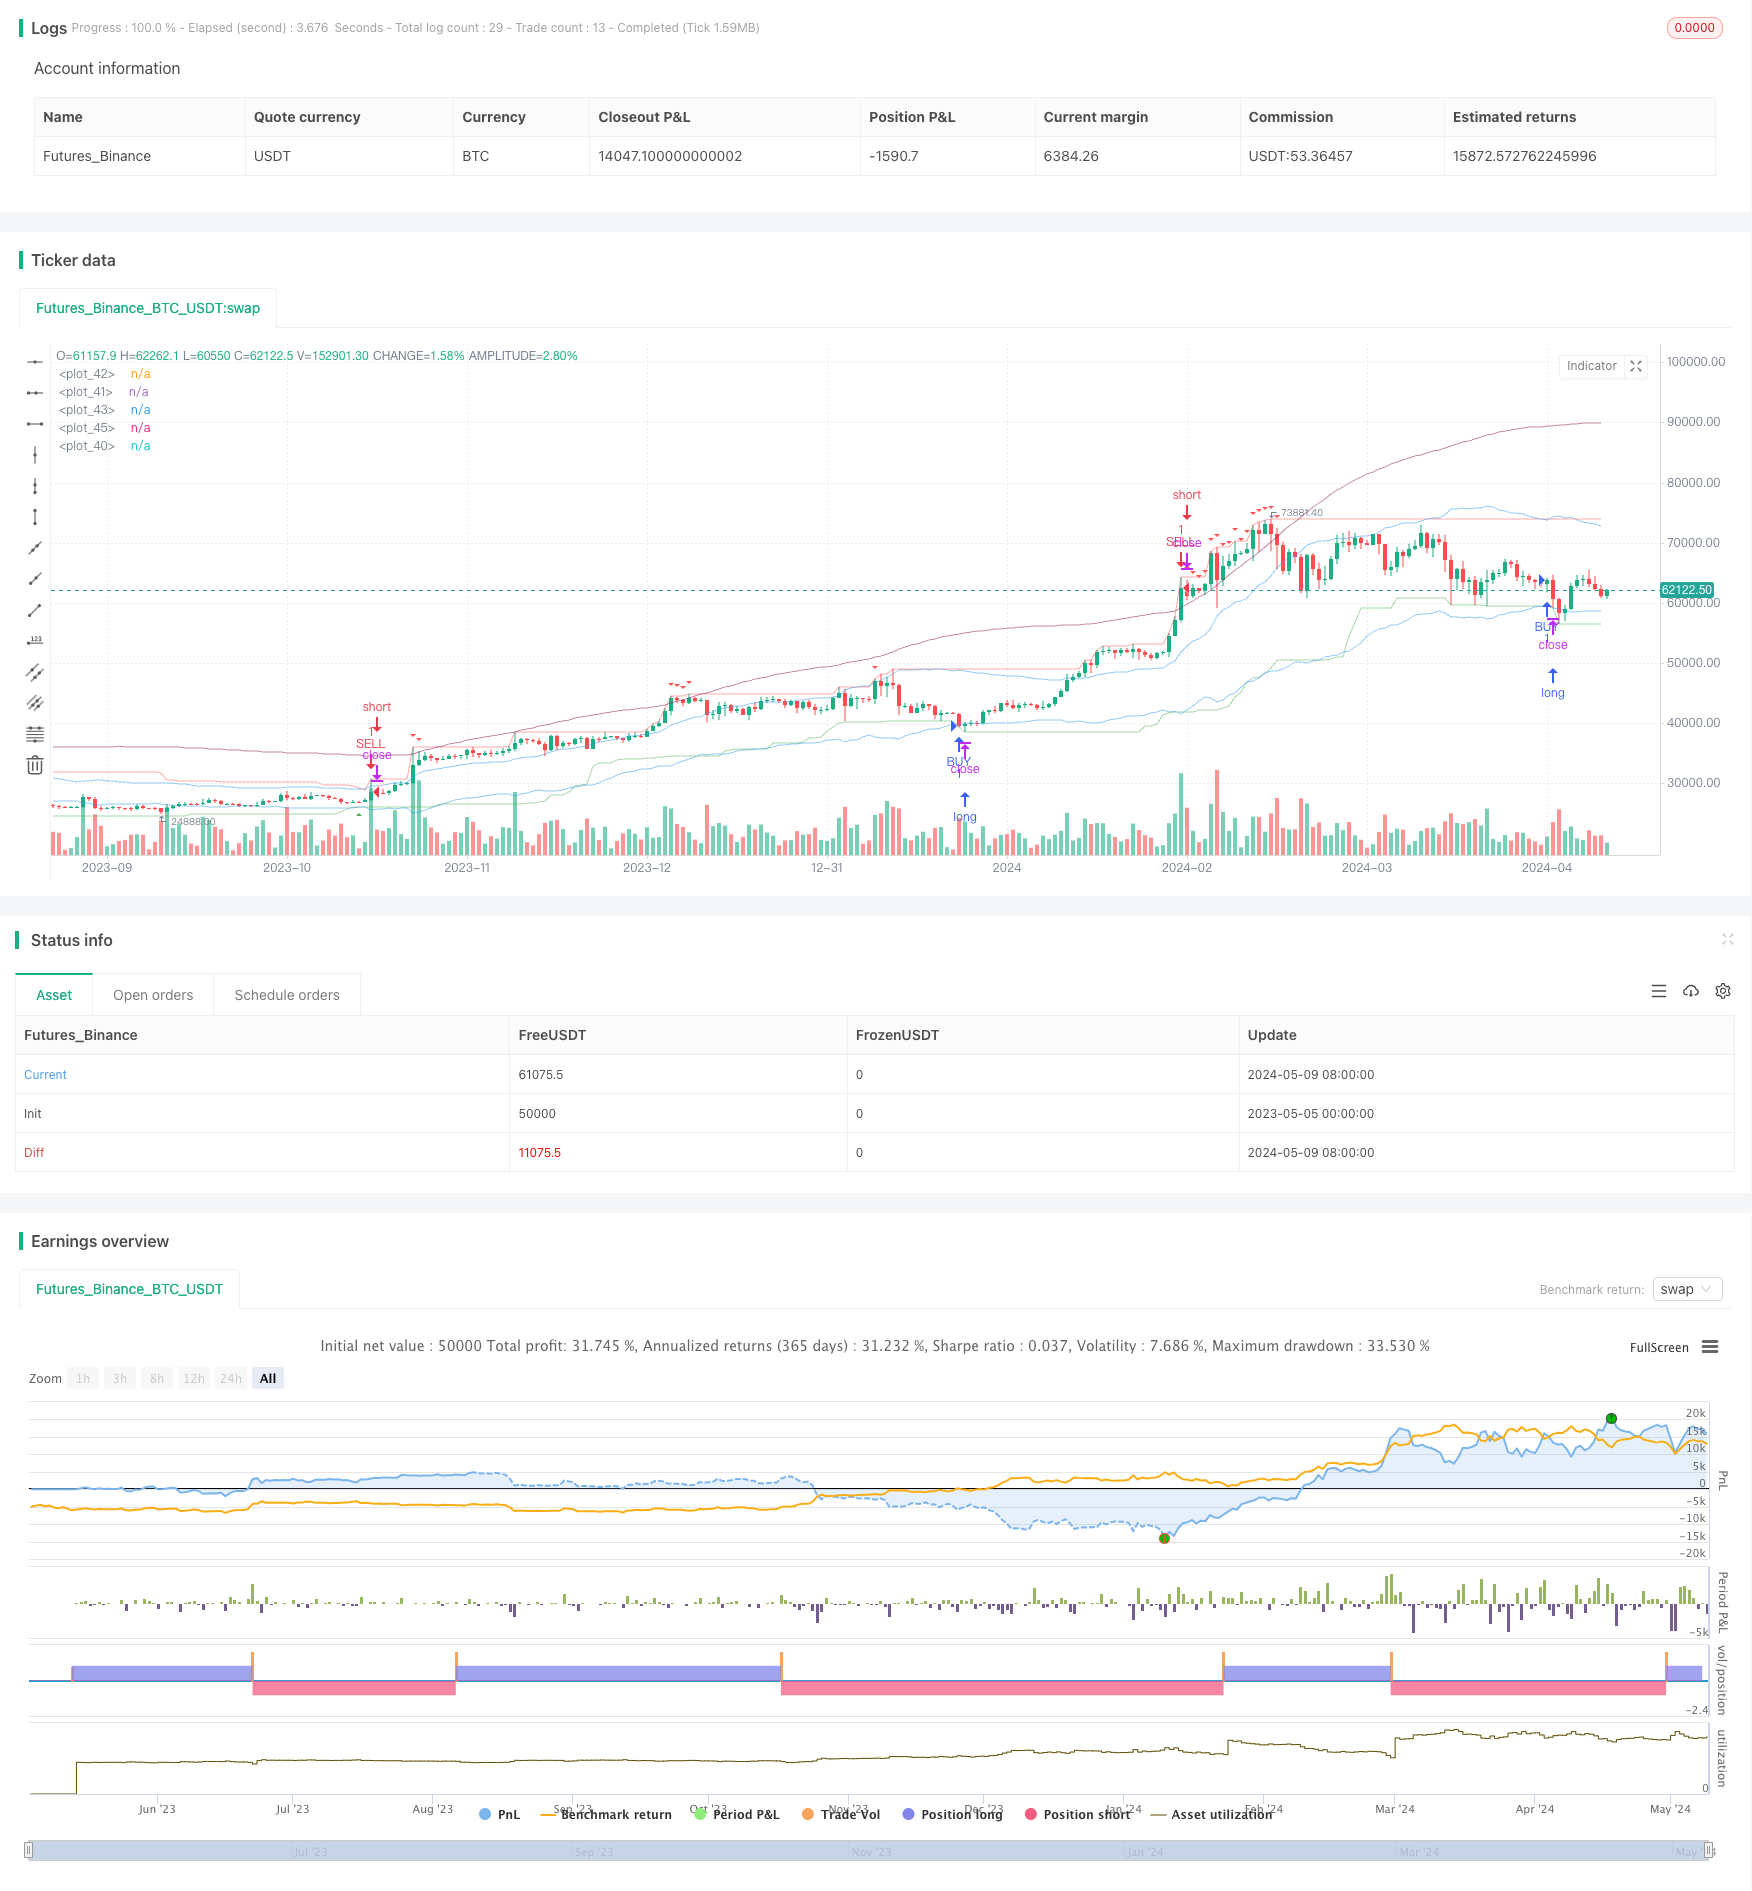
Strategi ini menggunakan indikator teknikal seperti purata bergerak indeks (EMA), harga tertinggi, harga terendah dan purata gelombang sebenar (ATR) untuk mengenal pasti arah trend semasa dengan menilai hubungan harga dengan EMA, harga tertinggi dan harga terendah, membeli apabila harga melampaui harga terendah ke atas, menjual apabila harga melampaui harga tertinggi ke bawah atau menyentuh tahap rintangan dinamik, untuk menangkap trend, dan memperoleh keuntungan tambahan.
Prinsip-prinsip strategi
- Pengiraan ATR digunakan untuk mengukur kadar turun naik pasaran dan menyediakan asas untuk membina saluran dinamik.
- Mengira harga tertinggi dan terendah sebagai asas untuk menilai arah trend.
- Hitung EMA_HL, iaitu harga tertinggi dan harga terendah EMA, sebagai sumbu tengah saluran dinamik.
- Hitung EMA_HIGHEST dan EMA_LOWEST, iaitu di atas dan di bawah landasan EMA_HL, tambah dan tolak ATR kalikan dengan perkadaran tertentu.
- Hitung SELL_LINE, iaitu, berdasarkan harga tertinggi ditambah ATR kalikan dengan kadar resistensi dinamik yang diperoleh.
- Menentukan isyarat berbilang arah: isyarat beli dihasilkan apabila EMA_LOWEST melangkaui harga terendah ke atas dan harga penutupan berada di bawah EMA_MID
- Menentukan isyarat kosong: Isyarat jual dihasilkan apabila harga EMA_HIGHEST melampaui harga tertinggi ke bawah dan harga penutupan lebih tinggi daripada harga EMA_MID, atau apabila harga tertinggi menyentuh SELL_LINE
#Keutamaan taktikal#
- Dengan menggunakan EMA, harga tertinggi, harga terendah dan lain-lain untuk menilai trend, isyarat mempunyai kebolehpercayaan yang tinggi.
- Memperkenalkan ATR sebagai standard untuk mengukur kadar turun naik, membina saluran dinamik untuk menyesuaikan diri dengan keadaan pasaran yang berbeza.
- Tetapkan tahap rintangan dinamik SELL_LINE untuk mengunci keuntungan dan mengawal risiko penarikan balik.
- Parameter boleh disesuaikan, menyesuaikan diri dengan pelbagai jenis dan tempoh, dengan kebolehgunaan dan fleksibiliti tertentu.
#Risiko taktikal#
- Pengiktirafan trend mungkin terlewat, menyebabkan masa kemasukan tidak sesuai.
- Tetapan parameter yang tidak betul boleh menyebabkan isyarat yang kerap dan meningkatkan kos transaksi.
- Untuk pasaran yang bergolak, strategi mungkin tidak berfungsi dengan baik dan perlu digabungkan dengan kaedah lain.
- Dalam keadaan yang melampau, seperti perubahan disk yang cepat, strategi mungkin tidak berkesan dan perlu menetapkan hentian kerugian.
Arahan untuk mengoptimumkan strategi
- Memperkenalkan lebih banyak penunjuk, seperti jumlah lalu lintas, kadar turun naik, dan lain-lain, memperkaya dimensi penilaian trend, meningkatkan kebolehpercayaan isyarat.
- Mengoptimumkan parameter, seperti ATR, kitaran EMA, dan lain-lain, untuk mencari kombinasi parameter yang optimum dan meningkatkan kestabilan strategi.
- Menambah pengurusan kedudukan, seperti menyesuaikan kedudukan mengikut dinamik ATR, mengawal risiko tunggal.
- Tetapkan stop loss dan stop stop, mengawal kerugian maksimum dan keuntungan maksimum tunggal, meningkatkan nisbah keuntungan risiko.
- Bergabung dengan strategi lain, seperti strategi penembusan, strategi pulangan rata-rata, dan lain-lain, untuk membentuk gabungan strategi dan meningkatkan kestabilan keseluruhan.
Kesimpulannya
Strategi ini menggunakan indikator teknikal seperti EMA, harga tertinggi dan terendah, digabungkan dengan ATR untuk membina saluran dinamik, menghasilkan isyarat perdagangan dengan menembusi harga tertinggi dan terendah untuk menangkap trend. Strategi ini adalah strategi penjejakan trend yang mudah dan praktikal.
/*backtest
start: 2023-05-05 00:00:00
end: 2024-05-10 00:00:00
period: 1d
basePeriod: 1h
exchanges: [{"eid":"Futures_Binance","currency":"BTC_USDT"}]
*/

// This Pine Script™ code is subject to the terms of the Mozilla Public License 2.0 at https://mozilla.org/MPL/2.0/
// © Maboi_q

//@version=5
strategy("buy sell Trend", overlay=true)

atr_length = input.int(defval=14, title='atr length')
highest_length = input.int(defval=60, title='highest length')
highest_s_length = input.int(defval=60, title='sell highest length')
lowest_length = input.int(defval=30, title='lowest length')
sell_l_length = input.int(defval=55, title='sell line length')

f = 2.382
f2 = 5.618

atr = ta.atr(atr_length)
highest = ta.highest(highest_length)
lowest = ta.lowest(lowest_length)

f_atr = atr * f
ema_hl = ta.ema((highest[1] + lowest[1]) / 2, 14)
ema_highest = ema_hl + f_atr
ema_lowest = ema_hl - f_atr
ema_mid = (ema_highest + ema_lowest) / 2

bs_hi = ta.highest(highest_s_length)
f_atr2 = atr * f2
sell_line = ta.ema(bs_hi[1] + f_atr2, sell_l_length)

buy_cond = ta.crossover(ema_lowest, lowest) and close < ema_mid
sell_cond = (ta.crossunder(ema_highest, highest) and close > ema_mid) or high >= sell_line

if buy_cond
    strategy.entry('BUY', strategy.long)

if sell_cond
    strategy.entry('SELL', strategy.short)


plot(sell_line, color=color.new(color.maroon, 50))
plot(highest, color=color.new(color.red, 50))
plot(lowest, color=color.new(color.green, 50))
plot(ema_highest, color=color.new(color.blue, 50))
// plot(ema_mid, color=color.new(color.gray, 50))
plot(ema_lowest, color=color.new(color.blue, 50))

plotshape(buy_cond, title='buy', style=shape.triangleup, location=location.belowbar,
 color=color.green, textcolor=color.green, size=size.tiny)

plotshape(sell_cond, title='sell', style=shape.triangledown, location=location.abovebar,
 color=color.red, textcolor=color.red, size=size.tiny)