资源加载中... loading...

Trading Strategy Based on Consecutive MACD Golden and Death Crosses

Author: ChaoZhang, Date: 2024-04-30 17:26:19
Tags: MACDEMA

img

Overview

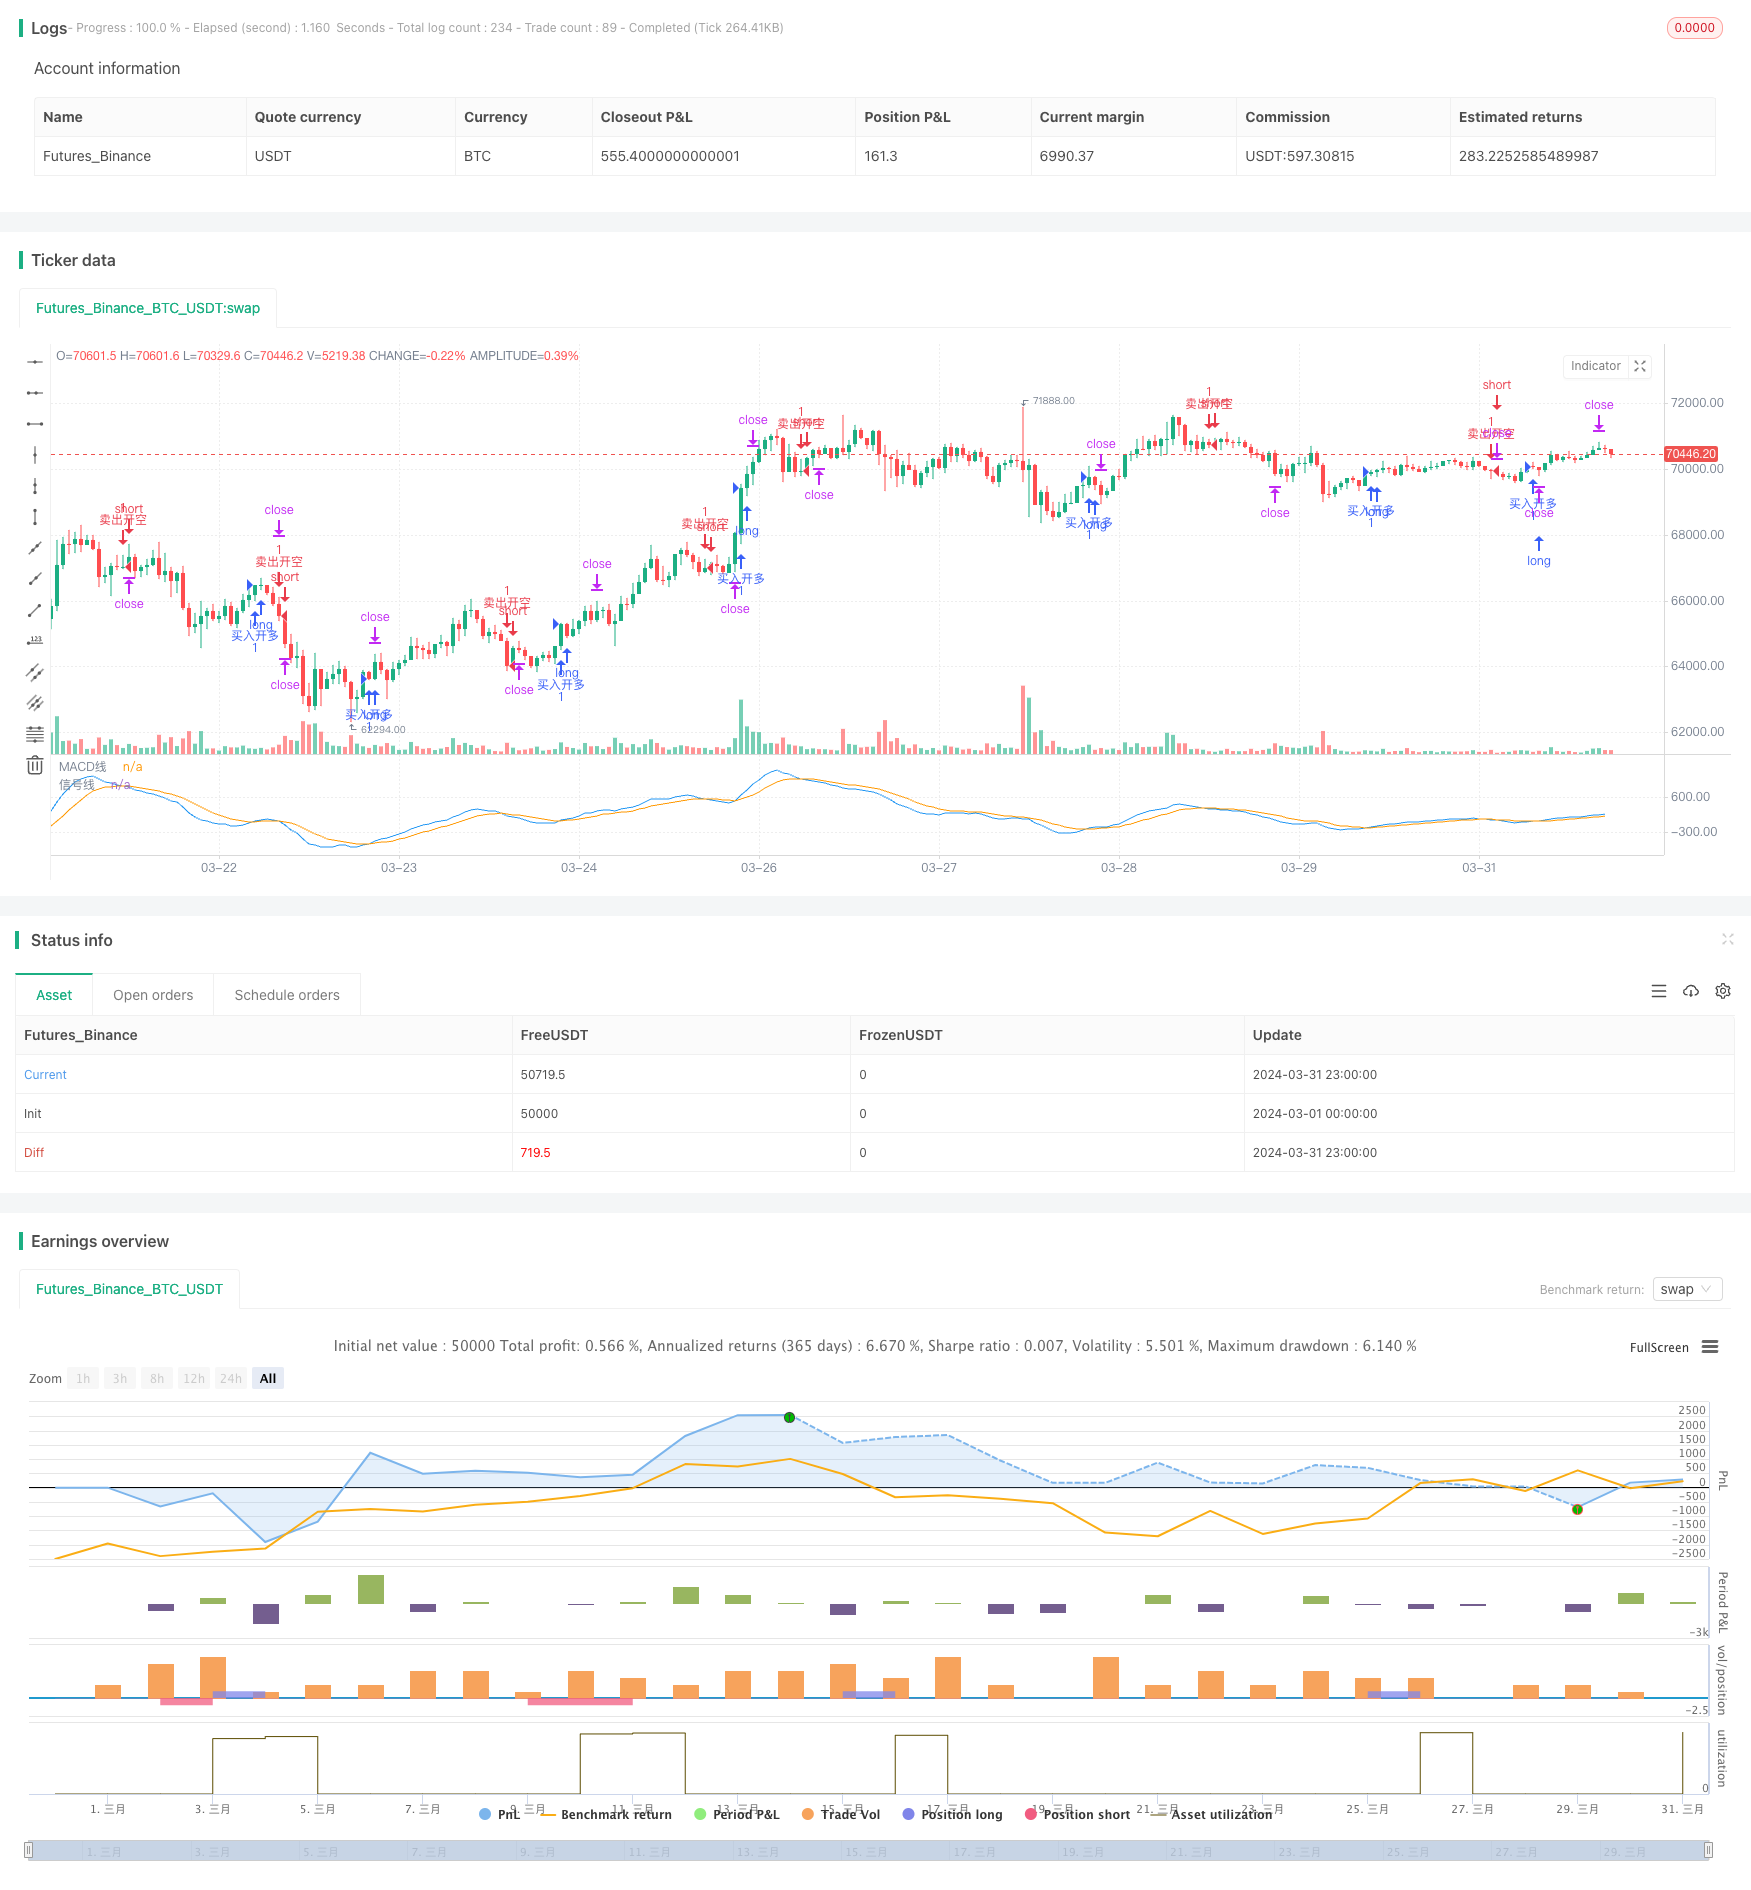
This strategy is based on the consecutive golden cross and death cross signals of the MACD indicator for trading. When consecutive golden cross signals appear, it opens a long position; when consecutive death cross signals appear, it opens a short position. At the same time, the strategy allows users to set take-profit and stop-loss levels to control risk. Additionally, the strategy provides the option to select the backtest time range, allowing users to evaluate the strategy’s performance within a specified time period.

Strategy Principle

The core of this strategy is to use the golden cross and death cross signals of the MACD indicator to determine the turning points of market trends. The MACD indicator consists of a fast moving average (EMA) and a slow moving average (EMA). When the fast EMA crosses the slow EMA, it forms a golden cross or death cross signal. Consecutive golden cross signals indicate that the market may enter an upward trend, at which point a long position is opened; consecutive death cross signals indicate that the market may enter a downward trend, at which point a short position is opened. By capturing these trend turning points, the strategy attempts to profit from market trends.

Strategy Advantages

  1. Simple and easy to understand: The strategy is based on the widely used MACD indicator, which has a simple principle and is easy to understand and implement.
  2. Trend tracking: By capturing consecutive golden cross and death cross signals, the strategy can track the main trends of the market, which helps to profit from trends.
  3. Risk control: The strategy allows users to set take-profit and stop-loss levels, helping to control potential risks and losses.
  4. Flexible backtesting: The strategy provides the option to select the backtest time range, allowing users to evaluate the strategy’s performance over different time periods as needed.

Strategy Risks

  1. Parameter sensitivity: The performance of the MACD indicator depends on the selection of fast and slow EMA periods, and different parameter settings may lead to different trading signals.
  2. Market noise: In oscillating or uncertain market conditions, the MACD indicator may generate more false signals, leading to frequent trades and potential losses.
  3. Trend lag: The MACD indicator is a lagging indicator, and trading signals may appear after the trend has already been established, missing the best entry point.
  4. Stop-loss risk: If the market fluctuates sharply, prices may quickly break through the stop-loss level, resulting in larger losses than expected.

Strategy Optimization Directions

  1. Combine with other indicators: Consider combining the MACD indicator with other technical indicators (such as RSI, Bollinger Bands, etc.) to improve the reliability of signals and filter out false signals.
  2. Parameter optimization: Through backtesting and optimization of different fast and slow EMA periods, find the parameter combination that best suits the specific market and asset.
  3. Dynamic take-profit and stop-loss: Dynamically adjust take-profit and stop-loss levels based on market volatility or price levels to better adapt to market changes and control risk.
  4. Introduce position management: Adjust the position size of each trade based on signal strength or market conditions to optimize the risk-reward ratio.

Summary

This strategy trades based on consecutive MACD golden cross and death cross signals, attempting to capture turning points in market trends. It is simple and easy to understand, can track main trends, and provides risk control and flexible backtesting capabilities. However, the strategy’s performance may be influenced by factors such as parameter selection, market noise, and trend lag. To further improve, one can consider combining it with other indicators, optimizing parameters, introducing dynamic take-profit and stop-loss, and position management. Overall, the strategy provides a basic framework for trend trading, but in practical application, it needs to be carefully evaluated and adjusted to suit specific market conditions and personal risk preferences.


/*backtest
start: 2024-03-01 00:00:00
end: 2024-03-31 23:59:59
period: 1h
basePeriod: 15m
exchanges: [{"eid":"Futures_Binance","currency":"BTC_USDT"}]
*/

//@version=5
strategy("连续MACD交叉和回测范围")
//策略初始化時間設置
useDateFilter = input.bool(true, title="启用时间回测范围", group="回测范围")
backtestStartDate = input(timestamp("1 Jan 2023"), title="开始时间", group="回测范围")
backtestEndDate = input(timestamp("1 Jan 2024"), title="结束时间", group="回测范围")
inTradeWindow = true

// 定义MACD指标参数
fastLength = input.int(12, "快速EMA周期")
slowLength = input.int(26, "慢速EMA周期")
signalSmoothing = input.int(9, "信号线平滑周期")
long_win = input.float(defval = 0.01,title = "多单止盈设置", tooltip = "0.01代表1%" )
long_lose= input.float(0.01,"多单止损设置")
short_win = input.float(0.01,"空单止盈设置")
short_lose = input.float(0.01,"空单止损设置")

// 计算MACD值
[macdLine, signalLine, _] = ta.macd(close, fastLength, slowLength, signalSmoothing)

// 定义金叉和死叉的条件
crossUp = ta.crossover(macdLine, signalLine)
crossDown = ta.crossunder(macdLine, signalLine)

// 使用历史状态记录上一次交叉情况
var lastCrossUp = false
var lastCrossDown = false

// 更新历史状态
if crossUp
    lastCrossUp := true
else if crossDown
    lastCrossUp := false

if crossDown
    lastCrossDown := true
else if crossUp
    lastCrossDown := false

// 交易执行逻辑:检查是否存在连续的金叉或死叉
if lastCrossUp and crossUp and inTradeWindow
    strategy.entry("买入开多", strategy.long)
    strategy.exit("买入止盈止损", "买入开多", limit=close * (1 + long_win), stop=close * (1 - long_lose))

if lastCrossDown and crossDown and inTradeWindow
    strategy.entry("卖出开空", strategy.short)
    strategy.exit("卖出止盈止损", "卖出开空", limit=close * (1 - short_win), stop=close * (1 + short_lose))

// 显示MACD线和信号线
plot(macdLine, "MACD线", color=color.blue)
plot(signalLine, "信号线", color=color.orange)


Related

More