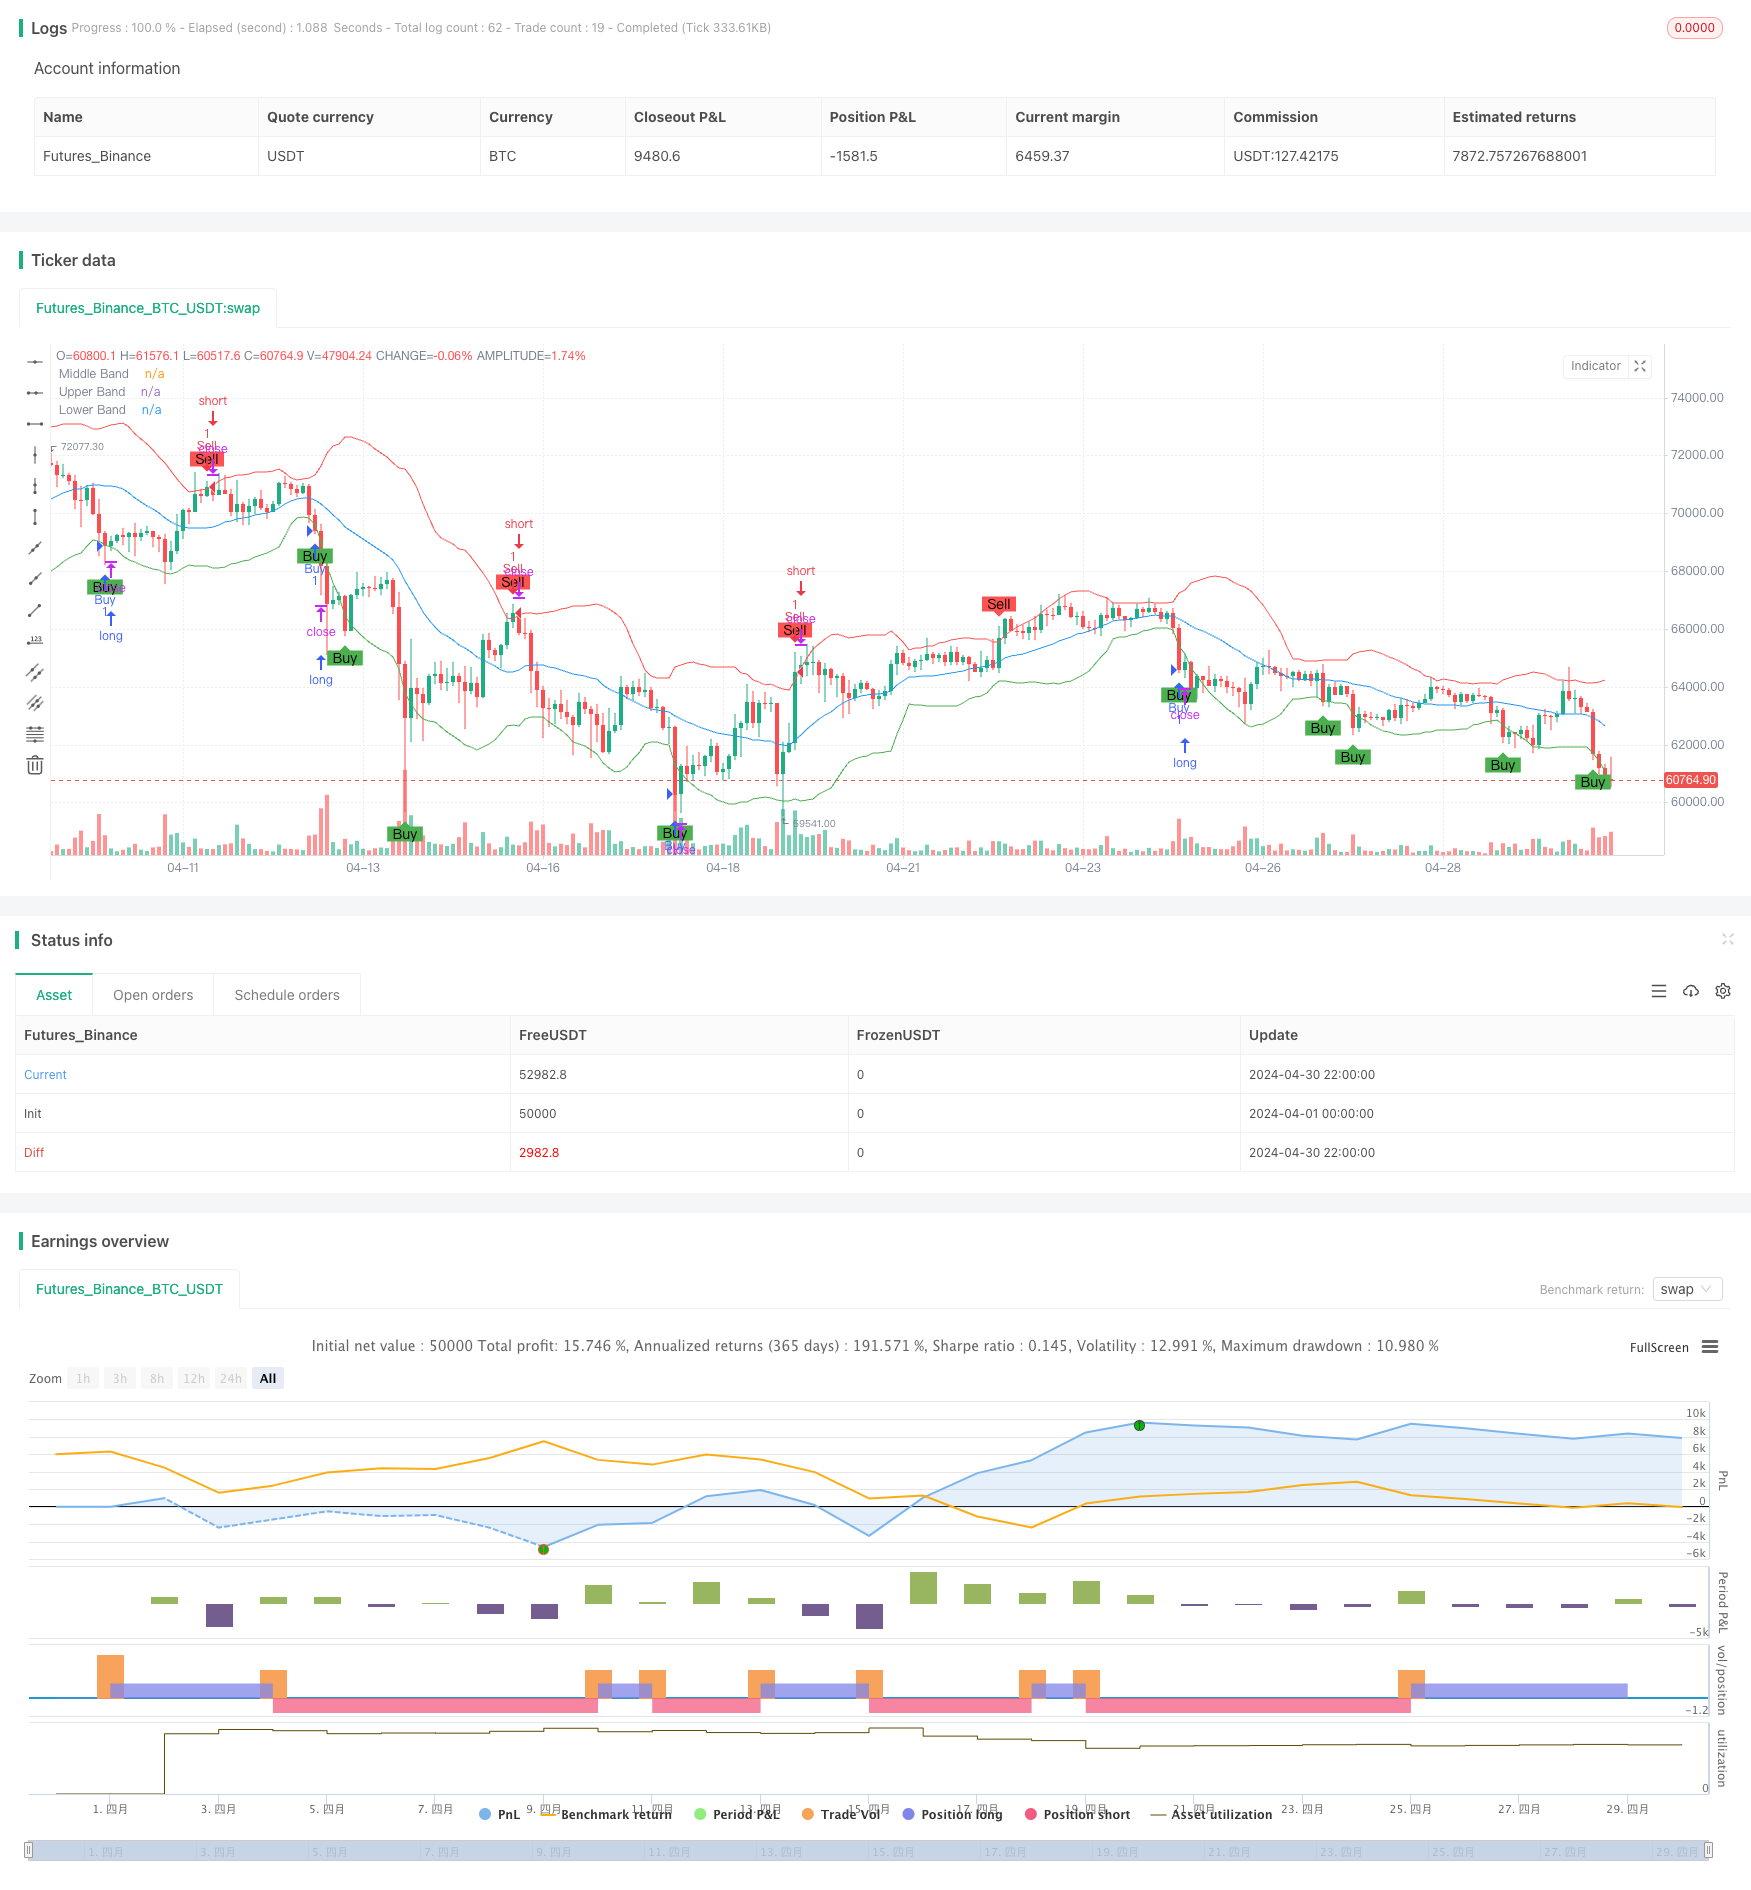
布林带动态止损止盈策略
Author: ChaoZhang, Date: 2024-05-17 15:11:50Tags: SMA

概述
该策略是一个基于布林带的交易策略。它使用布林带来生成买卖信号,并动态设置止损和止盈水平。当价格穿越下轨时产生买入信号,穿越上轨时产生卖出信号。止损位置设置在过去一段时间内的最低价或最高价,止盈位置则根据新的信号动态调整。
策略原理
- 计算布林带上轨、中轨和下轨。
- 当价格穿越下轨时,产生买入信号;当价格穿越上轨时,产生卖出信号。
- 买入时,止损位置设置为过去一段时间内的最低价,止盈位置暂不设置。
- 卖出时,止损位置设置为过去一段时间内的最高价,止盈位置暂不设置。
- 当出现新的买入或卖出信号时,止盈位置重置为空。
策略优势
- 布林带是一个成熟且广泛使用的技术指标,能够有效捕捉市场波动。
- 动态止损和止盈设置能够适应不同的市场条件,提高策略的适应性。
- 止损位置的设置能够有效控制风险,防止单笔交易损失过大。
- 策略逻辑清晰,易于理解和实现。
策略风险
- 在震荡市场中,频繁的买卖信号可能导致过多的交易,增加交易成本。
- 止损位置的设置基于历史数据,可能无法适应未来的市场变化。
- 策略缺乏对趋势方向的判断,可能在强趋势市场中错失机会。
策略优化方向
- 引入趋势判断指标,如移动平均线,在趋势方向上进行交易,提高策略的趋势适应性。
- 优化止损和止盈位置的设置方法,如使用ATR等波动率指标,使其更加动态和适应市场变化。
- 在买卖信号中加入额外的过滤条件,如交易量、波动率等,提高信号的可靠性。
- 对参数进行优化,如布林带的长度和标准差倍数,找到最佳的参数组合。
总结
该策略是一个基于布林带的交易策略,通过布林带的穿越来产生买卖信号,并动态设置止损和止盈水平。策略逻辑清晰,易于实现,能够适应不同的市场条件。但在震荡市场中可能产生过多的交易,并且缺乏对趋势方向的判断。未来可以通过引入趋势判断指标、优化止损止盈设置方法、添加过滤条件和参数优化等方式来提高策略的表现。
/*backtest
start: 2024-04-01 00:00:00
end: 2024-04-30 23:59:59
period: 2h
basePeriod: 15m
exchanges: [{"eid":"Futures_Binance","currency":"BTC_USDT"}]
*/

//@version=5
strategy("Bollinger Bands Strategy", overlay=true)

// Bollinger Bands settings
length = 20
src = close
mult = 2.0

// Calculate Bollinger Bands
basis = ta.sma(src, length)
dev = mult * ta.stdev(src, length)
upper = basis + dev
lower = basis - dev

// Plot Bollinger Bands
plot(basis, color=color.blue, title="Middle Band")
plot(upper, color=color.red, title="Upper Band")
plot(lower, color=color.green, title="Lower Band")

// Trade logic
// Buy when the price crosses below the lower Bollinger Band
buySignal = ta.crossover(lower, src)
// Sell when the price crosses above the upper Bollinger Band
sellSignal = ta.crossover(src, upper)

// Define stop loss and take profit levels
var float stopLoss = na
var float takeProfit = na

// Calculate stop loss and take profit levels
if (buySignal)
    stopLoss := ta.lowest(low, length)
    takeProfit := na
if (sellSignal)
    stopLoss := ta.highest(high, length)
    takeProfit := na

// Update take profit on new signals
if (buySignal)
    takeProfit := na
if (sellSignal)
    takeProfit := na

// Execute trades
if (buySignal)
    strategy.entry("Buy", strategy.long, stop=stopLoss, limit=takeProfit)

if (sellSignal)
    strategy.entry("Sell", strategy.short, stop=stopLoss, limit=takeProfit)

// Plot signals on chart
plotshape(series=buySignal, location=location.belowbar, color=color.green, style=shape.labelup, text="Buy", title="Buy Signal")
plotshape(series=sellSignal, location=location.abovebar, color=color.red, style=shape.labeldown, text="Sell", title="Sell Signal")

// Alert conditions
alertcondition(buySignal, title="Buy Alert", message="Buy Signal detected")
alertcondition(sellSignal, title="Sell Alert", message="Sell Signal detected")
相关内容
- 多维度趋势判断与ATR动态止盈止损策略
- 自适应布林带趋势反转量化交易策略
- 高级多指标趋势确认交易策略
- 双均线-RSI多重信号趋势交易策略
- 自适应趋势跟踪与多重确认交易策略
- 动态调整止损的大象柱形态趋势跟踪策略
- 多均线交叉辅助RSI动态参数量化交易策略
- 多维度K近邻算法与烛台形态的量价分析交易策略
- 基于移动平均线和日内模式的智能追踪止损策略
- 自适应多策略动态切换系统:融合趋势跟踪与区间震荡的量化交易策略
- 多指标多维度趋势交叉高级量化策略
更多内容
- 一目云和ATR策略
- BONK多因子交易策略
- 双均线交叉策略
- HalfTrend多空趋势追踪止损限价买入策略
- Alligator 长期趋势跟踪交易策略
- 基于脉冲MACD和双均线交叉的多时间尺度趋势追踪策略
- EMA5与EMA13交叉策略
- EMA SAR 中长期趋势跟踪策略
- 逆向波动率突破策略
- Nifty50三分钟开盘价突破策略
- 改进型多空转换K线形态突破策略
- Laguerre RSI与ADX滤波交易信号策略
- 价量突破买入策略
- K线连续数目牛熊判断策略
- 超级均线与Upperband交叉策略
- 基于RSI、ADX和一目均衡图的多因子趋势跟踪量化交易策略
- RSI与MACD结合的多空策略
- 一云多均线交易策略
- 威廉鳄鱼均线趋势捕捉策略
- 动态MACD和一目均衡图交易策略