百分比阈值量化交易策略
Author: ChaoZhang, Date: 2024-06-03 16:41:59Tags:
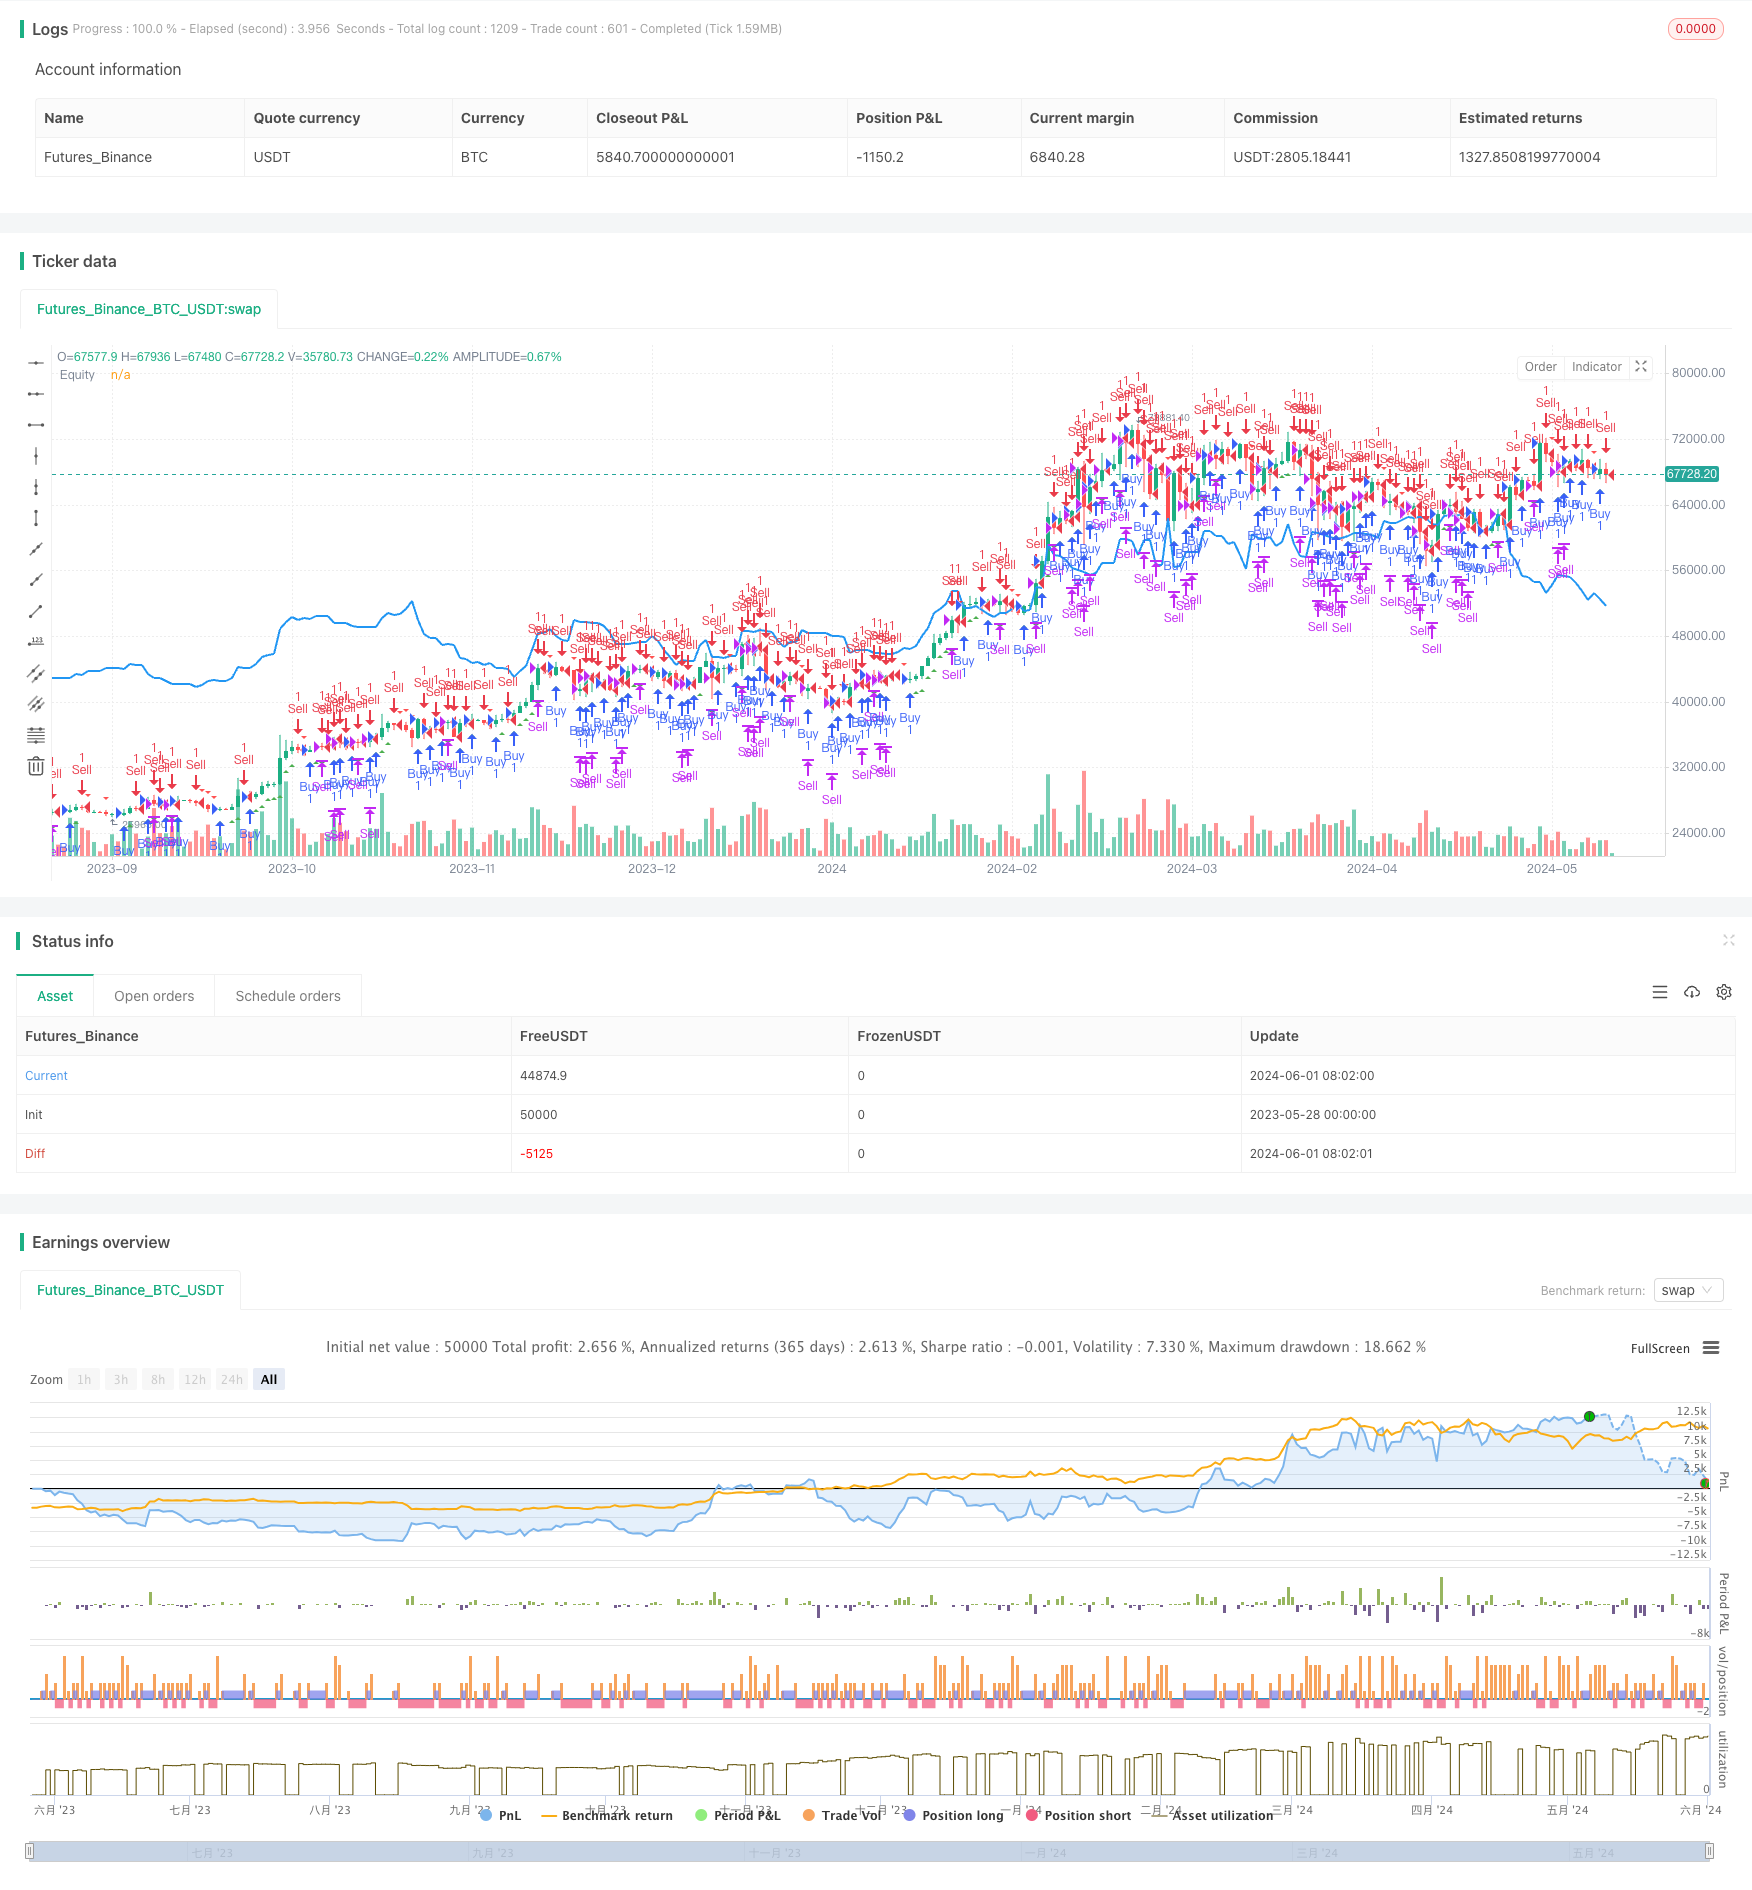
概述
本文介绍了一种基于百分比阈值的量化交易策略。该策略通过设定一个百分比阈值和选择合适的时间周期,来确定买入和卖出的时机。当价格相对于前一个收盘价上涨或下跌超过指定的百分比阈值时,就会触发买入或卖出信号。这个策略可以根据用户的风险偏好和市场状况进行灵活调整,适用于各种金融工具的交易。
策略原理
该策略的核心是根据价格变动的百分比来生成交易信号。首先,用户需要设定一个百分比阈值,表示价格相对于前一个收盘价变动的幅度。同时,用户还要选择一个时间周期,如1分钟、1小时、1天等,用于计算该时间段内的最高价、最低价和收盘价。策略会实时监测市场价格,当前时间周期的最高价超过前一个收盘价加上阈值时,就会触发买入信号;当前时间周期的最低价低于前一个收盘价减去阈值时,就会触发卖出信号。如果在持有多头仓位时触发卖出信号,策略会平掉多头仓位;如果在持有空头仓位时触发买入信号,策略会平掉空头仓位。通过这种方式,策略可以在价格波动较大时及时进行交易,以获取潜在的利润。
策略优势
- 简单易用:该策略只需要设置两个参数,即百分比阈值和时间周期,就可以自动生成交易信号,操作简单。
- 灵活性强:用户可以根据自己的风险偏好和市场特点,调整百分比阈值和时间周期,以适应不同的交易环境。
- 适用范围广:该策略可以应用于各种金融工具,如股票、期货、外汇等,只要有价格数据就可以进行交易。
- 直观明了:策略会在图表上直接标出买入和卖出信号,并绘制出资金曲线,使交易者能够直观地评估策略的表现。
策略风险
- 市场波动风险:当市场价格波动剧烈时,频繁的交易可能会导致较高的交易成本和滑点,影响策略的收益。
- 参数设置风险:不恰当的百分比阈值和时间周期设置可能会导致策略表现不佳,因此需要根据市场特点和个人经验进行调整。
- 过拟合风险:如果策略参数过于优化,可能会导致策略在未来的市场环境中表现不佳,因此需要进行充分的回测和前瞻性分析。
策略优化方向
- 加入止损和止盈机制:为了控制风险,可以在策略中加入止损和止盈的功能,当价格达到预设的止损或止盈价位时自动平仓,以保护资金安全。
- 动态调整参数:可以根据市场波动性的变化,动态调整百分比阈值和时间周期,以适应不同的市场状态。例如,在市场波动加剧时适当提高阈值,以减少交易频率。
- 结合其他技术指标:将该策略与其他技术指标(如移动平均线、相对强弱指标等)相结合,形成更加稳健的交易系统,提高策略的可靠性。
总结
本文介绍了一种基于百分比阈值的量化交易策略,通过设定价格变动的百分比阈值和时间周期,自动生成买入和卖出信号。该策略操作简单,灵活性强,适用范围广,但同时也面临市场波动、参数设置和过拟合等风险。通过加入止损止盈机制、动态调整参数和结合其他技术指标等方法,可以进一步优化该策略的性能,提高其在实际交易中的效果。
/*backtest
start: 2023-05-28 00:00:00
end: 2024-06-02 00:00:00
period: 1d
basePeriod: 1h
exchanges: [{"eid":"Futures_Binance","currency":"BTC_USDT"}]
*/

//@version=5
strategy("GBS Percentage", overlay=true)

// Define input options for percentage settings and timeframe
percentage = input.float(1.04, title="Percentage Threshold", minval=0.01, step=0.01) / 100
timeframe = input.timeframe("D", title="Timeframe", options=["1", "3", "5", "15", "30", "60", "240", "D", "W", "M"])

// Calculate high, low, and close of the selected timeframe
high_timeframe = request.security(syminfo.tickerid, timeframe, high)
low_timeframe = request.security(syminfo.tickerid, timeframe, low)
close_timeframe = request.security(syminfo.tickerid, timeframe, close)

// Calculate the percentage threshold based on the previous close
threshold = close_timeframe[1] * percentage

// Define conditions for Buy and Sell
buyCondition = high_timeframe > (close_timeframe[1] + threshold)
sellCondition = low_timeframe < (close_timeframe[1] - threshold)

// Entry and exit rules
if (buyCondition)
    strategy.entry("Buy", strategy.long)

if (sellCondition)
    strategy.entry("Sell", strategy.short)

// Close the positions based on the conditions
if (sellCondition)
    strategy.close("Buy")

if (buyCondition)
    strategy.close("Sell")

// Plot Buy and Sell signals on the chart
plotshape(series=buyCondition, title="Buy Entry", color=color.green, style=shape.triangleup, location=location.belowbar)
plotshape(series=sellCondition, title="Sell Entry", color=color.red, style=shape.triangledown, location=location.abovebar)

// Plot the equity curve of the strategy
plot(strategy.equity, title="Equity", color=color.blue, linewidth=2)
更多内容
- Elliott 波动随机EMA策略
- 布林带交叉移动平均策略
- SMA双均线交叉策略
- 10SMA与MACD双重趋势跟踪交易策略
- MACD和RSI结合的自然交易策略
- 动态时间框架高低点突破策略
- 动态趋势跟踪策略
- 趋势过滤与异常退出的平滑移动平均止损止盈策略
- MACD与R:R比率日内限制收敛策略
- 星光移动平均交叉策略
- 基于双均线交叉的移动平均线策略
- MACD与Supertrend组合策略
- 基于量价信号和烛台模式的买卖策略
- SMA趋势跟踪策略
- EMA与布林带突破策略
- 基于CDC行动区的ATR止盈止损交易机器人策略
- 基于连续K线动态网格自适应均线动态止损策略
- 移动平均线交叉策略
- 趋势跟随与动量过滤相结合的交易策略
- RSI与线性回归通道交易策略