概述
本文介绍了一种结合MACD和Supertrend两个技术指标的交易策略。该策略利用MACD指标的交叉信号和Supertrend指标的趋势方向来判断进场和出场时机,以期在趋势行情中获取利润。策略的主要思路是在MACD金叉且Supertrend为绿色时做多,在MACD死叉且Supertrend为红色时做空,MACD信号线与MACD线的交叉作为平仓信号。
策略原理
该策略使用MACD指标和Supertrend指标来产生交易信号。MACD由快速移动平均线(默认为12日)减去慢速移动平均线(默认为26日)得到,再计算MACD的9日移动平均线作为信号线。当MACD线上穿信号线时形成金叉,是做多信号;当MACD线下穿信号线时形成死叉,是做空信号。Supertrend指标结合ATR波动率指标,在价格高于Supertrend线且Supertrend线为绿色时表示上升趋势,在价格低于Supertrend线且Supertrend线为红色时表示下降趋势。策略在MACD金叉且Supertrend为绿色时做多,在MACD死叉且Supertrend为红色时做空,以趋势为友。同时当MACD信号线与MACD线交叉时平仓,控制回撤。
策略优势
- 结合趋势和动量指标,能较好地把握趋势行情。MACD指标具有领先性,能提前判断趋势转折,而Supertrend指标能有效过滤震荡行情,两者结合能在趋势行情中及时建仓,提高策略收益。
- 采用信号线交叉作为平仓信号,及时止损止盈。MACD信号线反应了价格的短期趋势,当其与MACD线交叉时,意味着趋势可能反转,及时平仓能有效控制回撤,避免较大亏损。
- 策略逻辑清晰,规则简单,易于实现和优化。该策略仅使用两个常用技术指标,计算方法成熟,可以方便地基于不同参数进行回测和优化。
策略风险
- MACD和Supertrend参数选择的适用性风险。MACD和Supertrend指标的计算均涉及时间周期参数,不同市场和品种的最优参数可能不同,固定参数可能导致策略在某些行情下失效。
- 趋势转折识别滞后的风险。MACD作为趋势型指标,其信号相对价格会有一定滞后性,在趋势转折初期可能仍会发出错误信号。而Supertrend对于趋势转折的判断也存在一定延迟。
- 震荡市中频繁交易的风险。该策略在震荡市中可能会频繁发生金叉和死叉信号,导致过于频繁交易,承担较高的交易成本,降低策略收益。
策略优化方向
- 针对不同品种和周期,对MACD和Supertrend的参数进行优化。可以使用穷举法或遗传算法等,寻找最优参数组合,提高策略的适应性和稳定性。
- 在MACD金叉死叉信号的基础上,添加其他过滤条件,如成交量变化、价格突破等,以进一步确认趋势转折,减少虚假信号。
- 引入仓位管理和止损止盈机制,如ATR止损、百分比止损止盈等,控制单笔交易风险,提高策略回撤控制能力和盈亏比。
- 考虑加入周期过滤或品种轮动规则,减少震荡市中的交易频率,提高策略收益风险比。
总结
本文介绍了一个基于MACD指标和Supertrend指标的交易策略,该策略通过MACD的趋势判断和Supertrend的方向过滤,在趋势行情中进行交易,同时利用信号线交叉及时平仓,以控制回撤。策略优势在于逻辑简单,趋势把握能力强,同时也存在参数适用性、信号滞后性和频繁交易的风险。未来可以从参数优化、信号过滤、仓位管理、周期和品种选择等方面对策略进行完善,以期获得更稳健的收益。
策略源码
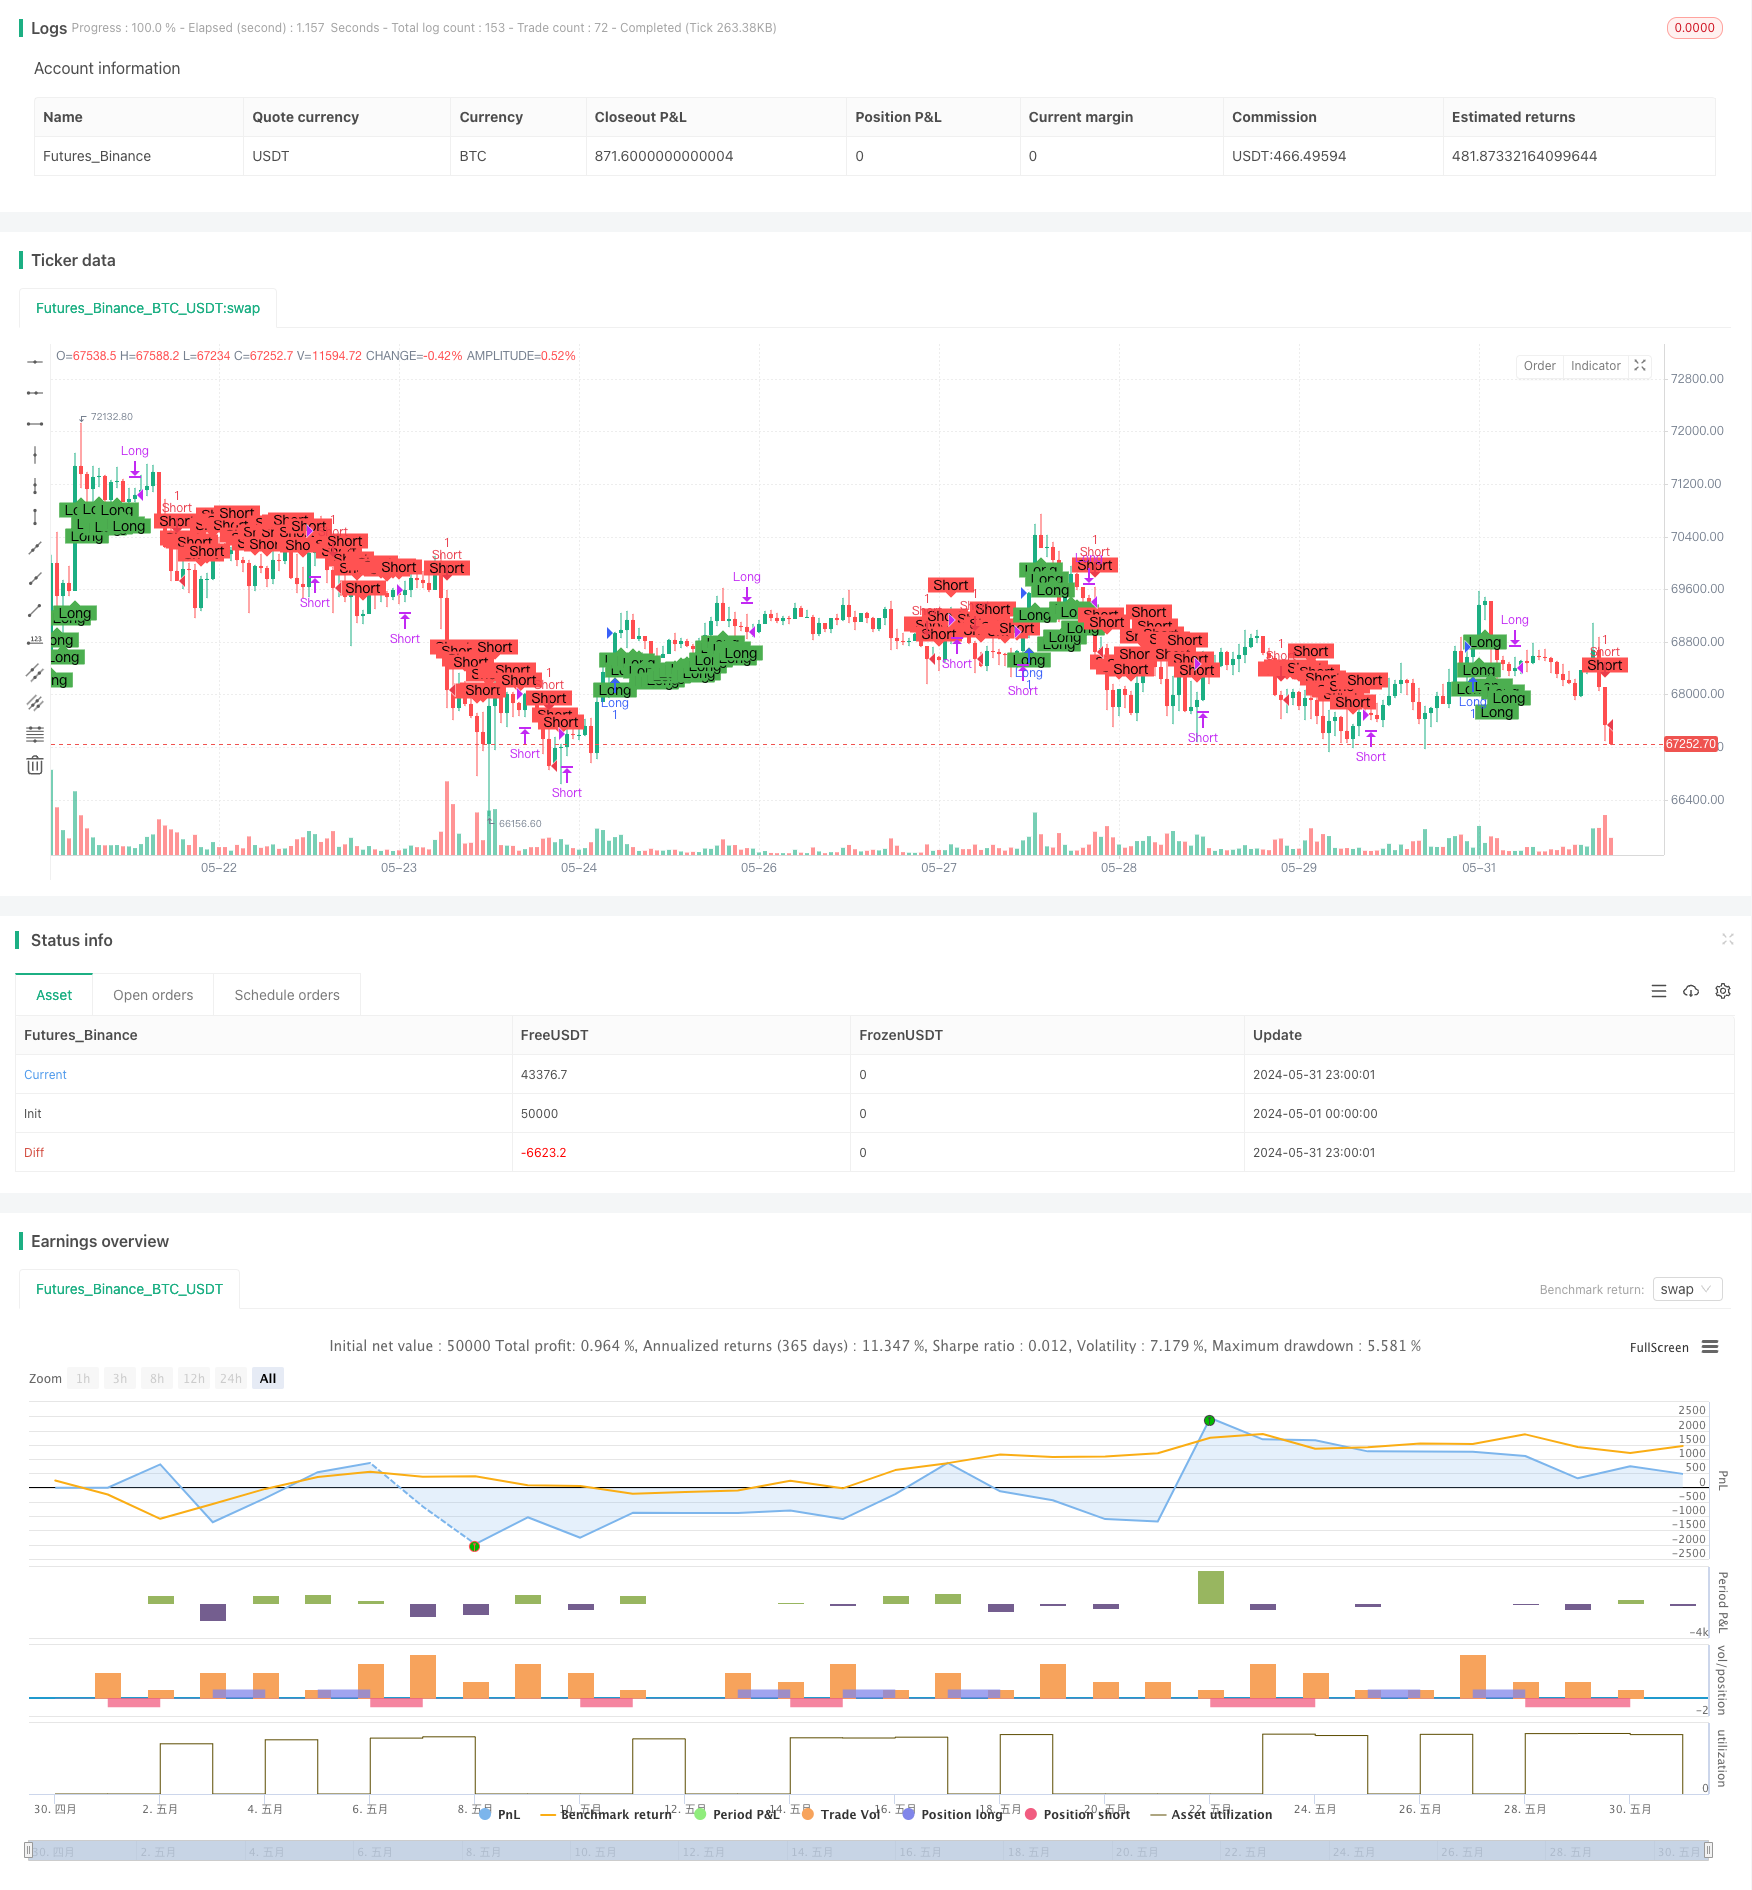
/*backtest
start: 2024-05-01 00:00:00
end: 2024-05-31 23:59:59
period: 1h
basePeriod: 15m
exchanges: [{"eid":"Futures_Binance","currency":"BTC_USDT"}]
*/

//@version=5
strategy(title="MACD + Supertrend Strategy", overlay=true)

// MACD Calculation
fastLength = 12
slowLength = 26
signalSmoothing = 9
macdSrc = close

// MACD Line
fastMA = ta.ema(macdSrc, fastLength)
slowMA = ta.ema(macdSrc, slowLength)
macdLine = fastMA - slowMA

// MACD Signal Line
signalMA = ta.ema(macdLine, signalSmoothing)

// MACD Histogram
histogram = macdLine - signalMA

// Supertrend Calculation
supertrendATRLength = 10
supertrendFactor = 3.0
[supertrend, _] = ta.supertrend(supertrendFactor, supertrendATRLength)

// Entry and Exit Conditions
longCondition = (macdLine > signalMA) and (supertrend < close)
shortCondition = (signalMA > macdLine) and (supertrend > close)

// Long Entry
if longCondition
    strategy.entry("Long", strategy.long)

// Long Exit (Sell)
if signalMA > macdLine
    strategy.close("Long")

// Short Entry
if shortCondition
    strategy.entry("Short", strategy.short)

// Short Exit (Cover)
if macdLine > signalMA
    strategy.close("Short")

// Close Long Position if short condition is met
if shortCondition
    strategy.close("Long")

// Close Short Position if long condition is met
if longCondition
    strategy.close("Short")

// Plotting
plotshape(series=longCondition, title="Long Entry Signal", location=location.belowbar, color=color.green, style=shape.labelup, text="Long")
plotshape(series=shortCondition, title="Short Entry Signal", location=location.abovebar, color=color.red, style=shape.labeldown, text="Short")

// Alerts
alertcondition(longCondition, title='Long Entry Signal', message='MACD crossover and Supertrend below close price')
alertcondition(signalMA > macdLine, title='Long Exit Signal', message='MACD signal line crosses above MACD line')

alertcondition(shortCondition, title='Short Entry Signal', message='MACD crossunder and Supertrend above close price')
alertcondition(macdLine > signalMA, title='Short Exit Signal', message='MACD line crosses above MACD signal line')
相关推荐
- 多维度趋势判断与ATR动态止盈止损策略
- 双重交叉趋势追踪策略:指数均线与MACD协同交易系统
- 多指标多维度趋势交叉高级量化策略
- 基于波动率止损的均线趋势跟踪交易策略
- 多重指标趋势跟踪结合RSI超买超卖的量化交易策略
- 多维度云图价格突破趋势确认量化交易策略
- 多指标趋势动量交易策略:基于布林带、斐波那契和ATR的优化量化交易系统
- 增强型量价趋势判断动量策略
- 基于动量与均线组合的多重技术指标趋势跟踪策略
- 高级MACD均线交叉交易策略结合自适应风险管理
- 多重时间周期平滑烛线移动平均趋势跟踪交易系统
更多内容
- SMA双均线交叉策略
- 10SMA与MACD双重趋势跟踪交易策略
- MACD和RSI结合的自然交易策略
- 动态时间框架高低点突破策略
- 动态趋势跟踪策略
- 趋势过滤与异常退出的平滑移动平均止损止盈策略
- MACD与R:R比率日内限制收敛策略
- 星光移动平均交叉策略
- 百分比阈值量化交易策略
- 基于双均线交叉的移动平均线策略
- 基于量价信号和烛台模式的买卖策略
- SMA趋势跟踪策略
- EMA与布林带突破策略
- 基于CDC行动区的ATR止盈止损交易机器人策略
- 基于连续K线动态网格自适应均线动态止损策略
- 移动平均线交叉策略
- 趋势跟随与动量过滤相结合的交易策略
- RSI与线性回归通道交易策略
- 双重Vegas通道波动性调整SuperTrend量化交易策略
- EMA与RSI交叉策略