概述
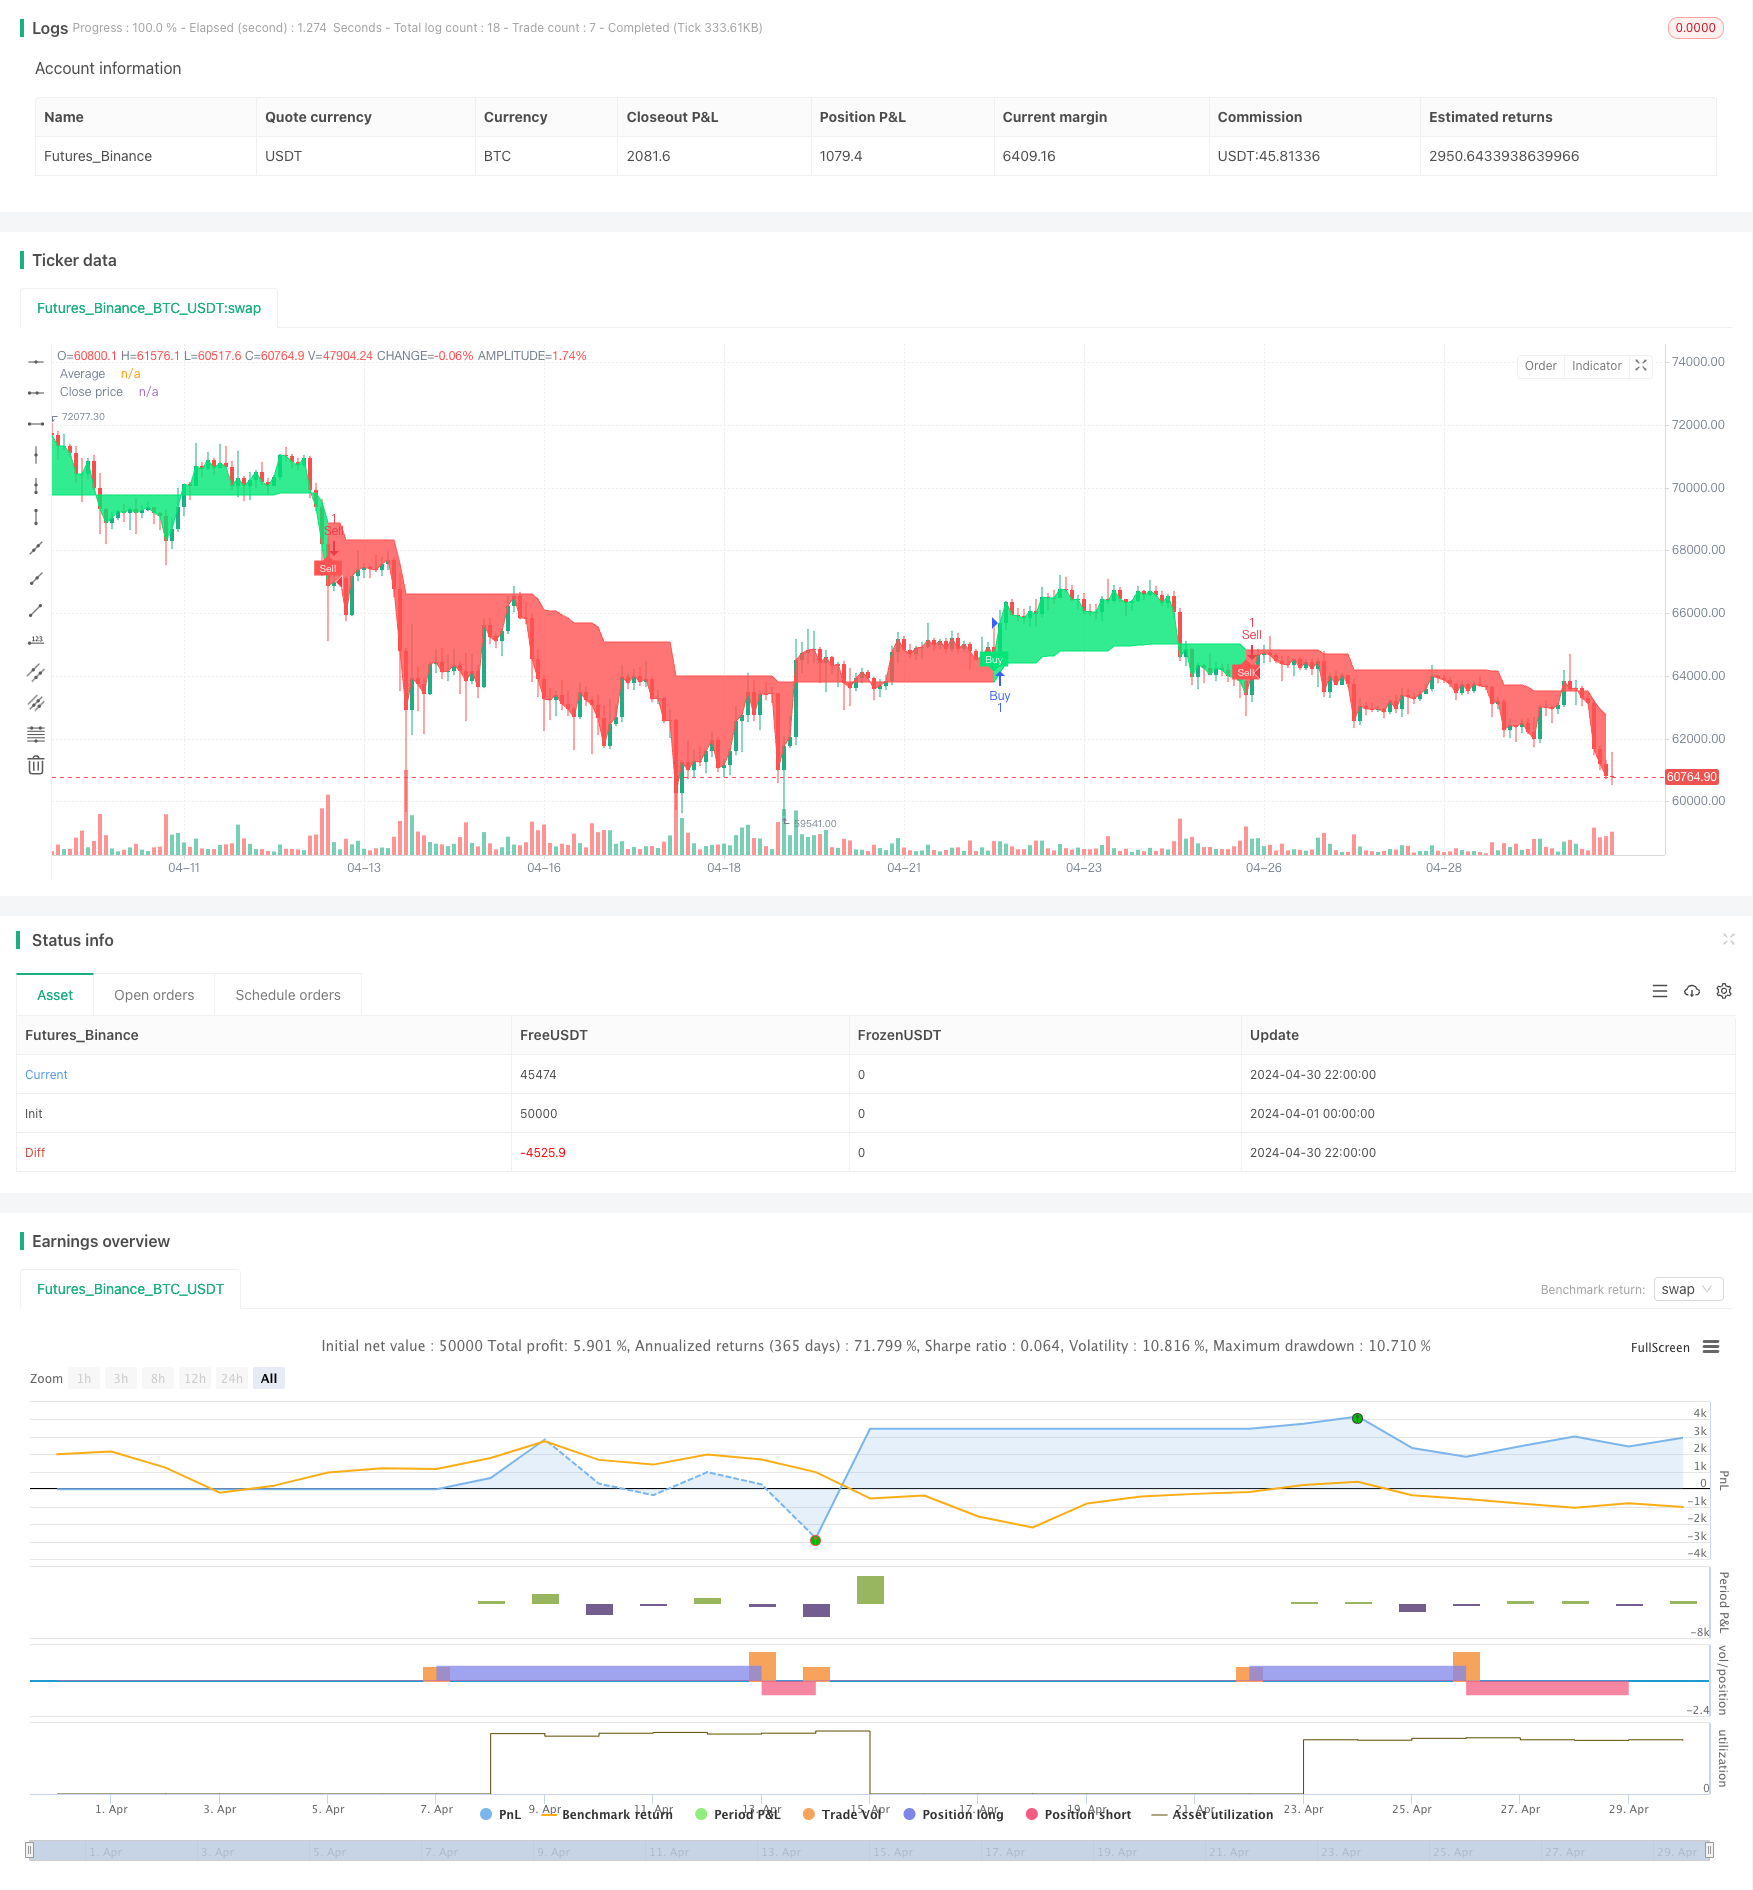
G-Channel趋势检测策略是一种基于G通道指标的量化交易策略。该策略通过计算G通道的上下极值,并根据价格与G通道均线的交叉情况来判断当前的市场趋势,从而产生买卖信号。同时,该策略还设置了止盈止损条件,以控制风险。
策略原理
- 计算G通道的上下极值a和b,其中a为历史最高价与前一周期a值的差值除以周期数,b为历史最低价加上前一周期a值与b值的差值除以周期数。
- 计算G通道均线avg,即(a+b)/2。
- 判断价格与b值的交叉情况,如果价格上穿b值,则认为形成看涨趋势;如果价格下穿a值,则认为形成看跌趋势。
- 在看涨趋势中,如果前一根K线为看跌而当前K线转为看涨,则产生买入信号;在看跌趋势中,如果前一根K线为看涨而当前K线转为看跌,则产生卖出信号。
- 设置止盈止损条件,当持有多头仓位时,止盈价为买入价乘以(1+止盈比例),止损价为买入价乘以(1-止损比例);当持有空头仓位时,止盈价为卖出价乘以(1-止盈比例),止损价为卖出价乘以(1+止损比例)。
策略优势
- G通道指标能够有效捕捉市场趋势,通过价格与G通道均线的交叉情况产生买卖信号,简单易用。
- 止盈止损设置可以有效控制风险,防止单笔交易出现过大损失。
- 策略逻辑清晰,易于理解和实现,适合量化交易新手学习使用。
策略风险
- G通道指标对于市场的震荡行情可能会产生较多的虚假信号,导致频繁交易和较高的滑点成本。
- 止盈止损比例的设置需要根据市场特点和个人风险偏好进行调整,不恰当的参数设置可能导致策略收益不佳。
- 该策略未考虑交易品种的特殊性,如股票策略中可能出现停牌、涨跌停等情况,需要进一步优化。
策略优化方向
- 可以尝试引入其他技术指标,如ATR、RSI等,对G通道指标产生的信号进行二次确认,提高信号的可靠性。
- 对于止盈止损比例,可以采用动态调整的方式,根据市场波动性和持仓时间等因素进行自适应调整,提高策略的适应性。
- 针对交易品种的特点,可以加入相应的风控模块,如对于股票策略,可以设置停牌、涨跌停等特殊情况下的处理逻辑。
总结
G-Channel趋势检测策略是一个基于G通道指标的简单量化交易策略,通过捕捉市场趋势产生买卖信号,并设置止盈止损条件控制风险。该策略逻辑清晰,易于实现,适合量化交易新手学习。但是,该策略对于震荡市可能产生较多虚假信号,止盈止损比例需要根据市场特点进行调整,且未考虑交易品种的特殊性。未来可以通过引入其他技术指标、动态调整止盈止损比例、针对交易品种特点加入风控模块等方式对策略进行优化,以提高策略的稳定性和收益性。
策略源码
//@version=5
// Full credit to AlexGrover: https://www.tradingview.com/script/fIvlS64B-G-Channels-Efficient-Calculation-Of-Upper-Lower-Extremities/
strategy("G-Channel Trend Detection Strategy", shorttitle="G-Trend", overlay=true)

// Input parameters
length = input.int(100, title="Length")
src = input(close, title="Source")
take_profit_percent = input.float(5.0, title="Take Profit (%)")
stop_loss_percent = input.float(2.0, title="Stop Loss (%)")
showcross = input.bool(true, title="Show Cross")

// Initialize variables
var float a = na
var float b = na

// Calculate a and b
a := math.max(src, nz(a[1])) - (nz(a[1]) - nz(b[1])) / length
b := math.min(src, nz(b[1])) + (nz(a[1]) - nz(b[1])) / length

// Calculate average
avg = (a + b) / 2

// Determine trend and color
crossup = ta.crossunder(b, close)
crossdn = ta.crossunder(a, close)
bullish = ta.barssince(crossdn) <= ta.barssince(crossup)
c = bullish ? color.lime : color.red

// Plotting
p1 = plot(avg, "Average", color=c, linewidth=1)
p2 = plot(close, "Close price", color=c, linewidth=1)
fill(p1, p2, c)

// Generate buy and sell signals
buy_signal = showcross and bullish and not bullish[1]
sell_signal = showcross and not bullish and bullish[1]

// Plot buy and sell signals on chart
plotshape(buy_signal ? avg : na, location=location.belowbar, style=shape.labeldown, color=color.new(color.lime, 0), size=size.tiny, text="Buy", textcolor=color.white, offset=-1)
plotshape(sell_signal ? avg : na, location=location.abovebar, style=shape.labelup, color=color.new(color.red, 0), size=size.tiny, text="Sell", textcolor=color.white, offset=-1)

// Alerts
alertcondition(buy_signal, title="Buy Signal", message="Buy Signal Detected")
alertcondition(sell_signal, title="Sell Signal", message="Sell Signal Detected")

// Calculate take profit and stop loss levels
take_profit_level = close * (1 + take_profit_percent / 100)
stop_loss_level = close * (1 - stop_loss_percent / 100)

// Strategy Entry and Exit
if (buy_signal)
    strategy.entry("Buy", strategy.long)

if (sell_signal)
    strategy.entry("Sell", strategy.short)

// Define the take profit and stop loss conditions for long positions
strategy.exit("Take Profit/Stop Loss", "Buy", limit=take_profit_level, stop=stop_loss_level)

// Define the take profit and stop loss conditions for short positions
strategy.exit("Take Profit/Stop Loss", "Sell", limit=close * (1 - take_profit_percent / 100), stop=close * (1 + stop_loss_percent / 100))
相关推荐