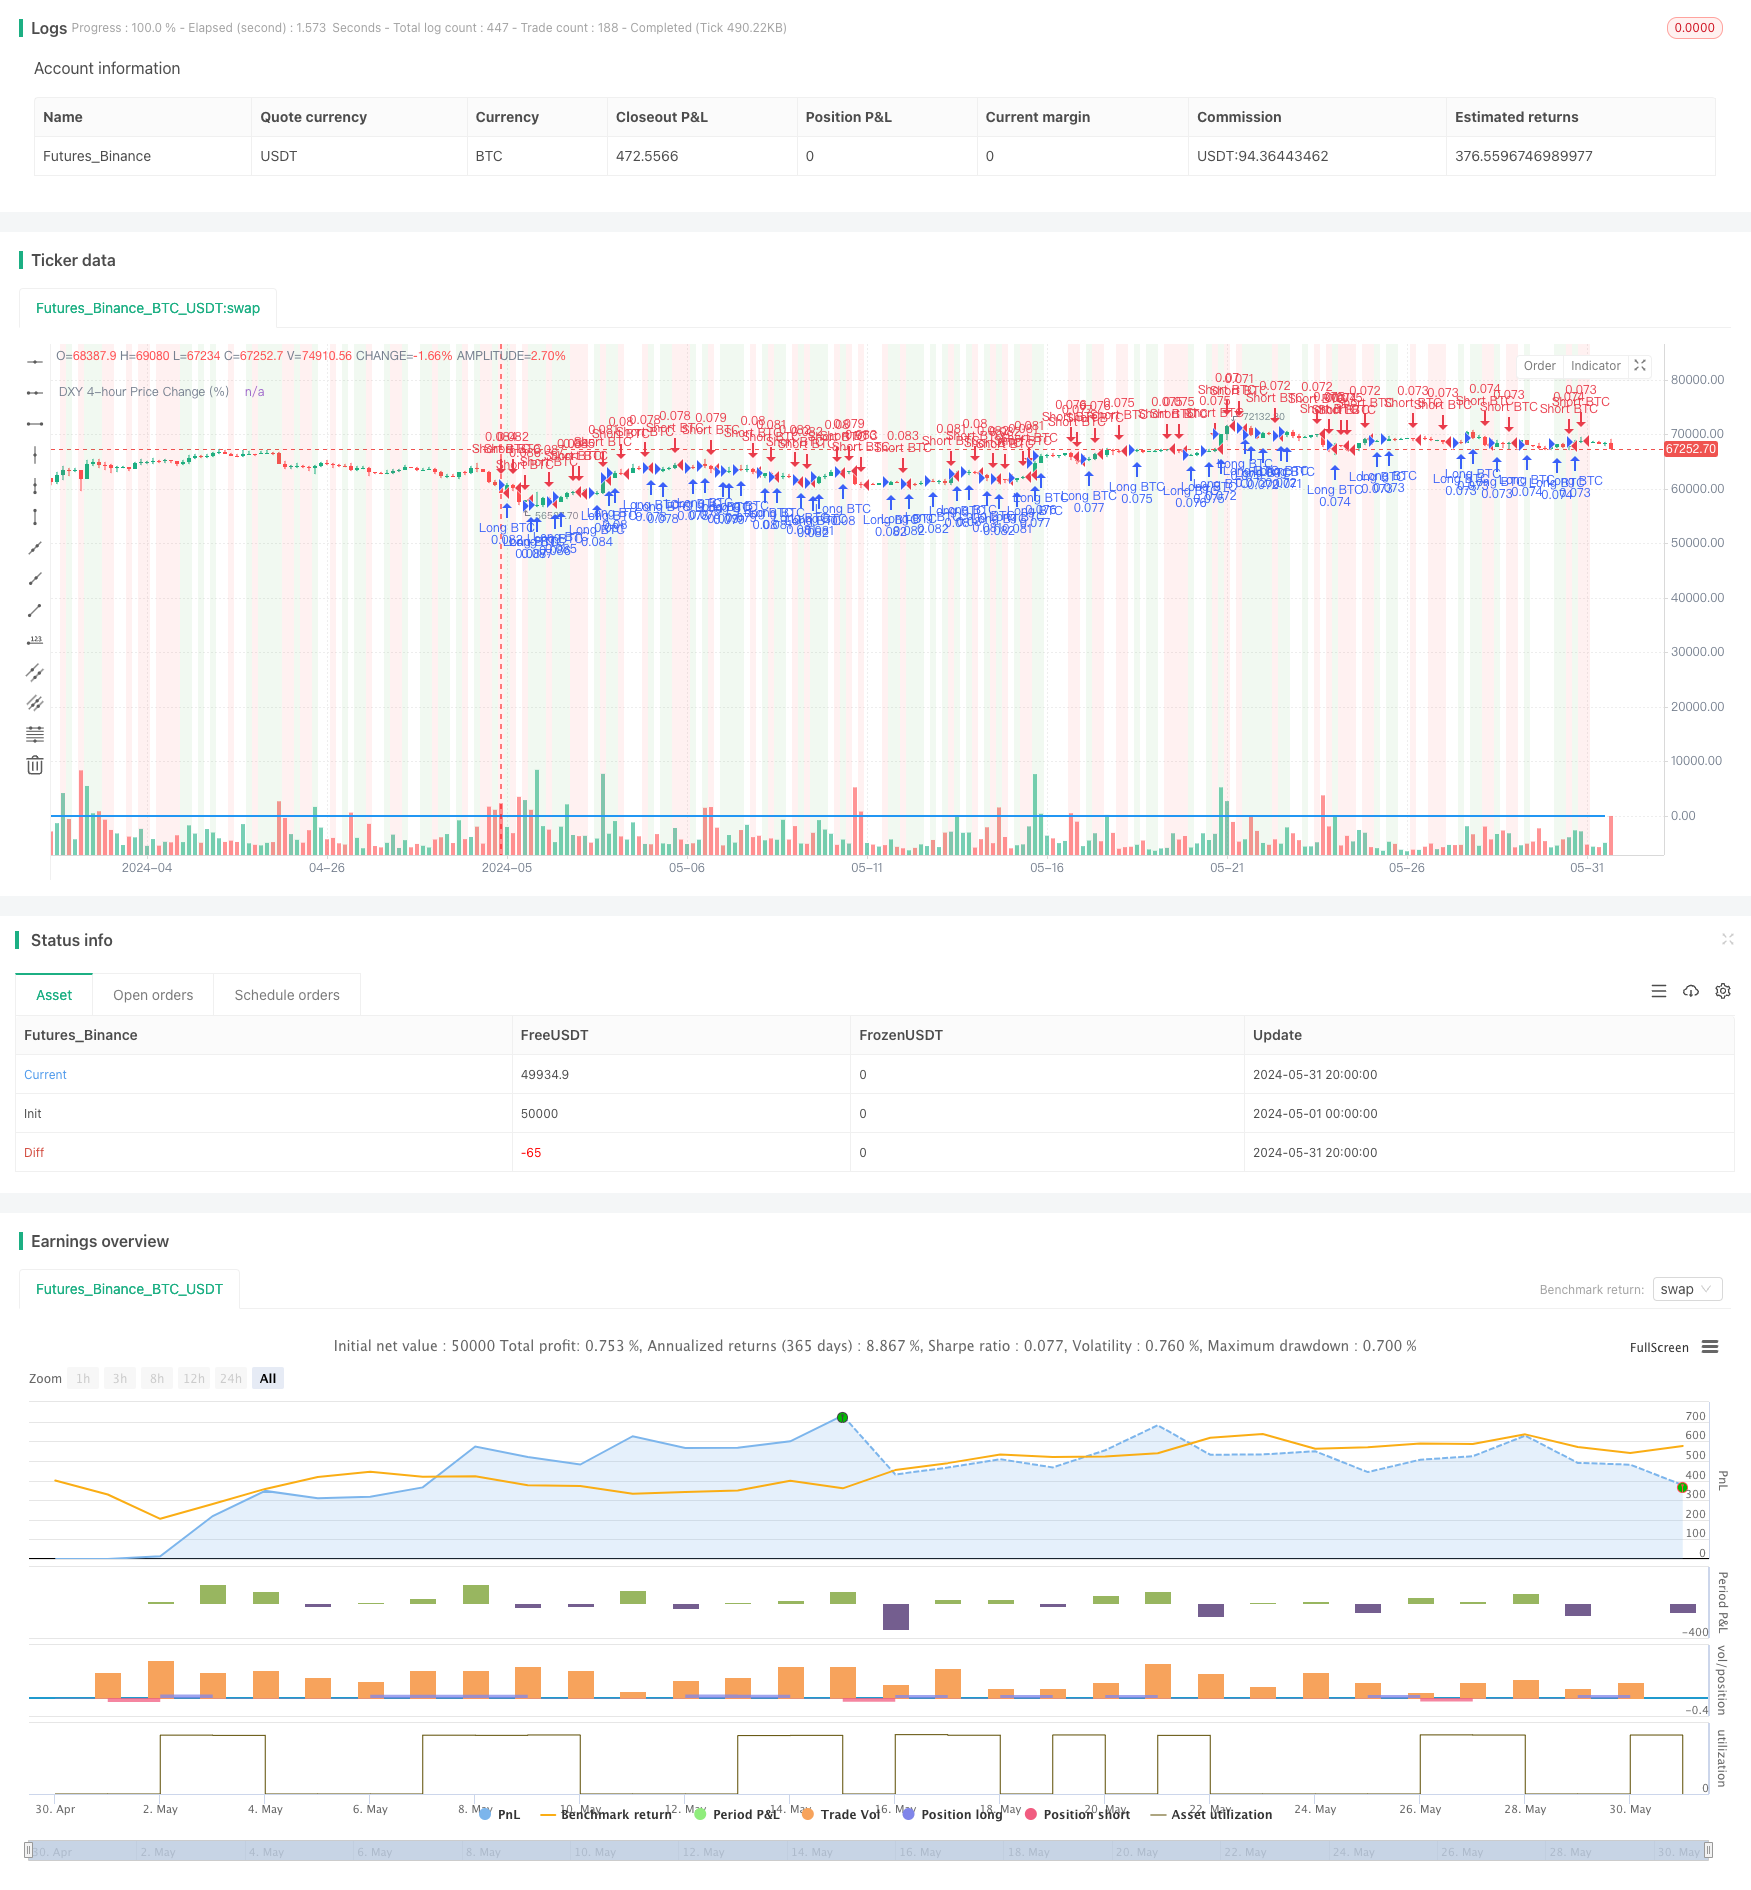
概述
该策略利用两个不同市场之间的价格关系,通过监控市场A在30分钟时间周期内的变化,识别市场A的显著变化,然后在市场B上触发相应的交易。当市场A下跌0.1%或更多时,策略会在市场B上建立空头仓位;当市场A上涨0.1%或更多时,策略会在市场B上建立多头仓位。该策略还允许用户自定义止盈和止损百分比,以优化风险管理和利润目标。
策略原理
该策略的核心原理是利用两个市场价格之间的负相关关系。历史数据表明,市场A与市场B价格之间存在平均-0.6的负相关性。这意味着,当市场A下跌时,市场B价格往往会上涨;反之亦然。该策略通过在30分钟时间周期内监控市场A的变化,捕捉市场A的显著变化,然后在市场B上建立相应的仓位。具体来说,当市场A下跌0.1%或更多时,策略会在市场B上建立空头仓位;当市场A上涨0.1%或更多时,策略会在市场B上建立多头仓位。同时,该策略使用止盈和止损订单来管理每笔交易的风险和利润。
策略优势
- 利用两个市场价格之间的负相关性,提供了一种基于市场间关系的交易机会。
- 使用30分钟的时间周期,能够捕捉市场A的显著变化,同时过滤掉一些短期噪音。
- 允许用户自定义止盈和止损百分比,提供了灵活的风险管理和利润目标设置。
- 使用背景颜色来可视化交易信号,方便用户快速识别交易机会。
- 代码结构清晰,易于理解和修改,适合进一步优化和定制。
策略风险
- 两个市场价格之间的负相关性可能并非始终稳定,在某些市场条件下可能会失效。
- 固定的0.1%的价格变化阈值可能并不适用于所有市场环境,需要根据市场波动性进行调整。
- 止盈和止损百分比的设置需要根据市场条件和个人风险偏好进行优化,不当的设置可能导致过早止盈或过晚止损。
- 该策略仅考虑了市场A的价格变化,而没有纳入其他可能影响市场B价格的因素,如监管政策、市场情绪等。
策略优化方向
- 引入动态阈值:根据市场A的历史波动性,动态调整价格变化阈值,以适应不同的市场环境。
- 纳入其他影响因素:除了市场A,还可以考虑纳入其他宏观经济指标、市场特定因素等,以提高策略的稳健性。
- 优化止盈和止损设置:使用更高级的止盈和止损设置方法,如基于波动性的自适应止盈止损、尾随止损等,以更好地管理风险和利润。
- 引入仓位管理:根据市场环境和策略表现,动态调整每笔交易的仓位大小,以优化资金利用率和风险管理。
- 结合其他技术指标:在市场A价格变化的基础上,结合其他技术分析指标,如移动平均线、相对强弱指数等,以提高交易信号的可靠性。
总结
该策略利用了两个市场价格之间的负相关性,通过监控市场A的显著变化,在市场B上建立相应的仓位。该策略的优势在于利用市场间关系提供交易机会,同时允许用户自定义风险管理和利润目标。然而,该策略也存在一些风险,如相关性的稳定性、固定阈值的局限性等。未来可以通过引入动态阈值、纳入其他影响因素、优化止盈止损设置、引入仓位管理以及结合其他技术指标等方式对策略进行优化,以提高其稳健性和盈利能力。
策略源码
/*backtest
start: 2024-05-01 00:00:00
end: 2024-05-31 23:59:59
period: 4h
basePeriod: 15m
exchanges: [{"eid":"Futures_Binance","currency":"BTC_USDT"}]
*/

// This Pine Script™ code is subject to the terms of the Mozilla Public License 2.0 at https://mozilla.org/MPL/2.0/
// © Kingcoinmilioner

//@version=5
strategy("DXY/BTC Arbitrage Strategy", overlay=true, default_qty_type=strategy.percent_of_equity, default_qty_value=10)

// Input for Take Profit and Stop Loss
tp_percent = input.float(1.0, title="Take Profit (%)")
sl_percent = input.float(1.0, title="Stop Loss (%)")

// Fetching DXY data on a 4-hour interval
dxy = request.security("BTC_USDT:swap", "30", close)
dxy_open = request.security("BTC_USDT:swap", "30", open)

// Calculate the price change percentage
price_change_percent = (dxy - dxy_open) / dxy_open * 100

// Plot the price change percentage on the chart
plot(price_change_percent, title="DXY 4-hour Price Change (%)", color=color.blue, linewidth=2)

// Define trade entry conditions
short_condition = price_change_percent <= -0.1
long_condition = price_change_percent >= 0.1

// Initiate short BTC if DXY has a red candle of -0.1%
if (short_condition)
    strategy.entry("Short BTC", strategy.short)
    // Setting Take Profit and Stop Loss for short
    strategy.exit("Take Profit/Stop Loss Short", "Short BTC", limit=close * (1 - tp_percent / 100), stop=close * (1 + sl_percent / 100))

// Initiate long BTC if DXY has a green candle of 0.1%
if (long_condition)
    strategy.entry("Long BTC", strategy.long)
    // Setting Take Profit and Stop Loss for long
    strategy.exit("Take Profit/Stop Loss Long", "Long BTC", limit=close * (1 + tp_percent / 100), stop=close * (1 - sl_percent / 100))

// Visualization
bgcolor(short_condition ? color.new(color.red, 90) : na, title="Short BTC Signal")
bgcolor(long_condition ? color.new(color.green, 90) : na, title="Long BTC Signal")
相关推荐