মুভিং এভারেজ, সাপোর্ট/রেসিস্ট্যান্স এবং ভলিউমের উপর ভিত্তি করে অ্যাডভান্স এন্ট্রি কৌশল
লেখক:চাওঝাং, তারিখঃ 2024-06-14 15:40:46ট্যাগঃ

সারসংক্ষেপ
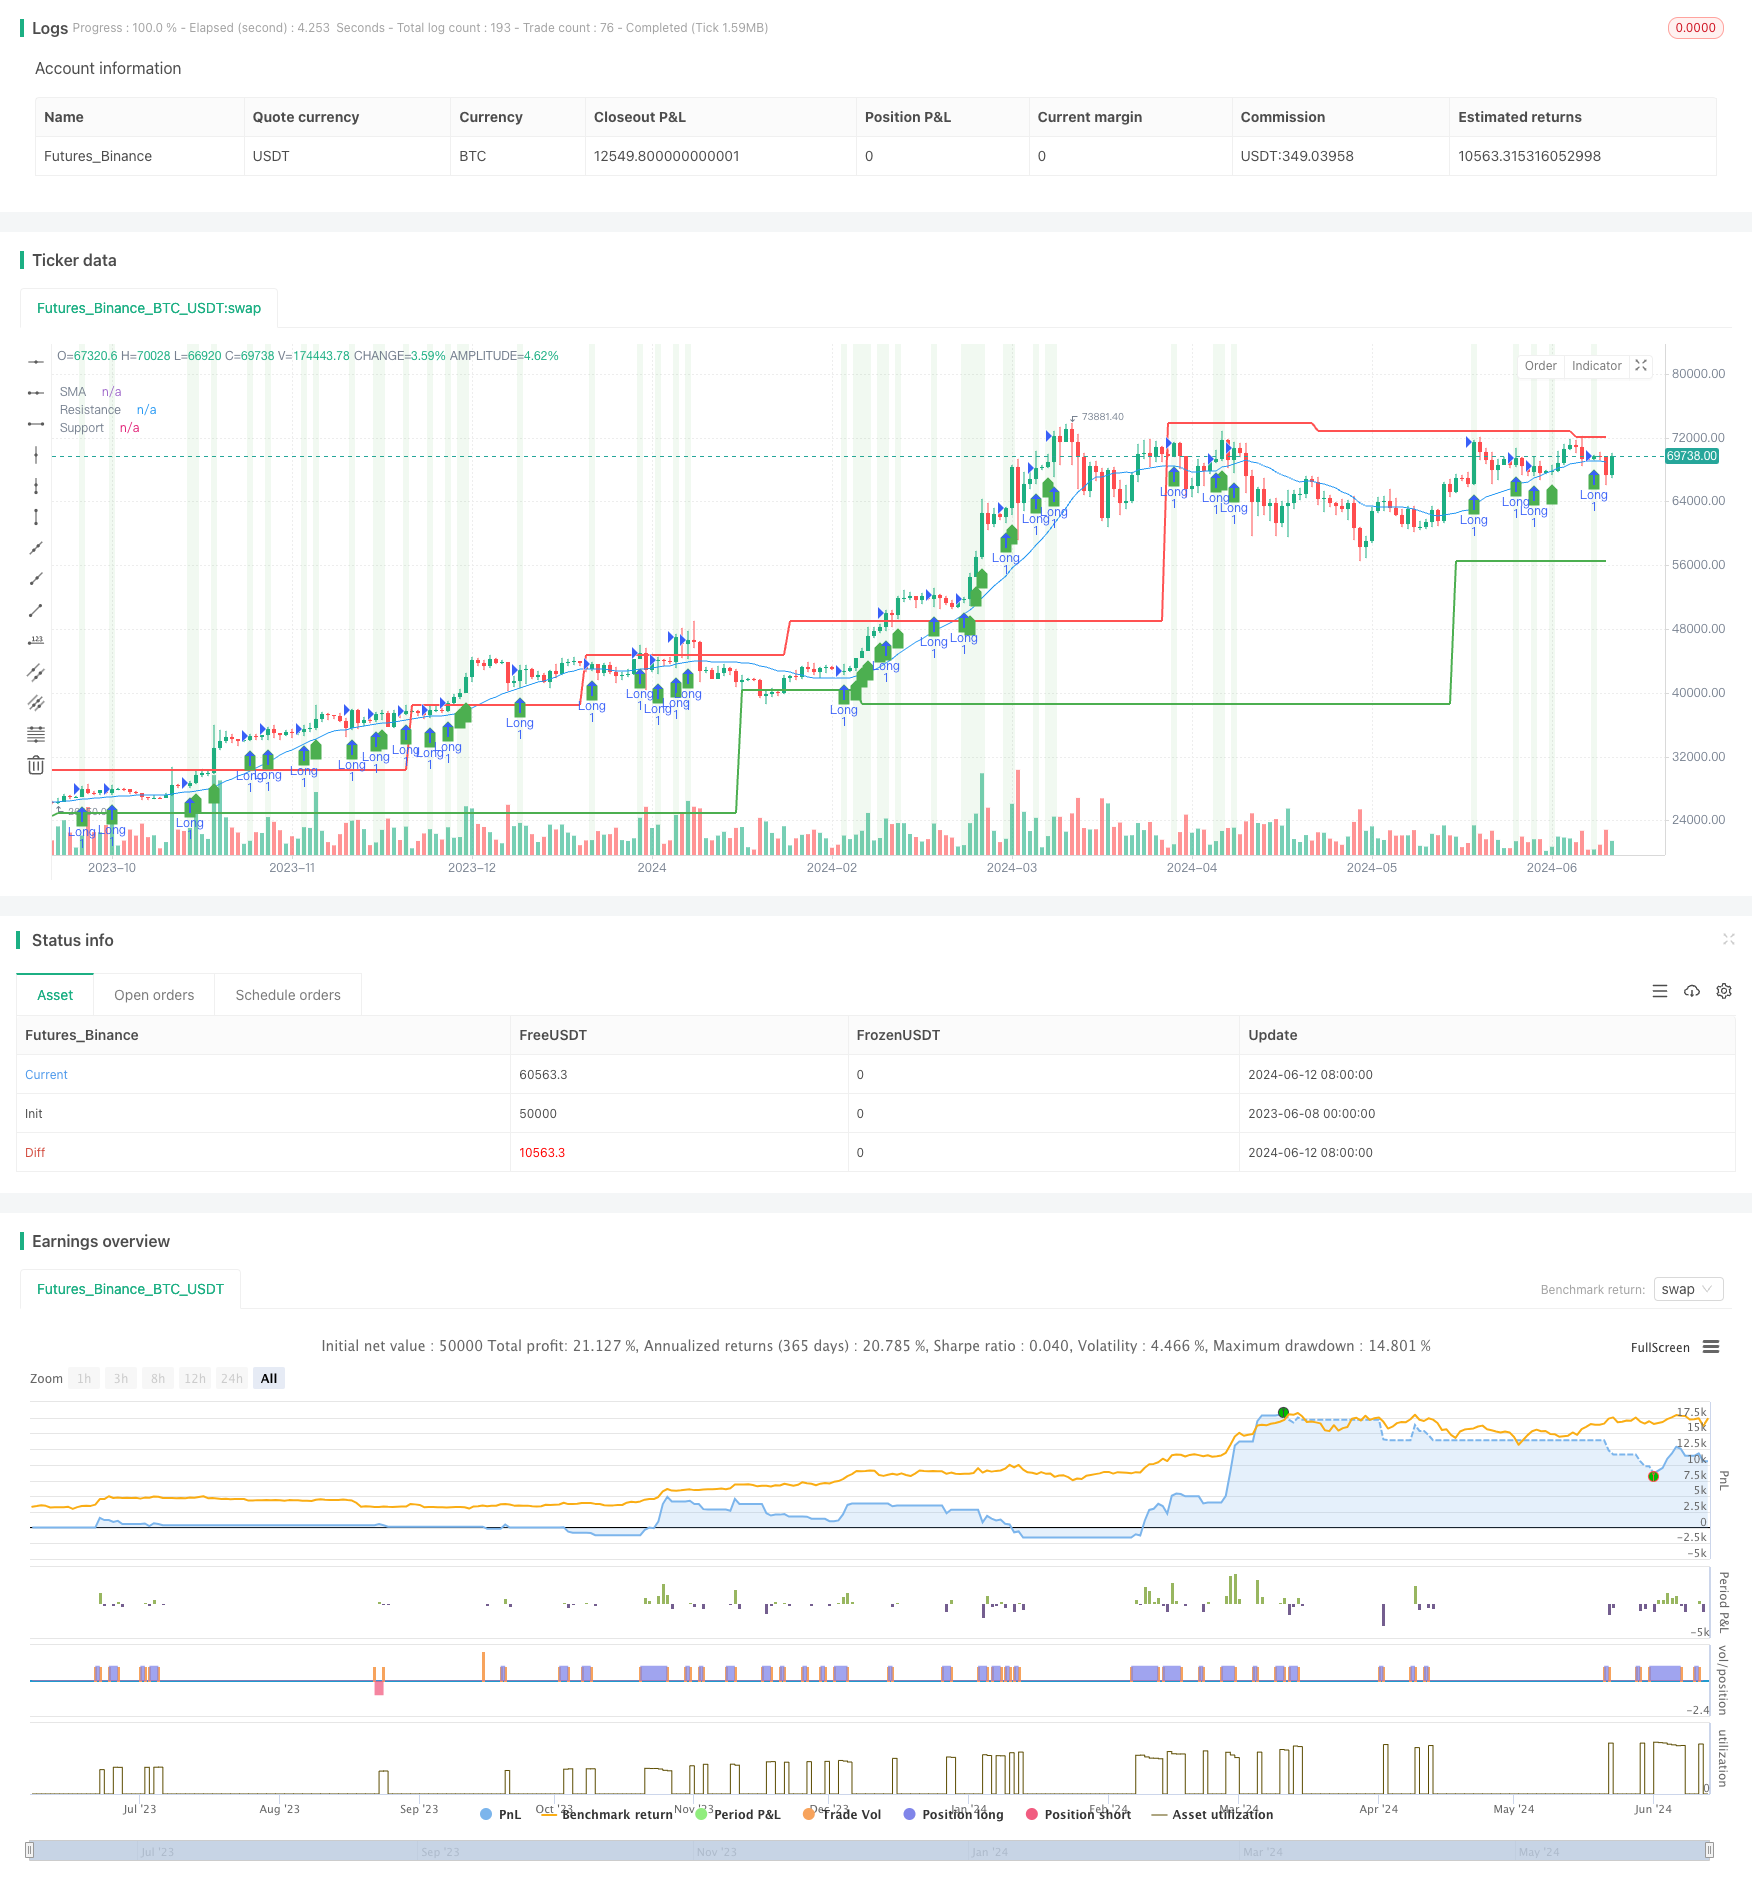
এই কৌশলটি তিনটি প্রযুক্তিগত সূচককে একত্রিত করেঃ সহজ চলমান গড় (এসএমএ), সমর্থন এবং প্রতিরোধের স্তর, এবং একটি বিস্তৃত ট্রেডিং কৌশল তৈরির জন্য ট্রেডিং ভলিউম বৃদ্ধি। কৌশলটির মূল ধারণাটি হ'ল যখন দাম এসএমএ, সমর্থন / প্রতিরোধের স্তরগুলি ভেঙে যায় এবং ঝুঁকি নিয়ন্ত্রণের জন্য স্টপ-লস শর্তগুলি সেট করার সময় ট্রেডিং ভলিউমের বৃদ্ধি সহ হয়।
কৌশল নীতি
- নির্দিষ্ট সময়ের জন্য এসএমএ, সাপোর্ট এবং রেসিস্ট্যান্স লেভেল গণনা করুন।
- পূর্ববর্তী সময়ের তুলনায় বর্তমান ট্রেডিংয়ের পরিমাণ বৃদ্ধি পেয়েছে কিনা তা নির্ধারণ করুন।
- লং এন্ট্রি শর্তঃ বর্তমান বন্ধের মূল্য পূর্ববর্তী সময়ের বন্ধের মূল্যের চেয়ে বেশি, এসএমএ এবং সমর্থন স্তরের চেয়ে বেশি, এবং দামটি প্রতিরোধের স্তর থেকে একটি নির্দিষ্ট দূরত্বে রয়েছে, যার সাথে ট্রেডিং ভলিউম বৃদ্ধি পায়।
- শর্ট এন্ট্রি শর্তঃ বর্তমান বন্ধের মূল্য পূর্ববর্তী সময়ের বন্ধের মূল্যের চেয়ে কম, এসএমএ এবং সমর্থন স্তরের চেয়ে কম, এবং দামটি প্রতিরোধের স্তর থেকে একটি নির্দিষ্ট দূরত্বে রয়েছে, যার সাথে ট্রেডিং ভলিউম বৃদ্ধি পায়।
- স্টপ লস শর্তঃ দীর্ঘ স্টপ লস মূল্য হল প্রবেশ মূল্য গুণিত (1 - স্টপ লস শতাংশ), এবং সংক্ষিপ্ত স্টপ লস মূল্য হল প্রবেশ মূল্য গুণিত (1 + স্টপ লস শতাংশ) ।
সুবিধা বিশ্লেষণ
- একাধিক প্রযুক্তিগত সূচককে একত্রিত করে, কৌশলটির নির্ভরযোগ্যতা এবং স্থিতিশীলতা উন্নত হয়।
- এসএমএ-র দামের ব্রেকআউট এবং সমর্থন/প্রতিরোধের স্তর উভয়ই বিবেচনা করে ট্রেন্ডিং সুযোগগুলি আরও ভালভাবে ক্যাপচার করা সম্ভব।
- ট্রেডিং ভলিউম সূচক চালু করা নিশ্চিত করে যে, মূল্যের ব্রেকআউটের সাথে পর্যাপ্ত মার্কেট পার্টনারশিপ থাকে, যা সিগন্যালের কার্যকারিতা বাড়ায়।
- স্টপ-লস শর্তাবলী নির্ধারণ করে ট্রেডিং ঝুঁকি কার্যকরভাবে নিয়ন্ত্রণ করা যায়।
ঝুঁকি বিশ্লেষণ
- সমর্থন এবং প্রতিরোধের মাত্রা হিসাব করা হয় ঐতিহাসিক তথ্যের উপর ভিত্তি করে এবং বাজারের উল্লেখযোগ্য ওঠানামা চলাকালীন কার্যকারিতা হারাতে পারে।
- ট্রেডিং ভলিউম সূচকটি অস্বাভাবিক ওঠানামা দেখা দিতে পারে, যার ফলে মিথ্যা সংকেত পাওয়া যায়।
- স্টপ-লস শর্তাবলী নির্ধারণ করা চরম বাজারের পরিস্থিতিতে ক্ষতি সম্পূর্ণরূপে এড়াতে পারে না।
অপ্টিমাইজেশান দিক
- ট্রেডিং সিগন্যালের নির্ভরযোগ্যতা আরও যাচাই করার জন্য অন্যান্য প্রযুক্তিগত সূচক যেমন রিলেটিভ স্ট্রেনথ ইনডেক্স (আরএসআই) বা মুভিং মিডিয়ার কনভার্জেন্স ডিভার্জেন্স (এমএসিডি) প্রবর্তন বিবেচনা করুন।
- বিভিন্ন বাজারের অবস্থার সাথে মানিয়ে নিতে আরও গতিশীল পদ্ধতি গ্রহণের মতো সমর্থন এবং প্রতিরোধের স্তরের জন্য গণনার পদ্ধতিটি অনুকূল করা।
- ট্রেডিং ভলিউম সূচকটি মসৃণ করুন যাতে কৌশলটির উপর অস্বাভাবিক ওঠানামা প্রভাব হ্রাস পায়।
- স্টপ-লস শর্তাবলী সেট করার অপ্টিমাইজেশান করুন, যেমন একটি ট্রেলিং স্টপ-লস ব্যবহার করা বা বাজারের অস্থিরতার ভিত্তিতে স্টপ-লস শতাংশকে গতিশীলভাবে সামঞ্জস্য করা।
সংক্ষিপ্তসার
এই কৌশলটি একটি বিস্তৃত ট্রেডিং কৌশল তৈরি করতে এসএমএ, সমর্থন এবং প্রতিরোধের স্তর এবং ট্রেডিং ভলিউম সূচকগুলিকে একত্রিত করে। কৌশলটির সুবিধা হ'ল ট্রেডিং ঝুঁকি নিয়ন্ত্রণের সময় ট্রেন্ডিং সুযোগগুলি ক্যাপচার করার ক্ষমতা। তবে কৌশলটির কিছু সীমাবদ্ধতা রয়েছে, যেমন চরম বাজারের পরিস্থিতিতে এর অভিযোজনযোগ্যতা উন্নত করা দরকার। ভবিষ্যতে, কৌশলটি অন্যান্য প্রযুক্তিগত সূচক প্রবর্তন, সমর্থন এবং প্রতিরোধের স্তরের জন্য গণনার পদ্ধতি অনুকূলিতকরণ, ট্রেডিং ভলিউম সূচক মসৃণকরণ এবং এর স্থায়িত্ব এবং লাভজনকতা বাড়ানোর জন্য স্টপ-লস শর্তগুলি অনুকূলিতকরণ করে উন্নত করা যেতে পারে।
/*backtest
start: 2023-06-08 00:00:00
end: 2024-06-13 00:00:00
period: 1d
basePeriod: 1h
exchanges: [{"eid":"Futures_Binance","currency":"BTC_USDT"}]
*/

//@version=4
strategy("Advanced Entry Conditions with Support/Resistance, SMA, and Volume", overlay=true)

// Inputs
length = input(20, title="SMA Length")
stopLossPerc = input(1, title="Stop Loss Percentage", type=input.float) / 100
leftBars = input(15, title="Left Bars")
rightBars = input(15, title="Right Bars")
distanceThresh = input(1, title="Distance Threshold from Support/Resistance", type=input.float) / 100

// Calculations
smaValue = sma(close, length)
highUsePivot = fixnan(pivothigh(leftBars, rightBars)[1])
lowUsePivot = fixnan(pivotlow(leftBars, rightBars)[1])

// Volume Calculation
volumeIncrease = volume > volume[1]

// Entry Conditions
longEntryCondition = close[0] > close[1] and close[1] > smaValue and close[0] > smaValue and close[0] > lowUsePivot and close[1] > lowUsePivot and abs(close[0] - highUsePivot) > distanceThresh and volumeIncrease
shortEntryCondition = close[0] < close[1] and close[1] < smaValue and close[0] < smaValue and close[0] < lowUsePivot and close[1] < lowUsePivot and abs(close[0] - highUsePivot) > distanceThresh and volumeIncrease

// Calculate stop loss levels
longStopLoss = close * (1 - stopLossPerc)
shortStopLoss = close * (1 + stopLossPerc)

// Strategy Logic
strategy.entry("Long", strategy.long, when=longEntryCondition)
strategy.exit("Exit Long", "Long", stop=longStopLoss)

strategy.entry("Short", strategy.short, when=shortEntryCondition)
strategy.exit("Exit Short", "Short", stop=shortStopLoss)

// Plotting
plot(smaValue, color=color.blue, title="SMA")
plot(highUsePivot, color=color.red, linewidth=2, title="Resistance")
plot(lowUsePivot, color=color.green, linewidth=2, title="Support")

plotshape(series=longEntryCondition, location=location.belowbar, color=color.green, style=shape.labelup, title="Long Entry")
plotshape(series=shortEntryCondition, location=location.abovebar, color=color.red, style=shape.labeldown, title="Short Entry")

// Background Color
bgcolor(longEntryCondition ? color.new(color.green, 90) : shortEntryCondition ? color.new(color.red, 90) : na)
- ডাবল মুভিং এভারেজ ক্রসওভার, আরএসআই এবং স্টোকাস্টিক সূচকগুলির উপর ভিত্তি করে স্বল্পমেয়াদী পরিমাণগত ট্রেডিং কৌশল
- RSI নিম্ন পয়েন্ট বিপরীত কৌশল
- ফিশার ট্রান্সফর্ম ডায়নামিক থ্রেশহোল্ড ট্রেন্ড
- গড় বিপরীতমুখী কৌশল
- EMA100 এবং NUPL এর তুলনামূলক অব্যবহৃত মুনাফা পরিমাণগত ট্রেডিং কৌশল
- স্টোকাস্টিক অস্কিলেটর ভিত্তিক ভোল্টেবিলিটি রেঞ্জ ট্রেডিং কৌশল
- সহজ সমন্বিত কৌশলঃ পিভট পয়েন্ট সুপারট্রেন্ড এবং ডিএমএ
- ইএমএ ট্রেন্ড ফিল্টার কৌশল
- চলমান গড় ক্রসওভার কৌশল
- ইনট্রা ডে ব্রেকআউট স্ট্র্যাটেজি ৩ মিনিটের মোমবাতি উচ্চ নিম্ন পয়েন্টের ভিত্তিতে
- ইএমএ আরএসআই এমএসিডি ডায়নামিক টেক লাভ এবং স্টপ লস ট্রেডিং কৌশল
- G-Trend EMA ATR ইন্টেলিজেন্ট ট্রেডিং স্ট্র্যাটেজি
- 200-দিনের চলমান গড় এবং স্টোকাস্টিক অস্কিলেটরের উপর ভিত্তি করে ট্রেন্ড অনুসরণকারী কৌশল
- আরএসআই ট্রেন্ড কৌশল
- ইএমএ ক্রসওভার ইমপুটাম স্ক্যালপিং কৌশল
- বিবি ব্রেকআউট কৌশল
- ভিডাব্লুএপি এবং আরএসআই ডায়নামিক বোলিংজার ব্যান্ডস লাভ এবং স্টপ লস কৌশল গ্রহণ করে
- চ্যান্ডে-ক্রোল স্টপ ডায়নামিক এটিআর ট্রেন্ড স্ট্র্যাটেজি অনুসরণ
- এই কৌশল Chaikin মানি ফ্লো (CMF) এর উপর ভিত্তি করে ট্রেডিং সংকেত উৎপন্ন করে
- ট্রেন্ড ফিল্টারড পিন বার বিপরীত কৌশল