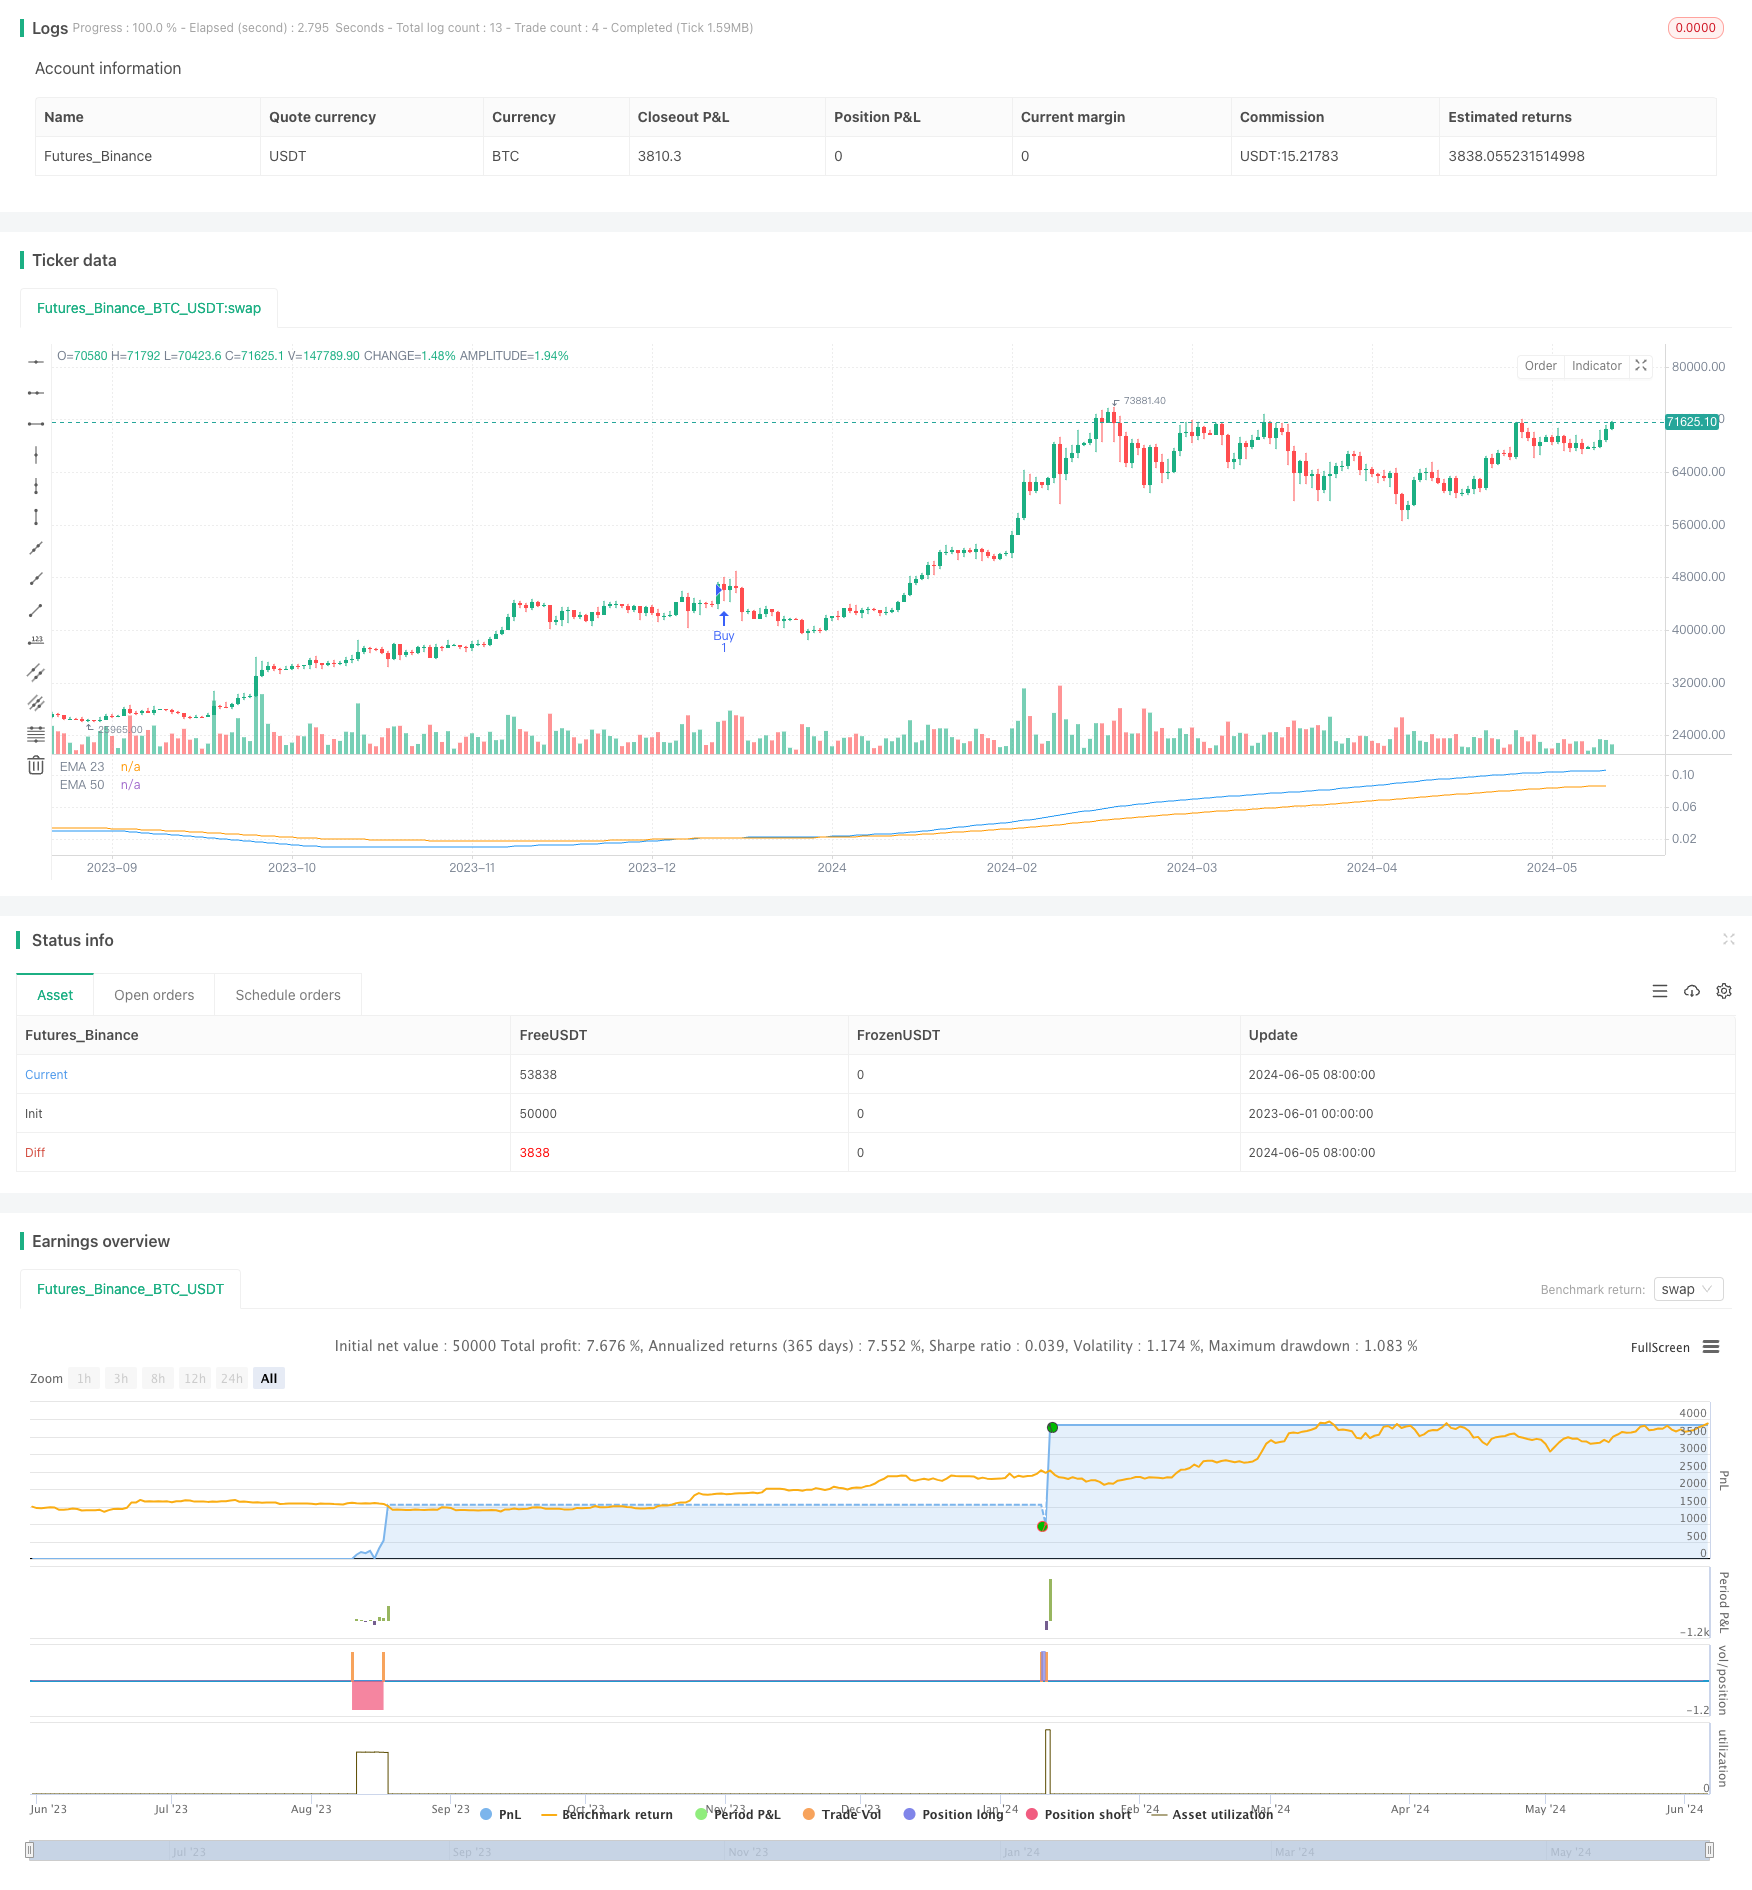
基于Chaikin资金流量(CMF)指标策略
Author: ChaoZhang, Date: 2024-06-07 17:05:04Tags:
 CASHISKING | CASHISKING
CMF, EMA, SMA
概述
该策略基于Chaikin资金流量(CMF)指标和指数移动平均线(EMA)来生成交易信号。首先计算指定周期内的CMF值,然后使用两条不同周期的EMA来平滑CMF数据。当快速EMA在慢速EMA上方交叉时产生买入信号,反之则产生卖出信号。该策略还设置了止损和止盈条件,以控制风险和锁定利润。
策略原理
- 计算指定周期内的Chaikin资金流量(CMF)值,CMF指标结合了价格和成交量数据,用于衡量资金流入和流出的强度。
- 使用两条不同周期的指数移动平均线(EMA)对CMF数据进行平滑处理,快速EMA用于捕捉短期趋势,慢速EMA用于确定长期趋势。
- 当快速EMA在慢速EMA上方交叉时,产生买入信号;当快速EMA在慢速EMA下方交叉时,产生卖出信号。
- 在产生交易信号后,策略会等待两根K线的确认,以避免假信号。
- 设置止损和止盈条件,止损价格为开仓价格的一定百分比,止盈价格为开仓价格的一定百分比。
优势分析
- 结合价格和成交量数据:CMF指标综合考虑了价格和成交量数据,能够更全面地反映市场资金流动情况,提供更可靠的交易信号。
- 趋势跟踪:通过使用不同周期的EMA,策略能够同时捕捉短期和长期趋势,适应不同的市场环境。
- 信号确认:在产生交易信号后,策略会等待两根K线的确认,有效过滤掉一些假信号,提高交易的成功率。
- 风险控制:设置了止损和止盈条件,能够有效控制单笔交易的风险,同时锁定已获得的利润。
风险分析
- 参数优化:策略的表现依赖于CMF和EMA的周期选择,不同的市场环境可能需要不同的参数设置,因此需要定期进行参数优化。
- 趋势识别:在震荡市或者趋势转折点,策略可能会产生较多的假信号,导致频繁交易和资金损失。
- 滑点和交易成本:频繁的交易可能会增加滑点和交易成本,影响策略的整体收益。
优化方向
- 动态调整参数:根据市场环境的变化,动态调整CMF和EMA的周期参数,以适应不同的市场状态。
- 引入其他指标:结合其他技术指标,如相对强弱指数(RSI)、平均真实波幅(ATR)等,以提高趋势识别的准确性和信号的可靠性。
- 优化止损和止盈:根据市场波动性和风险偏好,动态调整止损和止盈的百分比,以更好地控制风险和锁定利润。
- 加入仓位管理:根据市场趋势和信号强度,动态调整仓位大小,在趋势明确时加大仓位,在不确定时减小仓位。
总结
该策略利用Chaikin资金流量指标和指数移动平均线,结合价格和成交量数据,以趋势跟踪为主要思路,同时设置了止损和止盈条件来控制风险。策略的优势在于能够综合考虑多方面因素,捕捉不同时间尺度的趋势,但在参数设置和趋势识别方面仍有优化空间。未来可以通过动态调整参数、引入其他指标、优化止损止盈以及加入仓位管理等方式,进一步提高策略的稳定性和盈利能力。
/*backtest
start: 2023-06-01 00:00:00
end: 2024-06-06 00:00:00
period: 1d
basePeriod: 1h
exchanges: [{"eid":"Futures_Binance","currency":"BTC_USDT"}]
*/

//@version=5
strategy("CASHISKING", overlay=false)

// Kullanıcı girişleri ile parametreler
cmfPeriod = input.int(200, "CMF Periyodu", minval=1)
emaFastPeriod = input.int(80, "Hızlı EMA Periyodu", minval=1)
emaSlowPeriod = input.int(160, "Yavaş EMA Periyodu", minval=1)
stopLossPercent = input.float(3, "Stop Loss Yüzdesi", minval=0.1) / 100
stopGainPercent = input.float(5, "Stop Gain Yüzdesi", minval=0.1) / 100

// CMF hesaplama fonksiyonu
cmfFunc(close, high, low, volume, length) =>
    clv = ((close - low) - (high - close)) / (high - low)
    valid = not na(clv) and not na(volume) and (high != low)
    clv_volume = valid ? clv * volume : na
    sum_clv_volume = ta.sma(clv_volume, length)
    sum_volume = ta.sma(volume, length)
    cmf = sum_volume != 0 ? sum_clv_volume / sum_volume : na
    cmf

// CMF değerlerini hesaplama
cmf = cmfFunc(close, high, low, volume, cmfPeriod)

// EMA hesaplamaları
emaFast = ta.ema(cmf, emaFastPeriod)
emaSlow = ta.ema(cmf, emaSlowPeriod)

// Göstergeleri çiz
plot(emaFast, color=color.blue, title="EMA 23")
plot(emaSlow, color=color.orange, title="EMA 50")

// Alım ve Satım Sinyalleri
crossOverHappened = ta.crossover(emaFast, emaSlow)
crossUnderHappened = ta.crossunder(emaFast, emaSlow)

// Kesişme sonrası bekleme sayacı
var int crossOverCount = na
var int crossUnderCount = na

if (crossOverHappened)
    crossOverCount := 0

if (crossUnderHappened)
    crossUnderCount := 0

if (not na(crossOverCount))
    crossOverCount += 1

if (not na(crossUnderCount))
    crossUnderCount += 1

// Alım ve Satım işlemleri
if (crossOverCount == 2)
    strategy.entry("Buy", strategy.long)
    crossOverCount := na  // Sayaç sıfırlanır

if (crossUnderCount == 2)
    strategy.entry("Sell", strategy.short)
    crossUnderCount := na  // Sayaç sıfırlanır

// Stop Loss ve Stop Gain hesaplama
longStopPrice = strategy.position_avg_price * (1 - stopLossPercent)
shortStopPrice = strategy.position_avg_price * (1 + stopLossPercent)
longTakeProfitPrice = strategy.position_avg_price * (1 + stopGainPercent)
shortTakeProfitPrice = strategy.position_avg_price * (1 - stopGainPercent)

// Stop Loss ve Stop Gain'i uygula
if (strategy.position_size > 0 and strategy.position_avg_price > 0)
    strategy.exit("Stop", "Buy", stop=longStopPrice, limit=longTakeProfitPrice)
else if (strategy.position_size < 0 and strategy.position_avg_price > 0)
    strategy.exit("Stop", "Sell", stop=shortStopPrice, limit=shortTakeProfitPrice)
更多内容
- 基于三分钟K线高低点的日内突破策略
- 基于均线、支撑阻力和交易量的高级入场条件策略
- EMA RSI MACD动态止盈止损交易策略
- G趋势EMA ATR智能交易策略
- 基于200日均线和随机振子的趋势追踪策略
- RSI趋势策略
- EMA交叉动量短线交易策略
- BB均线突破策略
- VWAP与RSI动态布林带止盈止损策略
- Chande-Kroll止损动态ATR趋势跟踪策略
- 趋势过滤Pin Bar反转策略
- 基于支撑位和阻力位反转形态的量化交易策略
- 均线,简单移动平均线,均线斜率,追踪止损,重新进场
- TSI交叉策略
- EMA双均线交叉策略
- Williams %R 动态调整止盈止损策略
- RSI动态回撤止损策略
- VWAP交易策略与成交量异常监测
- Supertrend和EMA组合策略
- TGT基于价格下跌买入策略