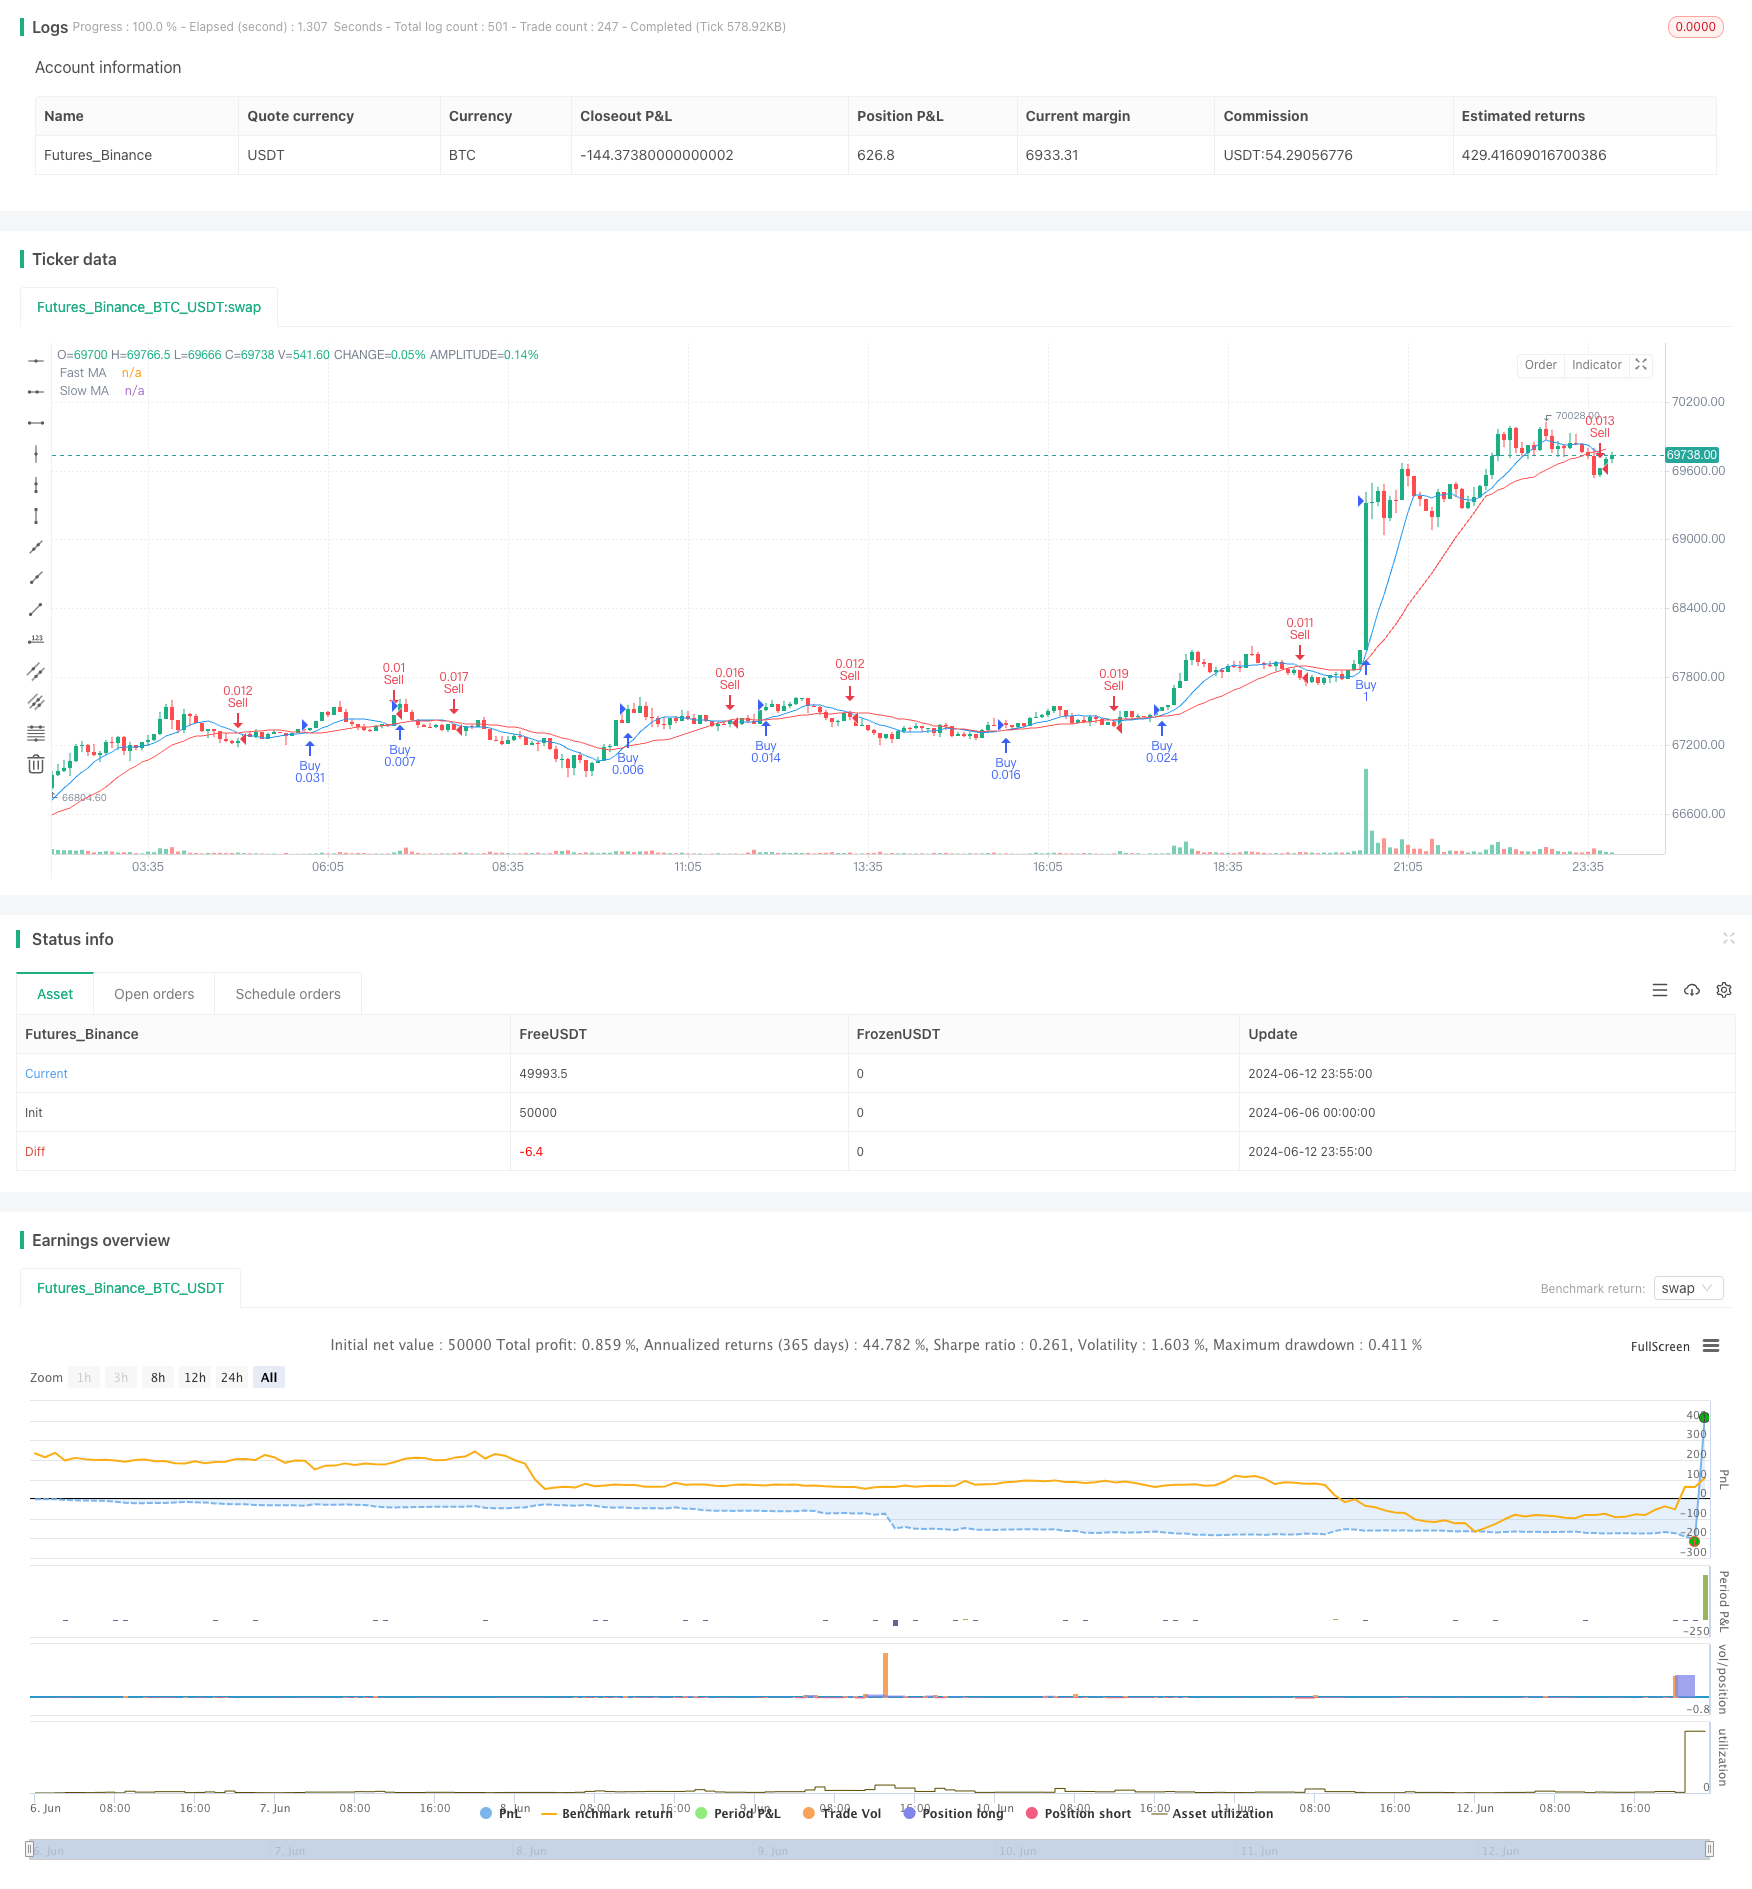
移动平均线交叉策略
Author: ChaoZhang, Date: 2024-06-14 15:48:32Tags: SMAMA

概述
该策略是一个基于移动平均线交叉的量化交易策略。它通过计算两条不同周期的移动平均线(快线和慢线),当快线从下向上穿过慢线时产生买入信号,当快线从上向下穿过慢线时产生卖出信号。同时,该策略还引入了动态仓位管理的概念,根据账户的盈亏情况动态调整每次交易的仓位大小,以控制风险。
策略原理
- 计算两条不同周期的简单移动平均线(SMA),周期分别为9和21。
- 当快线(9周期)从下向上穿过慢线(21周期)时,产生买入信号;当快线从上向下穿过慢线时,产生卖出信号。
- 根据账户余额的1%计算每笔交易的风险金额,然后根据风险金额和当前价格范围(最高价-最低价)计算应买入的股数。
- 如果当前策略处于盈利状态,将下一笔交易的仓位增加10%;如果处于亏损状态,将下一笔交易的仓位减少10%。
- 在买入信号出现时执行买入操作,在卖出信号出现时执行卖出操作。
策略优势
- 简单易懂:该策略基于经典的移动平均线交叉原理,逻辑清晰,易于理解和实现。
- 趋势跟踪:通过两条不同周期的移动平均线,可以有效捕捉价格的中长期趋势,适合趋势跟踪交易。
- 动态仓位管理:根据盈亏情况动态调整仓位大小,在盈利时适当增加仓位,在亏损时适当减少仓位,有助于控制风险和提高收益。
- 适用性广:该策略可以应用于各种金融市场和交易品种,如股票、期货、外汇等。
策略风险
- 频繁交易:由于该策略基于短期的移动平均线交叉信号,可能会导致频繁交易,增加交易成本和滑点风险。
- 震荡市中表现欠佳:在价格震荡、非趋势市场中,该策略可能会产生较多的虚假信号,导致亏损。
- 参数优化风险:策略的表现依赖于移动平均线的周期选择,不同的参数可能导致不同的结果,存在参数优化的过拟合风险。
策略优化方向
- 引入趋势确认指标:在移动平均线交叉信号的基础上,引入其他趋势确认指标,如MACD、ADX等,以过滤掉部分虚假信号,提高信号质量。
- 优化仓位管理规则:现有的仓位管理规则较为简单,可以考虑引入更加复杂的仓位管理算法,如凯利公式、固定比例资金管理等,以进一步提高风险调整后的收益。
- 加入止损止盈机制:在策略中加入止损和止盈规则,控制单笔交易的最大亏损和最大盈利,提高策略的风险收益比。
- 参数自适应优化:引入自适应参数优化机制,根据市场状态的变化自动调整策略参数,提高策略的稳健性和适应性。
总结
移动平均线交叉策略是一个简单实用的量化交易策略,通过两条不同周期移动平均线的交叉信号来捕捉价格趋势,同时引入动态仓位管理规则以控制风险。该策略逻辑清晰,易于实现,适用范围广泛。但在实际应用中,需要注意频繁交易、震荡市表现以及参数优化等潜在风险,并根据需要对策略进行优化和改进,如引入趋势确认指标、优化仓位管理规则、加入止损止盈机制以及参数自适应优化等。通过不断的优化和完善,有望进一步提升策略的稳健性和盈利能力。
/*backtest
start: 2024-06-06 00:00:00
end: 2024-06-13 00:00:00
period: 5m
basePeriod: 1m
exchanges: [{"eid":"Futures_Binance","currency":"BTC_USDT"}]
*/

// This Pine Script™ code is subject to the terms of the Mozilla Public License 2.0 at https://mozilla.org/MPL/2.0/
// © okolienicholas

//@version=5
strategy("Moving Average Crossover Strategy", overlay=true)

// Input parameters
fast_length = input(9, title="Fast MA Length")
slow_length = input(21, title="Slow MA Length")
source = close
account_balance = input(100, title="Account Balance") // Add your account balance here

// Calculate moving averages
fast_ma = ta.sma(source, fast_length)
slow_ma = ta.sma(source, slow_length)

// Plot moving averages
plot(fast_ma, color=color.blue, title="Fast MA")
plot(slow_ma, color=color.red, title="Slow MA")

// Generate buy/sell signals
buy_signal = ta.crossover(fast_ma, slow_ma)
sell_signal = ta.crossunder(fast_ma, slow_ma)

// Plot buy/sell signals
plotshape(buy_signal, style=shape.triangleup, location=location.belowbar, color=color.green, size=size.small, title="Buy Signal")
plotshape(sell_signal, style=shape.triangledown, location=location.abovebar, color=color.red, size=size.small, title="Sell Signal")

// Calculate the risk per trade
risk_per_trade = account_balance * 0.01

// Calculate the number of shares to buy
shares_to_buy = risk_per_trade / (high - low)

// Calculate the profit or loss
profit_or_loss = strategy.netprofit

// Adjust the position size based on the profit or loss
if (profit_or_loss > 0)
    shares_to_buy = shares_to_buy * 1.1 // Increase the position size by 10% when in profit
else
    shares_to_buy = shares_to_buy * 0.9 // Decrease the position size by 10% when in loss

// Execute orders
if (buy_signal)
    strategy.entry("Buy", strategy.long, qty=shares_to_buy)

if (sell_signal)
    strategy.entry("Sell", strategy.short, qty=shares_to_buy)
相关内容
- 均线,简单移动平均线,均线斜率,追踪止损,重新进场
- 双均线交叉动态持仓策略
- 移动平均交叉策略
- SMA双均线交易策略
- 移动平均线交叉策略
- 基于多均线的趋势交易策略
- 趋势捕捉策略
- 双均线交叉自适应参数择时交易策略
- 基于双均线交叉的移动平均线策略
- 双均线动量交易策略:基于时间优化的趋势跟踪系统
- 多重移动平均与随机震荡交叉量化策略
更多内容
- 基于RSI、MACD、布林带和成交量的混合交易策略
- ZLSMA-增强型吊灯出场策略与成交量脉冲检测
- 基于双均线交叉、RSI和随机指标的短线量化交易策略
- RSI低点反转策略
- Fisher变换动态阈值趋势跟踪策略
- 均值回归策略
- EMA100与NUPL相对未实现利润量化交易策略
- 基于随机振荡指标的波动区间交易策略
- 简单组合策略:枢轴点超级趋势和双重指数移动平均线
- EMA趋势过滤策略
- 基于三分钟K线高低点的日内突破策略
- 基于均线、支撑阻力和交易量的高级入场条件策略
- EMA RSI MACD动态止盈止损交易策略
- G趋势EMA ATR智能交易策略
- 基于200日均线和随机振子的趋势追踪策略
- RSI趋势策略
- EMA交叉动量短线交易策略
- BB均线突破策略
- VWAP与RSI动态布林带止盈止损策略
- Chande-Kroll止损动态ATR趋势跟踪策略