概述
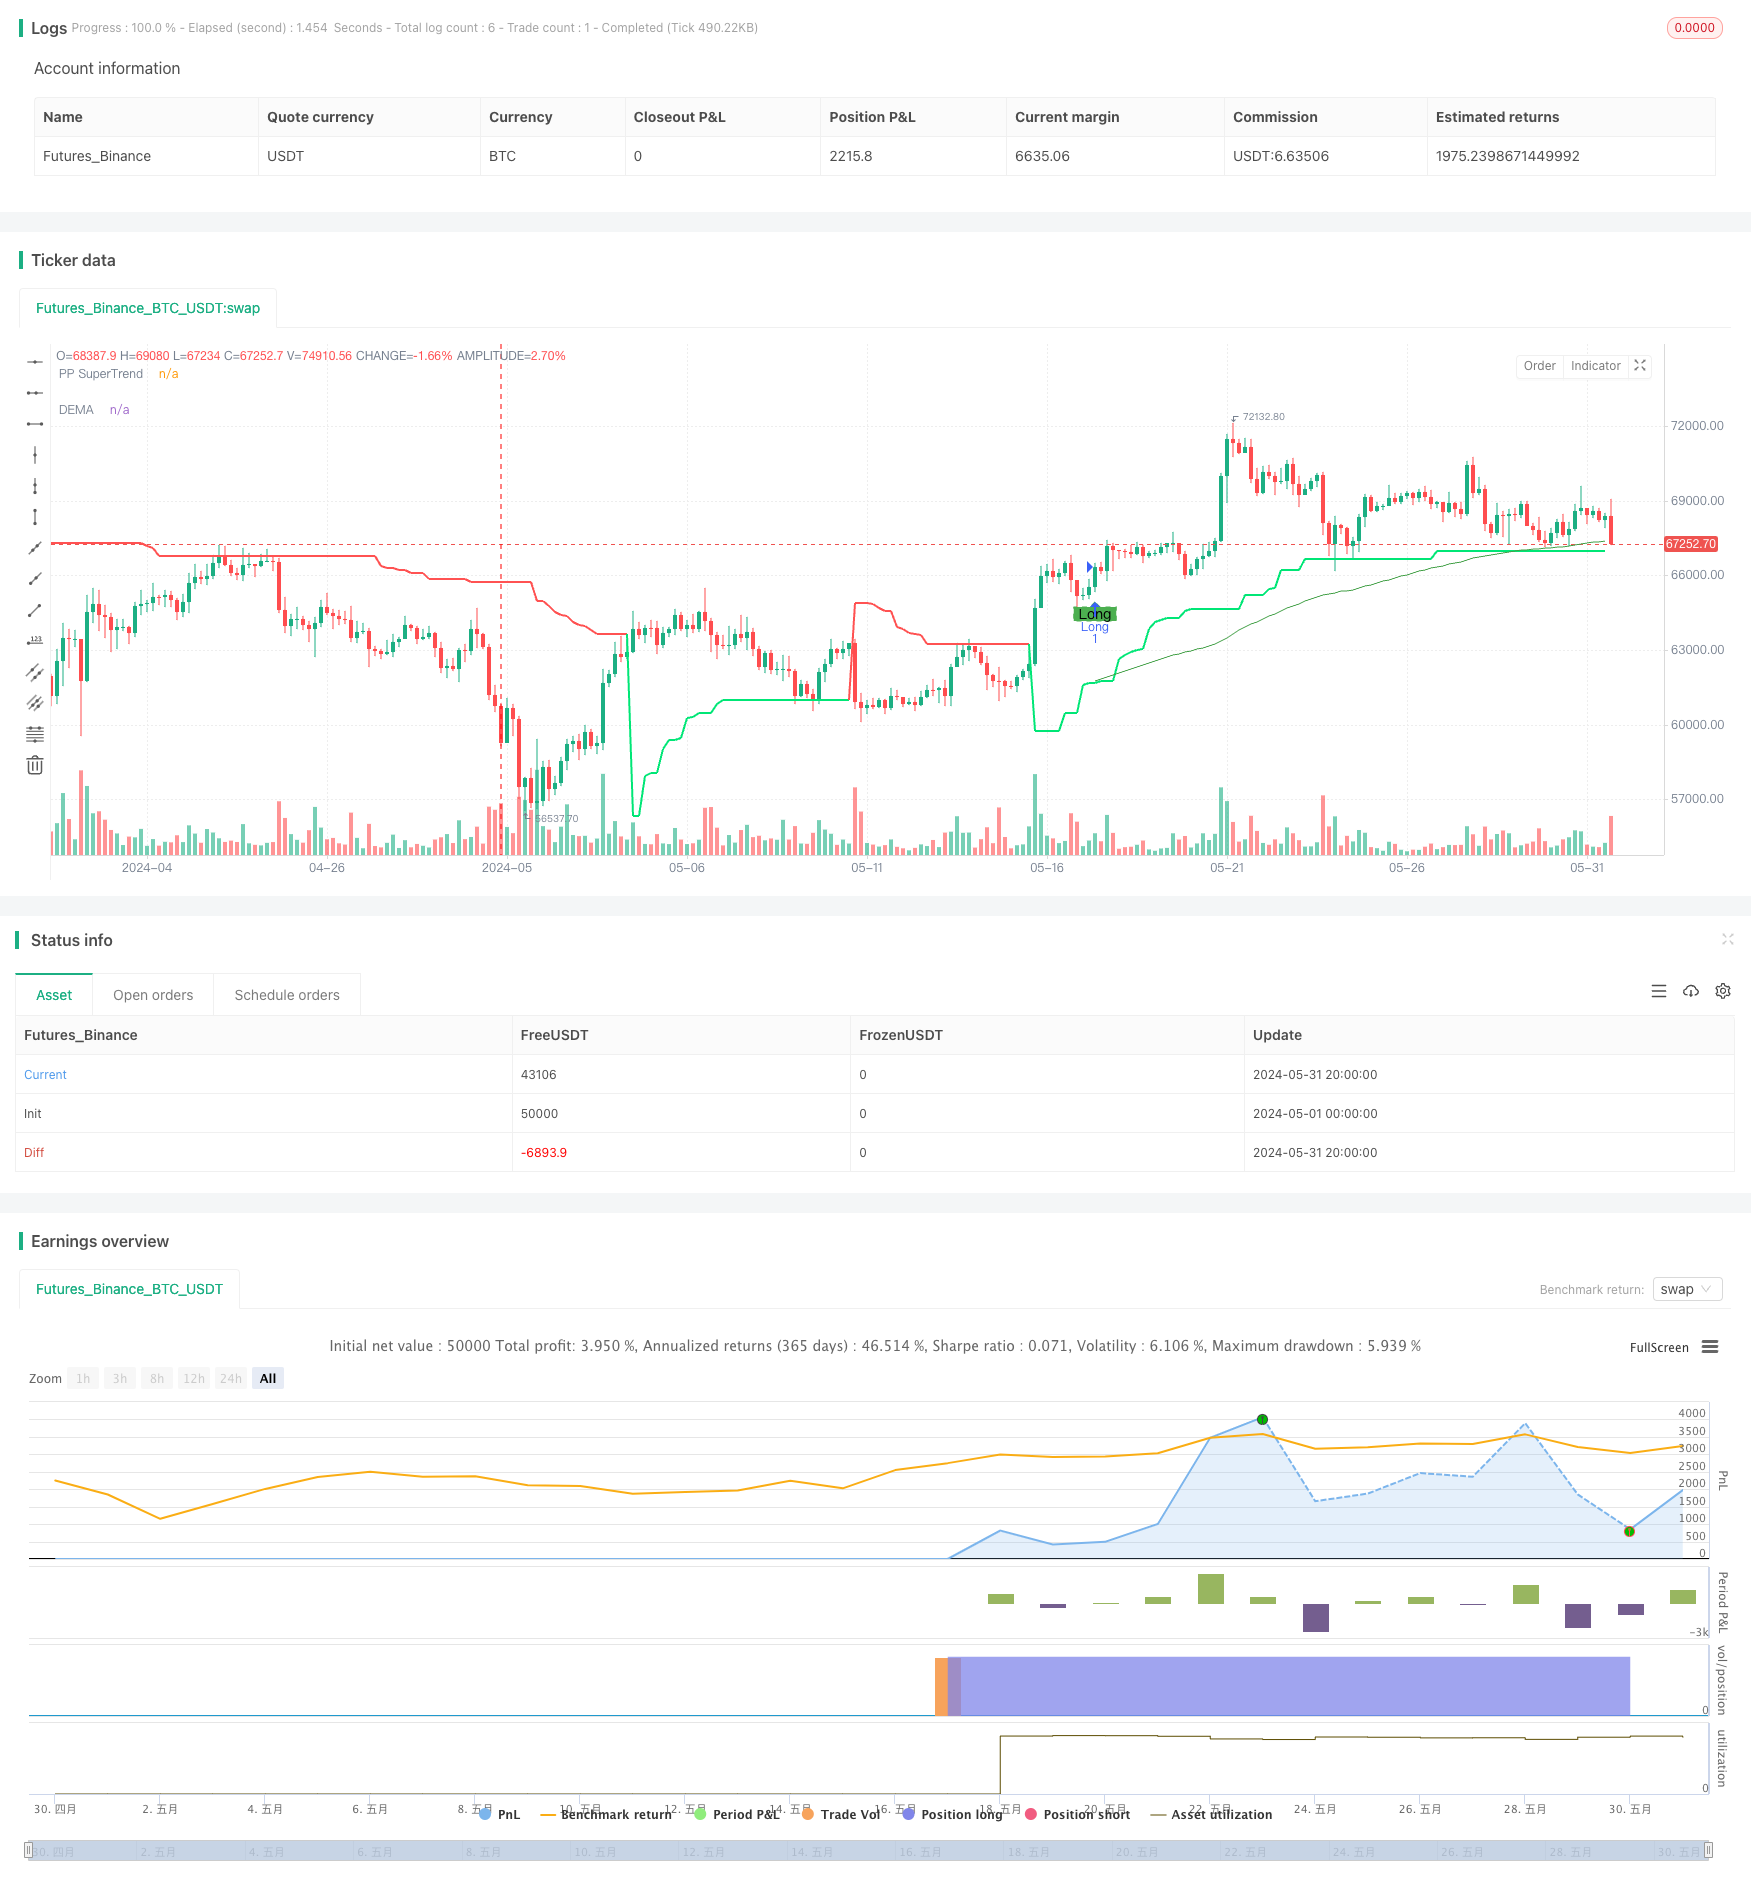
该策略结合了枢轴点超级趋势指标和双重指数移动平均线(DEMA)指标,通过分析价格在这两个指标之间的位置关系,判断交易信号。当价格突破枢轴点超级趋势指标并且高于DEMA指标时,产生做多信号;当价格跌破枢轴点超级趋势指标并且低于DEMA指标时,产生做空信号。该策略可以捕捉到市场的中长期趋势,同时也能够应对短期内的价格波动。
策略原理
- 计算枢轴点超级趋势指标:通过计算一定周期内的最高价和最低价的平均值作为中心点,然后根据平均真实波幅(ATR)计算上下轨,形成动态支撑和阻力位。
- 计算DEMA指标:先计算收盘价的指数移动平均线(EMA),然后再对EMA进行一次指数移动平均,最后用两倍EMA减去DEMA得到最终的DEMA指标。
- 产生交易信号:当收盘价突破枢轴点超级趋势上轨并且高于DEMA指标时,产生做多信号;当收盘价跌破枢轴点超级趋势下轨并且低于DEMA指标时,产生做空信号。
- 设置止损和止盈:根据点值(Pip Value)和预设的止损点数(Stop Loss Pips)以及止盈点数(Take Profit Pips)计算出具体的止损价和止盈价。
策略优势
- 趋势跟踪能力强:枢轴点超级趋势指标可以有效地捕捉市场趋势,而DEMA指标可以消除价格噪音,提供更加平滑的趋势判断依据,两者结合可以准确把握市场主要趋势。
- 适应性强:通过动态调整枢轴点超级趋势指标的上下轨,可以适应不同的市场波动情况,提高策略的适应性。
- 风险控制能力强:设置了明确的止损和止盈位置,可以有效控制单笔交易的风险敞口,同时也能够及时锁定已有盈利。
策略风险
- 参数设置风险:策略的表现依赖于多个参数的设置,如枢轴点周期、ATR因子、DEMA长度等,不同参数组合可能导致策略表现差异较大,需要谨慎选择和优化。
- 震荡市风险:在震荡市场环境下,频繁的交易信号可能导致过度交易,从而增加交易成本和滑点风险。
- 趋势转折风险:当市场趋势发生转折时,策略可能会出现连续亏损的情况,需要结合其他分析手段及时调整策略。
策略优化方向
- 参数优化:通过对不同时间周期和交易品种进行参数优化测试,找到最佳的参数组合,提高策略的稳定性和盈利能力。
- 信号过滤:在交易信号产生时,可以结合其他技术指标或者价格行为特征进行二次确认,提高信号的可靠性,减少虚假信号带来的损失。
- 仓位管理:根据市场波动情况和账户风险承受能力,动态调整每笔交易的仓位大小,控制整体风险敞口。
- 组合优化:将该策略与其他策略或者交易系统进行组合,通过分散风险和增强稳定性,提高策略的长期表现。
总结
该策略通过枢轴点超级趋势指标和DEMA指标的结合,可以较好地捕捉市场趋势,同时也能够应对短期波动。策略具有趋势跟踪能力强、适应性强、风险控制能力强等优势,但同时也面临参数设置、震荡市和趋势转折等风险。通过参数优化、信号过滤、仓位管理和组合优化等手段,可以进一步提升策略的稳定性和盈利能力,更好地适应不同的市场环境。
策略源码
/*backtest
start: 2024-05-01 00:00:00
end: 2024-05-31 23:59:59
period: 4h
basePeriod: 15m
exchanges: [{"eid":"Futures_Binance","currency":"BTC_USDT"}]
*/

//@version=5
strategy("Simple Combined Strategy: Pivot Point SuperTrend and DEMA", overlay=true)

// Pivot Point SuperTrend settings
prd = input.int(2, title="Pivot Point Period", minval=1, maxval=50)
Factor = input.float(3.0, title="ATR Factor", minval=1, step=0.1)
Pd = input.int(10, title="ATR Period", minval=1)

// Double EMA settings
demaLength = input.int(200, title="DEMA Length", minval=1)
src = input(close, title="Source")

// Pip settings
pipValue = input.float(0.0001, title="Pip Value")
stopLossPips = input.int(15, title="Stop Loss (pips)")
takeProfitPips = input.int(35, title="Take Profit (pips)")

// Pivot Point SuperTrend Calculation
float ph = ta.pivothigh(prd, prd)
float pl = ta.pivotlow(prd, prd)
var float center = na
if not na(ph)
    center := na(center) ? ph : (center * 2 + ph) / 3
if not na(pl)
    center := na(center) ? pl : (center * 2 + pl) / 3

Up = center - (Factor * ta.atr(Pd))
Dn = center + (Factor * ta.atr(Pd))
var float TUp = na
var float TDown = na
var int Trend = na

if na(Trend)
    TUp := Up
    TDown := Dn
    Trend := close > Dn ? 1 : -1
else
    TUp := close[1] > TUp[1] ? math.max(Up, TUp[1]) : Up
    TDown := close[1] < TDown[1] ? math.min(Dn, TDown[1]) : Dn
    Trend := close > TDown[1] ? 1 : close < TUp[1] ? -1 : nz(Trend[1], 1)

Trailingsl = Trend == 1 ? TUp : TDown
linecolor = Trend == 1 ? color.lime : color.red
plot(Trailingsl, color=linecolor, linewidth=2, title="PP SuperTrend")

// Double EMA Calculation
e1 = ta.ema(src, demaLength)
e2 = ta.ema(e1, demaLength)
dema = 2 * e1 - e2
plot(dema, "DEMA", color=color.new(#43A047, 0))

// Strategy Logic
longCondition = close > Trailingsl and close > dema and strategy.position_size <= 0
shortCondition = close < Trailingsl and close < dema and strategy.position_size >= 0

// Plot signals
plotshape(series=longCondition, title="Long", location=location.belowbar, color=color.green, style=shape.labelup, text="Long")
plotshape(series=shortCondition, title="Short", location=location.abovebar, color=color.red, style=shape.labeldown, text="Short")

// Strategy Entry and Exit
if (longCondition)
    strategy.entry("Long", strategy.long, stop=close - (stopLossPips * pipValue), limit=close + (takeProfitPips * pipValue))
if (shortCondition)
    strategy.entry("Short", strategy.short, stop=close + (stopLossPips * pipValue), limit=close - (takeProfitPips * pipValue))

alertcondition(longCondition, title="Long Alert", message="Long Signal")
alertcondition(shortCondition, title="Short Alert", message="Short Signal")
相关推荐