资源加载中... loading...

VWAP and RSI Dynamic Bollinger Bands Take Profit and Stop Loss Strategy

Author: ChaoZhang, Date: 2024-06-14 15:18:39
Tags: VWAPRSIBBATR

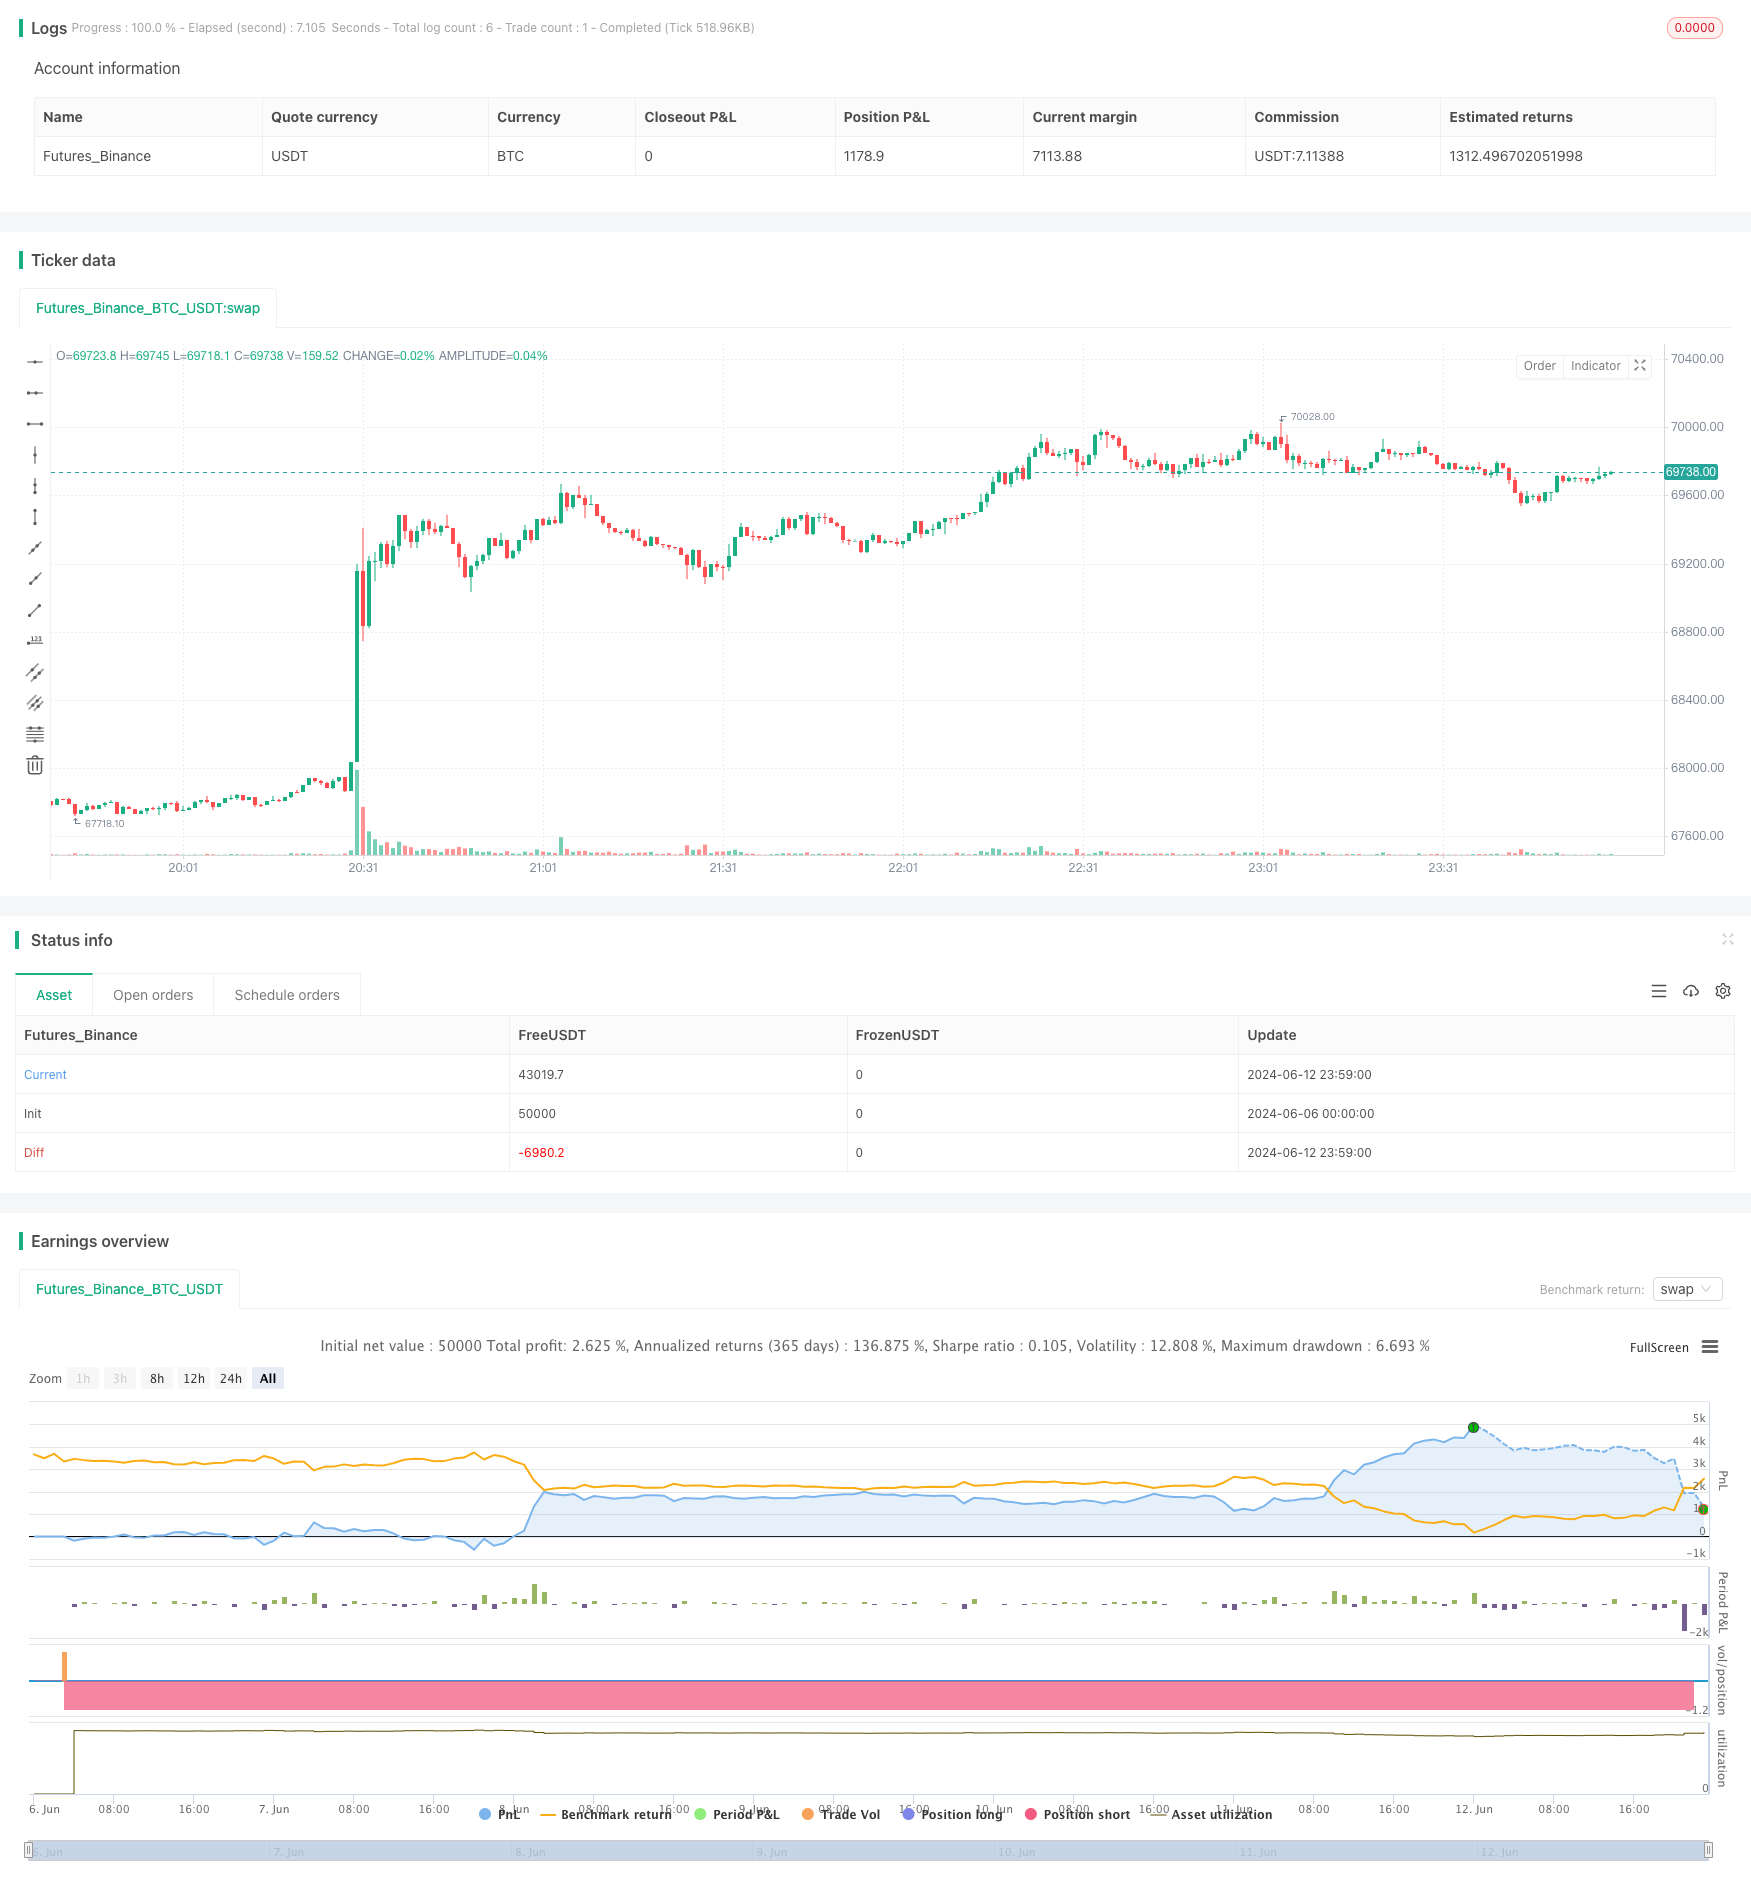
img

Overview

This strategy combines three technical indicators: VWAP (Volume Weighted Average Price), RSI (Relative Strength Index), and Bollinger Bands, to implement a simple and easy-to-use quantitative trading strategy with dynamic take profit and stop loss. The main idea of the strategy is to use the VWAP indicator to determine the price trend over a past period, while using the RSI and Bollinger Bands indicators to determine whether the price is in the overbought or oversold range, thus determining the trading signal. Once a trading signal is determined, the strategy calculates dynamic take profit and stop loss levels based on the ATR (Average True Range) indicator to control risk and lock in profits.

Strategy Principle

  1. Calculate the values of the VWAP, RSI, and Bollinger Bands technical indicators.
  2. Determine whether the price trend is upward, downward, or sideways by judging the relationship between the closing price and VWAP over the past 15 candles.
  3. If the price is below the lower Bollinger Band, RSI is less than 45, and the VWAP signal shows a downward trend, a long signal is generated; if the price is above the upper Bollinger Band, RSI is greater than 55, and the VWAP signal shows an upward trend, a short signal is generated.
  4. Once a trading signal is determined, the strategy calculates the take profit and stop loss levels based on the ATR indicator, with a take profit to stop loss ratio of 1.5:1.
  5. If a long position is held, when the RSI is greater than or equal to 90, the strategy closes the long position; if a short position is held, when the RSI is less than or equal to 10, the strategy closes the short position.

Strategy Advantages

  1. By combining multiple technical indicators, the reliability of trading signals is improved.
  2. The use of dynamic take profit and stop loss can effectively control risk and lock in profits.
  3. The code structure is clear and easy to understand and optimize.
  4. Applicable to various market environments, including trending and sideways markets.

Strategy Risks

  1. In times of high market volatility, frequent trading may lead to high transaction costs.
  2. If the market experiences unexpected events or irrational behavior, the strategy may generate incorrect trading signals.
  3. The parameter settings of the strategy may need to be adjusted according to different market environments to ensure the effectiveness of the strategy.

Strategy Optimization Directions

  1. Try adjusting the parameter settings of VWAP, RSI, and Bollinger Bands to adapt to different market environments and trading instruments.
  2. Introduce other technical indicators, such as MACD, KDJ, etc., to further improve the reliability of trading signals.
  3. Optimize the calculation method of take profit and stop loss, such as using trailing stop loss or profit protection stop loss, to better control risk and lock in profits.
  4. Combine fundamental analysis, such as economic data and policy changes, to improve the overall performance of the strategy.

Summary

This strategy combines three technical indicators: VWAP, RSI, and Bollinger Bands, to implement a simple and easy-to-use quantitative trading strategy. The strategy uses dynamic take profit and stop loss to effectively control risk and lock in profits. Although the strategy has some potential risks, with reasonable parameter settings and continuous optimization, it is believed that the strategy can achieve good results in actual trading.


/*backtest
start: 2024-06-06 00:00:00
end: 2024-06-13 00:00:00
period: 1m
basePeriod: 1m
exchanges: [{"eid":"Futures_Binance","currency":"BTC_USDT"}]
*/

//@version=5
strategy("VWAP and RSI Strategy", overlay=true)

// VWAP calculation
vwap = ta.vwap(close)

// RSI calculation
rsi_length = 16
rsi = ta.rsi(close, rsi_length)

// Bollinger Bands calculation
bb_length = 14
bb_std = 2.0
[bb_middle, bb_upper, bb_lower] = ta.bb(close, bb_length, bb_std)

// Variables for VWAP signal calculation
backcandles = 15
float vwapsignal = na

// Function to check if last 15 candles are above or below VWAP
calc_vwapsignal(backcandles) =>
    upt = true
    dnt = true
    for i = 0 to backcandles - 1
        if close[i] < vwap[i]
            upt := false
        if close[i] > vwap[i]
            dnt := false
    if upt and dnt
        3
    else if upt
        2
    else if dnt
        1
    else
        0

// Calculate VWAP signal for each bar
vwapsignal := calc_vwapsignal(backcandles)

// Calculate total signal
totalsignal = 0
if vwapsignal == 2 and close <= bb_lower and rsi < 45
    totalsignal := 2
else if vwapsignal == 1 and close >= bb_upper and rsi > 55
    totalsignal := 1


// Define strategy entry and exit conditions
slatr = 1.2 * ta.atr(7)
TPSLRatio = 1.5

if (totalsignal == 2 and strategy.opentrades == 0)
    strategy.entry("Long", strategy.long, stop=close - slatr, limit=close + slatr * TPSLRatio)

if (totalsignal == 1 and strategy.opentrades == 0)
    strategy.entry("Short", strategy.short, stop=close + slatr, limit=close - slatr * TPSLRatio)

// Additional exit conditions based on RSI
if (strategy.opentrades > 0)
    if (strategy.position_size > 0 and rsi >= 90)
        strategy.close("Long")
    if (strategy.position_size < 0 and rsi <= 10)
        strategy.close("Short")

template: strategy.tpl:40:21: executing "strategy.tpl" at <.api.GetStrategyListByName>: wrong number of args for GetStrategyListByName: want 7 got 6