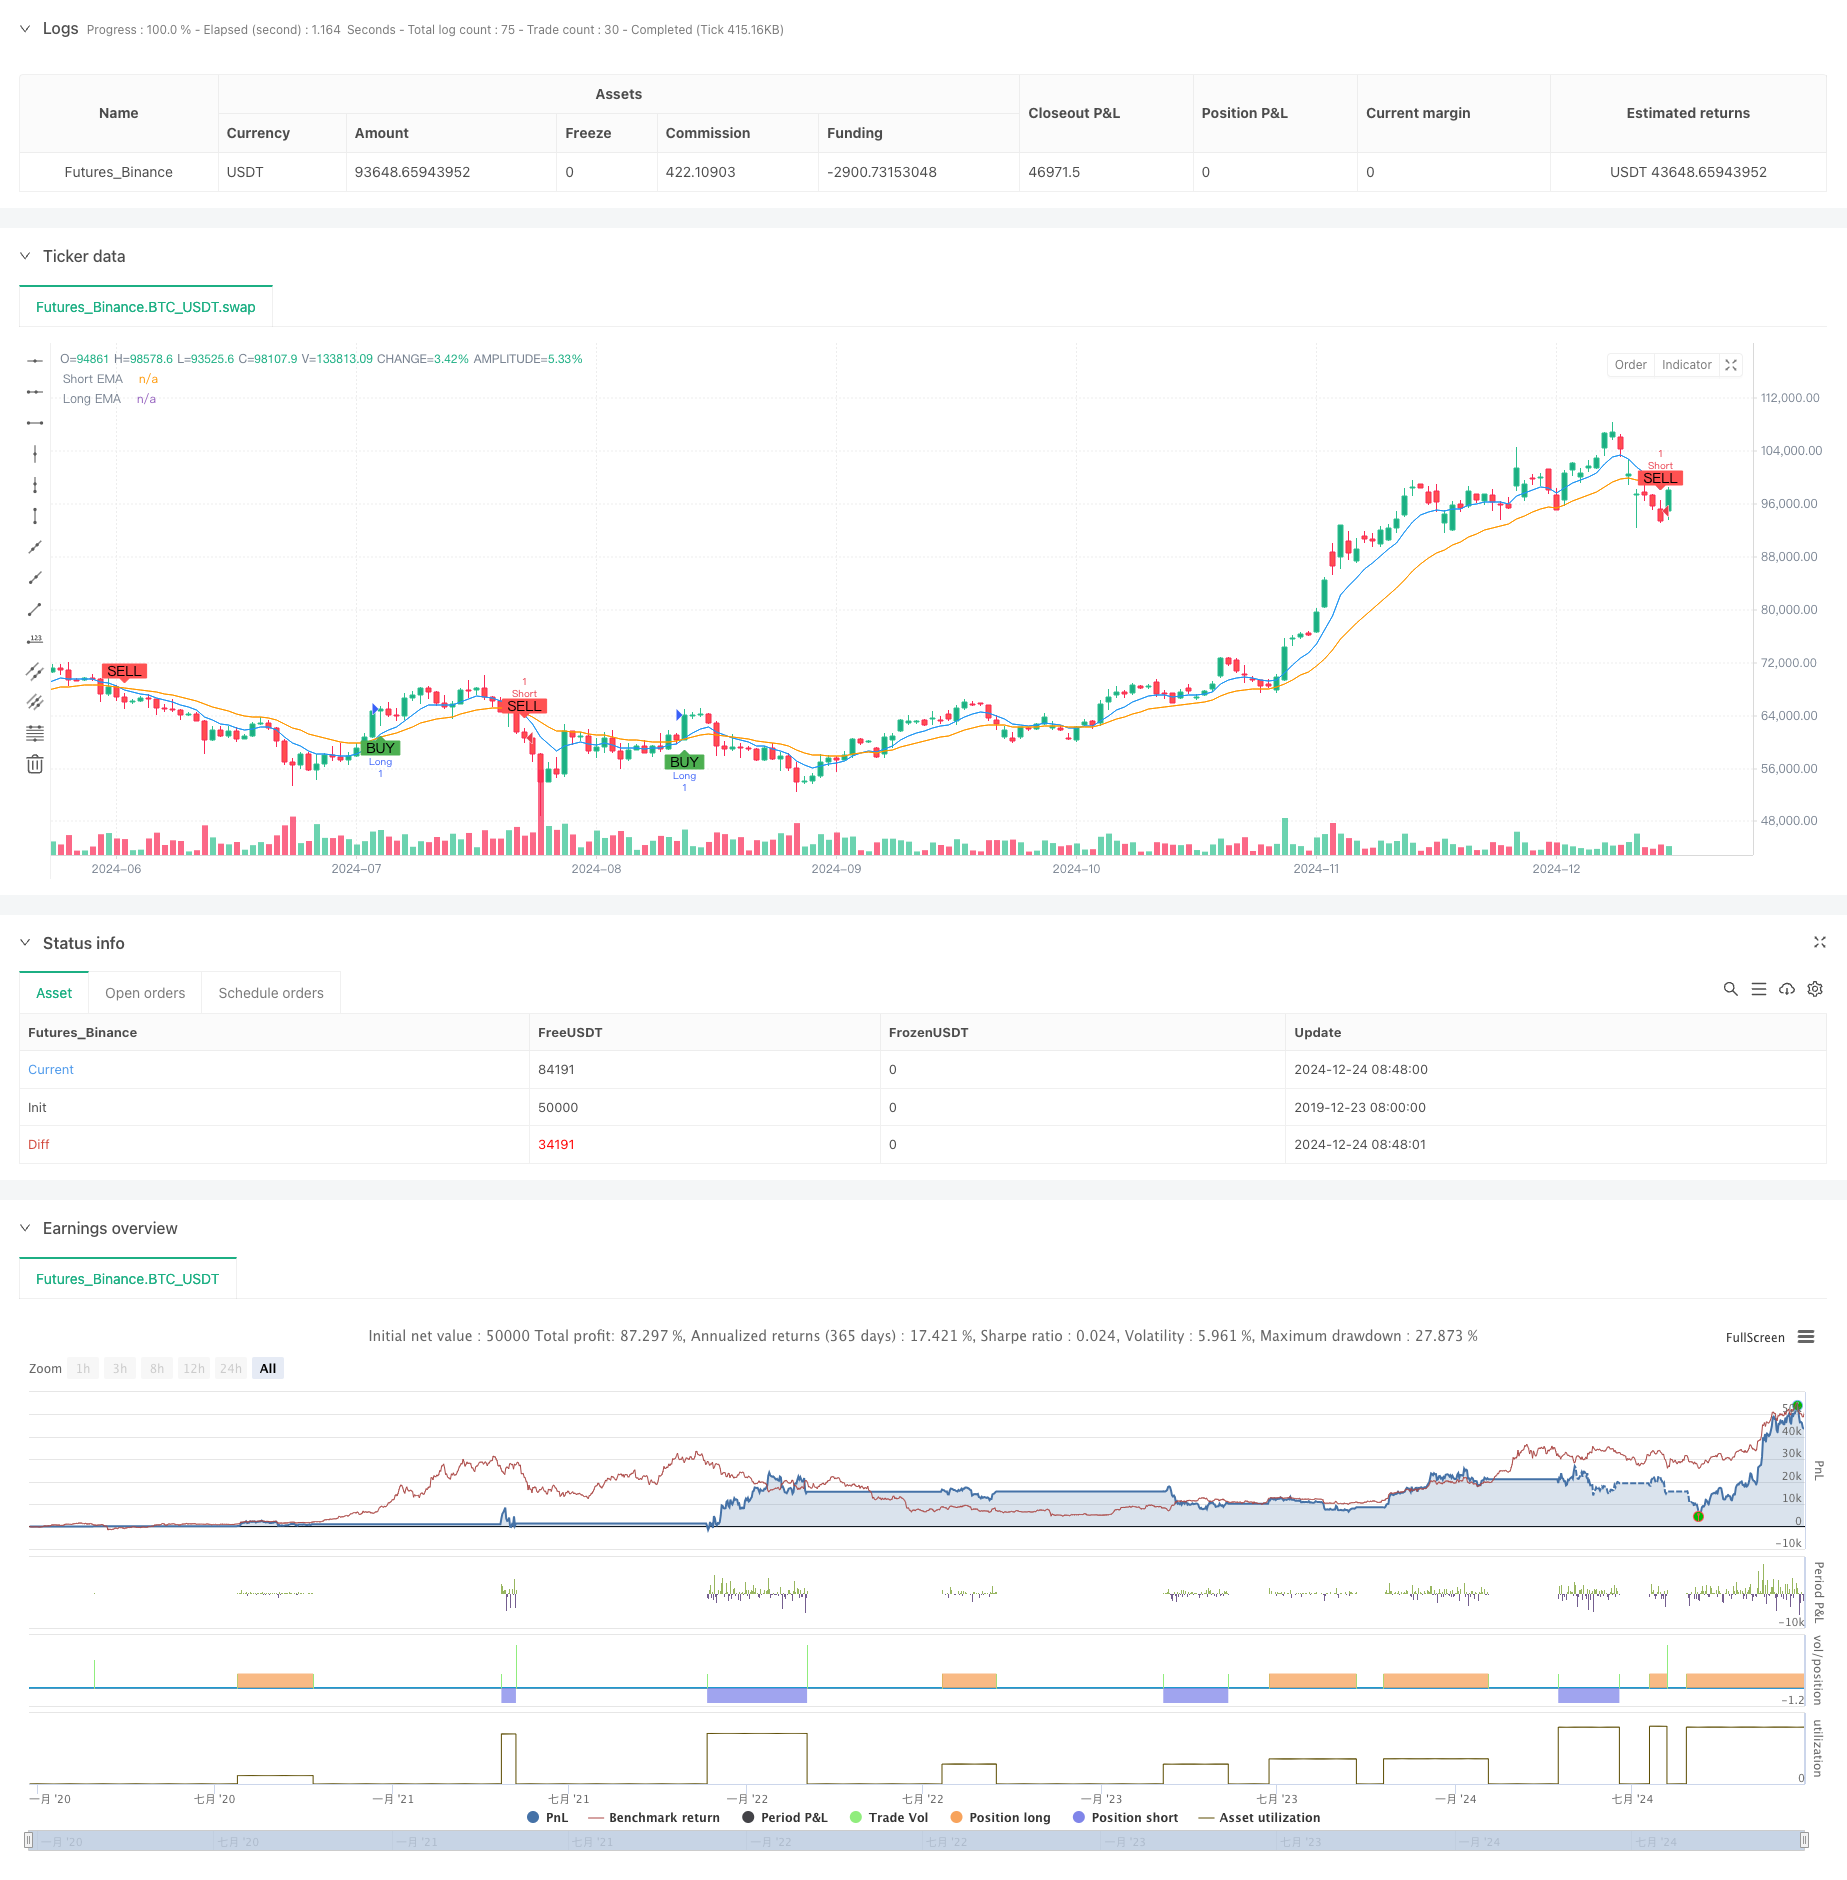
মাল্টি-ইন্ডিকেটর হাই ফ্রিকোয়েন্সি রেঞ্জ ট্রেডিং কৌশল
লেখক:চাওঝাং, তারিখঃ ২০২৪-১২-২৭ 14:18:57ট্যাগঃআরএসআইইএমএভিওএলN-BARটিপিSL

সারসংক্ষেপ
এটি একাধিক প্রযুক্তিগত সূচকগুলির উপর ভিত্তি করে একটি উচ্চ-ফ্রিকোয়েন্সি রেঞ্জ ট্রেডিং কৌশল। কৌশলটি এক্সপোনেনশিয়াল মুভিং এভারেজ (ইএমএ), আপেক্ষিক শক্তি সূচক (আরএসআই), ভলিউম বিশ্লেষণ এবং এন-অবধি মূল্য প্যাটার্ন স্বীকৃতি থেকে সংকেতগুলি সংযুক্ত করে স্বল্পমেয়াদী ট্রেডিংয়ে সর্বোত্তম প্রবেশের পয়েন্টগুলি সনাক্ত করতে। এটি পূর্বনির্ধারিত লাভ এবং স্টপ-লস স্তরের মাধ্যমে কঠোর ঝুঁকি ব্যবস্থাপনা বাস্তবায়ন করে।
কৌশল নীতি
কোর লজিক মাল্টি-ডাইমেনশনাল সিগন্যাল কনফার্মেশনের উপর নির্ভর করে:
- স্বল্পমেয়াদী প্রবণতার দিকনির্দেশনা নির্ধারণের জন্য ৮ পেরিওড এবং ২১ পেরিওড EMA ক্রসওভার ব্যবহার করে
- ১৪ পেরিওডের RSI ব্যবহার করে বাজার গতির বৈধতা দেয়, RSI>৫০ বাউলি মম্পটম নিশ্চিত করে এবং RSI<৫০ হ্রাসী মম্পটম নিশ্চিত করে।
- বাজারের কার্যকলাপ নিশ্চিত করার জন্য বর্তমান ভলিউমকে ২০ পেরিওডের গড় ভলিউমের সাথে তুলনা করে
- পূর্ববর্তী 10 মোমবাতি সঙ্গে শেষ 5 মোমবাতি তুলনা করে সম্ভাব্য বিপরীত প্যাটার্ন সনাক্ত ট্রেডিং সিগন্যালগুলি কেবলমাত্র যখন সমস্ত শর্তগুলি সারিবদ্ধ হয় তখনই উত্পন্ন হয়। উত্থান সংকেতগুলির জন্য লং পজিশনগুলি বাজার মূল্যে খোলা হয় এবং হ্রাস সংকেতগুলির জন্য শর্ট পজিশনগুলি খোলা হয়। ঝুঁকি 1.5% লাভ এবং 0.7% স্টপ-লস স্তরের মাধ্যমে নিয়ন্ত্রিত হয়।
কৌশলগত সুবিধা
- মাল্টি-ডাইমেনশনাল সিগন্যাল ক্রস-ভ্যালিডেশন মিথ্যা সংকেতগুলিকে উল্লেখযোগ্যভাবে হ্রাস করে
- উন্নত অভিযোজনযোগ্যতার জন্য প্রবণতা অনুসরণ এবং গতি বাণিজ্যের সুবিধাগুলি একত্রিত করে
- ভলিউম নিশ্চিতকরণ অনির্বাহী সময়কালে লেনদেন রোধ করে
- এন-পিরিয়ড প্যাটার্ন স্বীকৃতি বাজারের বিপরীতমুখীতা সময়মত সনাক্ত করতে সক্ষম করে
- কার্যকর ঝুঁকি নিয়ন্ত্রণের জন্য যুক্তিসঙ্গত লাভ/হানি অনুপাত
- স্পষ্ট যুক্তি ক্রমাগত অপ্টিমাইজেশান এবং পরামিতি সমন্বয় সহজতর
কৌশলগত ঝুঁকি
- খুব অস্থির বাজারে ঘন ঘন স্টপ লস হতে পারে
- মার্কেট মেকারের জন্য সংবেদনশীল কোট বিলম্ব
- সমস্ত সূচক একত্রিত হলে তুলনামূলকভাবে কম সুযোগ
- বিভিন্ন বাজারে সম্ভাব্য ধারাবাহিক ক্ষতি প্রশমনমূলক ব্যবস্থাঃ
- বাজারের অস্থিরতার উপর ভিত্তি করে মুনাফা/হানি অনুপাতকে গতিশীলভাবে সামঞ্জস্য করুন
- উচ্চ তরলতার সময় ট্রেডিং
- সিগন্যালের পরিমাণ এবং গুণমানের ভারসাম্য বজায় রাখার জন্য পরামিতিগুলি অপ্টিমাইজ করুন
- লাভজনকতা বৃদ্ধির জন্য ট্রেলিং স্টপ বাস্তবায়ন করুন
অপ্টিমাইজেশান নির্দেশাবলী
- বাজারের অবস্থার উপর ভিত্তি করে স্বয়ংক্রিয় অপ্টিমাইজেশনের জন্য অভিযোজিত পরামিতি সমন্বয় প্রক্রিয়া প্রবর্তন
- অত্যধিক অস্থিরতার সময় ট্রেডিং বন্ধ করার জন্য অস্থিরতা ফিল্টার যুক্ত করুন
- আরও পরিশীলিত এন-পরিয়ড প্যাটার্ন স্বীকৃতি অ্যালগরিদম বিকাশ
- অ্যাকাউন্টের মূলধন ভিত্তিক পজিশন সাইজিং বাস্তবায়ন
- সিগন্যাল নির্ভরযোগ্যতা বাড়ানোর জন্য একাধিক সময়সীমা নিশ্চিতকরণ যোগ করুন
সংক্ষিপ্তসার
কৌশলটি বহু-মাত্রিক প্রযুক্তিগত সূচক সহযোগিতার মাধ্যমে উচ্চ-ফ্রিকোয়েন্সি ট্রেডিংয়ে মানসম্পন্ন ব্যবসায়ের সুযোগগুলি সনাক্ত করে। এটি কঠোর ঝুঁকি নিয়ন্ত্রণের মাধ্যমে স্থিতিশীলতা নিশ্চিত করার সময় প্রবণতা, গতি এবং ভলিউম বৈশিষ্ট্যগুলি বিবেচনা করে। অপ্টিমাইজেশনের জন্য জায়গা থাকলেও এটি একটি যৌক্তিকভাবে সুস্থ এবং ব্যবহারিক ট্রেডিং পদ্ধতির প্রতিনিধিত্ব করে।
/*backtest
start: 2019-12-23 08:00:00
end: 2024-12-25 08:00:00
period: 1d
basePeriod: 1d
exchanges: [{"eid":"Futures_Binance","currency":"BTC_USDT"}]
*/

//@version=5
strategy("XRP/USD Scalping Strategy with Alerts", overlay=true)

// Input parameters
ema_short = input.int(8, title="Short EMA Period")
ema_long = input.int(21, title="Long EMA Period")
rsiperiod = input.int(14, title="RSI Period")
vol_lookback = input.int(20, title="Volume Lookback Period")
n_bars = input.int(5, title="N-Bars Detection")

take_profit_perc = input.float(1.5, title="Take Profit (%)") / 100
stop_loss_perc = input.float(0.7, title="Stop Loss (%)") / 100

// Indicators
ema_short_line = ta.ema(close, ema_short)
ema_long_line = ta.ema(close, ema_long)
rsi = ta.rsi(close, rsiperiod)
avg_volume = ta.sma(volume, vol_lookback)

// N-bar detection function
bullish_nbars = ta.lowest(low, n_bars) > ta.lowest(low, n_bars * 2)
bearish_nbars = ta.highest(high, n_bars) < ta.highest(high, n_bars * 2)

// Entry conditions
long_condition = ta.crossover(ema_short_line, ema_long_line) and rsi > 50 and volume > avg_volume and bullish_nbars
short_condition = ta.crossunder(ema_short_line, ema_long_line) and rsi < 50 and volume > avg_volume and bearish_nbars

// Plot signals
plotshape(long_condition, title="Buy Signal", location=location.belowbar, color=color.green, style=shape.labelup, text="BUY")
plotshape(short_condition, title="Sell Signal", location=location.abovebar, color=color.red, style=shape.labeldown, text="SELL")

// Strategy execution
if (long_condition)
    strategy.entry("Long", strategy.long)
    strategy.exit("TP/SL", from_entry="Long", limit=close * (1 + take_profit_perc), stop=close * (1 - stop_loss_perc))

if (short_condition)
    strategy.entry("Short", strategy.short)
    strategy.exit("TP/SL", from_entry="Short", limit=close * (1 - take_profit_perc), stop=close * (1 + stop_loss_perc))

// Plot EMA lines
plot(ema_short_line, color=color.blue, title="Short EMA")
plot(ema_long_line, color=color.orange, title="Long EMA")

// Create alerts
alertcondition(long_condition, title="Buy Alert", message="Buy Signal: EMA Crossover, RSI > 50, Volume > Avg, Bullish N-Bars")
alertcondition(short_condition, title="Sell Alert", message="Sell Signal: EMA Crossunder, RSI < 50, Volume > Avg, Bearish N-Bars")
- পজিশন স্কেলিং সহ মাল্টি-আরএসআই-ইএমএ ইমপুটাম হেজিং কৌশল
- মাল্টি-টাইমফ্রেম আরএসআই ওভারসোল্ড রিভার্সাল কৌশল
- আরএসআই ইম্পোমেন্টাম উন্নত ট্রেডিং কৌশল সহ ডাবল ইএমএ ক্রসওভার
- ডায়নামিক ড্রাউনডাউন কন্ট্রোল সিস্টেমের সাথে অভিযোজিত প্রবণতা অনুসরণ কৌশল
- মাল্টি-ইন্ডিকেটর ডায়নামিক ট্রেডিং স্ট্র্যাটেজি
- মাল্টি-ট্রেন্ড অনুসরণ এবং কাঠামো ব্রেকআউট কৌশল
- মল্টি-ইএমএ ক্রসওভার ট্রেডিং কৌশল
- উন্নত মাল্টি-ইন্ডিক্টর ট্রেন্ড রিভার্সাল ইন্টেলিজেন্স স্ট্র্যাটেজি
- আরও এন্ট্রি এবং এআই সহ KRK ADA 1H স্টোকাস্টিক ধীর কৌশল
- অপ্টিমাইজড ট্যাক লাভ এবং স্টপ লস সিস্টেমের সাথে মাল্টি-ইন্ডিকেটর ক্রসওভার মোমেন্টাম ট্রেডিং কৌশল
- মাল্টি-ইএমএ ডায়নামিক ট্রেন্ড ক্যাপচার কোয়ান্টামেটিভ ট্রেডিং স্ট্র্যাটেজি
- ফিক্সড স্টপ-লস অপ্টিমাইজেশান মডেল সহ ডায়নামিক মুভিং এভারেজ এবং বোলিংজার ব্যান্ড ক্রস কৌশল
- ATR স্টপ লস এবং ট্রেডিং জোন কন্ট্রোল সহ RSI ট্রেন্ড বিপরীত ট্রেডিং কৌশল
- ওসিলেটর এবং ডায়নামিক সাপোর্ট/রেসিস্ট্যান্স ট্রেডিং কৌশল সহ মাল্টি-ইএমএ ক্রস
- ট্রেডিং কৌশল অনুসরণ করে মাল্টি-এসএমএ এবং স্টোকাস্টিক সমন্বিত প্রবণতা
- স্ট্যান্ডার্ড লোগারিথমিক রিটার্নের উপর ভিত্তি করে অভিযোজিত গতিশীল ট্রেডিং কৌশল
- মাল্টি-ইন্ডিকেটর ক্রস-ট্রেন্ড অনুসরণকারী ট্রেডিং কৌশলঃ স্টোকাস্টিক আরএসআই এবং চলমান গড় সিস্টেমের উপর ভিত্তি করে পরিমাণগত বিশ্লেষণ
- মাল্টি-ইন্ডিকেটর ট্রেন্ড ক্রসিং স্ট্র্যাটেজিঃ বুল মার্কেট সাপোর্ট ব্যান্ড ট্রেডিং সিস্টেম
- ৫২-সপ্তাহের উচ্চ/নিম্ন এক্সটেনশন বিশ্লেষণ সিস্টেমের সাথে মাল্টি-লেভেল ডায়নামিক এমএসিডি ট্রেন্ড অনুসরণকারী কৌশল
- ডুয়াল ইএমএ আরএসআই মোমেন্টাম ট্রেন্ড রিভার্সাল ট্রেডিং সিস্টেম - ইএমএ এবং আরএসআই ক্রসওভারের উপর ভিত্তি করে একটি মোমেন্টাম ব্রেকথ্রু কৌশল
- ডায়নামিক ট্রেন্ডলাইন ব্রেকআউট রিভার্সাল ট্রেডিং কৌশল
- EMA এবং SMA এর উপর ভিত্তি করে কৌশল অনুসরণ করে মাল্টি-ইন্ডিক্টর ডায়নামিক ট্রেন্ড
- উন্নত ফিবোনাচি ট্রেন্ড অনুসরণ এবং ঝুঁকি ব্যবস্থাপনা কৌশল
- চপনিস ইনডেক্স ফিল্টার সিস্টেমের সাথে অভিযোজিত মাল্টি-স্টেট ইএমএ-আরএসআই ইমপুটম কৌশল
- ইন্টেলিজেন্ট এক্সপোনেনশিয়াল মুভিং গড় ট্রেডিং কৌশল অপ্টিমাইজেশন সিস্টেম
- এআই-চালিত ভোল্টেবিলিটি প্রাইস সিস্টেম ডিভার্জেন্স ট্রেডিং কৌশল
- এটিআর-ভিত্তিক ঝুঁকি ব্যবস্থাপনা সহ মাল্টি-ইএমএ ট্রেন্ড-ফলোিং সুইং ট্রেডিং কৌশল
- বোলিংজার ব্যান্ড এবং আরএসআই ইন্টিগ্রেশন সহ উন্নত গড় বিপরীতমুখী কৌশল
- সমর্থন/প্রতিরোধের সাথে মাল্টি-পিরিয়ড আরএসআই ডিভার্জেন্স
- ডায়নামিক ড্রাউনডাউন কন্ট্রোল সিস্টেমের সাথে অভিযোজিত প্রবণতা অনুসরণ কৌশল