Überblick
Die Strategie verwendet die Kreuzung des 5-Tage-Indikator-Moving-Averages (EMA5) und des 13-Tage-Indikator-Moving-Averages (EMA13) um ein Handelssignal zu erzeugen. Wenn der EMA5 den EMA13 überschreitet, erzeugt er ein Mehrwertsignal; wenn der EMA5 den EMA13 überschreitet, erzeugt er ein Negativsignal. Die Strategie zielt darauf ab, Änderungen in den kurzfristigen Trends zu erfassen und die Kreuzung der beiden Moving-Averagen zu nutzen, um Ein- und Ausgänge zu bestimmen.
Strategieprinzip
Der Kern dieser Strategie ist die Verwendung von Kreuzungen von Index-Moving Averages (EMA) aus zwei verschiedenen Zeitspannen, um ein Handelssignal zu erzeugen. Die EMA ist ein häufig verwendeter technischer Indikator, der den jüngsten Preisdaten ein höheres Gewicht verleiht und somit die Preisänderungen zeitnah im Vergleich zum einfachen Moving Average (SMA) widerspiegelt. Wenn ein kurzfristiger EMA (wie EMA5) über einen langfristigen EMA (wie EMA13) fällt, zeigt dies, dass die Preisbewegung steigt und ein Mehrwertsignal erzeugt. Umgekehrt, wenn ein kurzfristiger EMA unter einem langfristigen EMA fällt, zeigt dies, dass die Preisbewegung steigt und ein Nullsignal erzeugt.
Strategische Vorteile
- Einfach und leicht zu verstehen: Die Strategie verwendet nur zwei EMA-Indikatoren, die Prinzipien sind einfach und leicht zu verstehen und umzusetzen.
- Anpassungsfähigkeit: Durch die Anpassung der EMA-Zyklusparameter kann sie sich an verschiedene Marktumgebungen und Handelsarten anpassen.
- Hochzeitlichkeit: Die EMA reagiert zeitnah auf Preisänderungen im Vergleich zur SMA, was dazu beiträgt, Trendänderungen schnell zu erfassen.
- Skalierbarkeit: Auf der Grundlage dieser Strategie können andere technische Indikatoren oder Fundamentaldaten kombiniert werden, um die Leistung der Strategie weiter zu optimieren.
Strategisches Risiko
- Falsche Signale: In unsicheren Märkten oder bei unklaren Trends kann eine EMA-Kreuzung zu einem hohen False-Signal führen, was zu häufigen Transaktionen und Verlusten von Geldern führt.
- Verzögerung: Obwohl die EMA im Vergleich zur SMA weniger verzögerlich ist, gibt es immer noch eine gewisse Verzögerung, die den besten Einstiegsmoment verpassen kann.
- Fehlende Stop-Loss: Die Strategie enthält keine eindeutigen Stop-Loss-Konditionen und kann bei einer Umkehrung des Marktes große Verluste verursachen.
- Parameteroptimierung: Die Auswahl der EMA-Zyklusparameter muss für verschiedene Märkte und Sorten optimiert werden, da dies die Strategie-Performance beeinträchtigen kann.
Richtung der Strategieoptimierung
- Hinzufügen von Trendfilter: Auf Basis von EMA-Kreuzsignal wird ein Trendfilter in Kombination mit einem langfristigen Trendindikator (z. B. EMA50) verwendet, um falsche Signale zu reduzieren.
- Stop-Loss-Set: Ein dynamischer Stop-Loss basierend auf Indikatoren wie ATR oder der Verwendung eines festen Stop-Loss-Prozentsatzes, um den maximalen Verlust eines einzelnen Handels zu kontrollieren.
- Optimierungsparameter: Optimierung der EMA-Zyklusparameter durch Rückvergleiche mit historischen Daten, um die optimale Kombination von Parametern für den aktuellen Markt und die Sorte zu finden.
- In Kombination mit anderen Indikatoren: In Kombination mit anderen technischen Indikatoren (wie RSI, MACD usw.) zur Verbesserung der Signalbestätigung und -sicherheit.
Zusammenfassen
Die EMA5- und EMA13-Kreuzstrategie ist eine einfache und benutzerfreundliche Trendverfolgungsstrategie, die Änderungen der Preisentwicklung durch die Kreuzung zweier unterschiedlicher periodischer EMAs erfasst. Die Strategie hat den Vorteil, dass sie einfach, anpassungsfähig und zeitnah ist, aber auch Risiken wie Falschsignale, Verzögerung und fehlende Stop-Losses birgt. Zur weiteren Optimierung der Strategie kann man überlegen, Trendfilter hinzuzufügen, Stop-Loss-Sets, Optimierungsparameter einzurichten und andere technische Kennzahlen zu kombinieren.
/*backtest
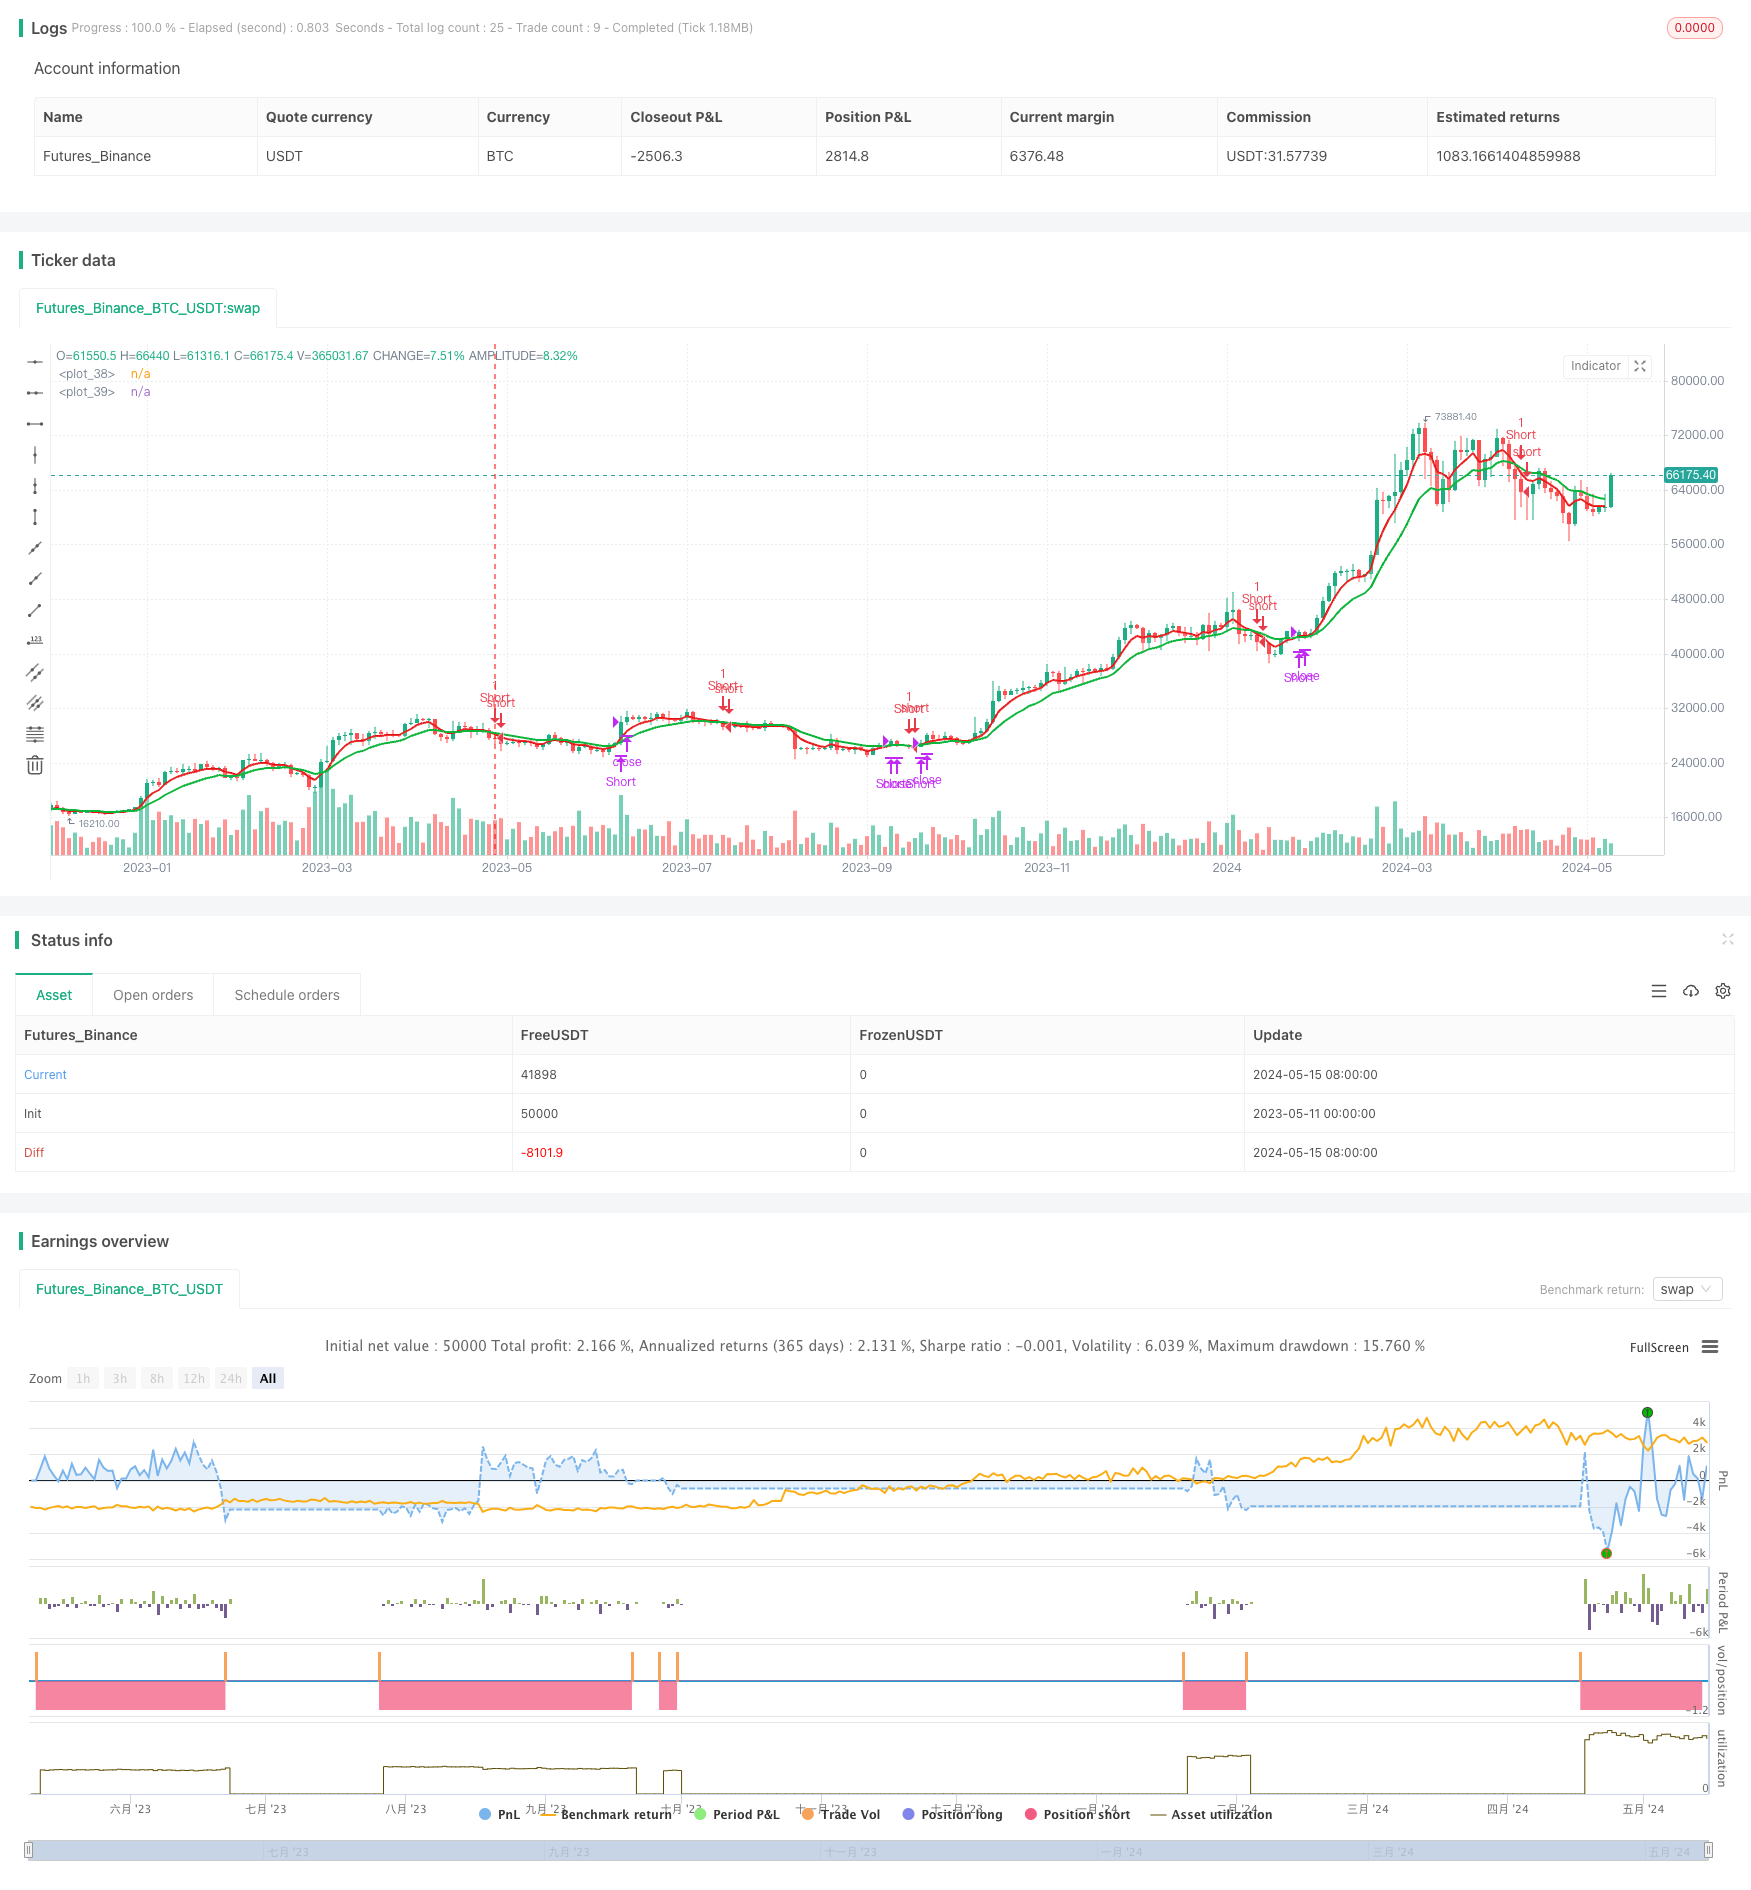
start: 2023-05-11 00:00:00
end: 2024-05-16 00:00:00
period: 2d
basePeriod: 1d
exchanges: [{"eid":"Futures_Binance","currency":"BTC_USDT"}]
*/
// This source code is subject to the terms of the Mozilla Public License 2.0 at https://mozilla.org/MPL/2.0/
// © Milankacha
//@version=5
strategy('5-13 EMA by Naimesh ver04', overlay=true)
qty = input(1, 'Buy quantity')
testStartYear = input(2021, 'Backtest Start Year')
testStartMonth = input(1, 'Backtest Start Month')
testStartDay = input(1, 'Backtest Start Day')
testStartHour = input(0, 'Backtest Start Hour')
testStartMin = input(0, 'Backtest Start Minute')
testPeriodStart = timestamp(testStartYear, testStartMonth, testStartDay, testStartHour, testStartMin)
testStopYear = input(2099, 'Backtest Stop Year')
testStopMonth = input(1, 'Backtest Stop Month')
testStopDay = input(30, 'Backtest Stop Day')
testPeriodStop = timestamp(testStopYear, testStopMonth, testStopDay, 0, 0)
testPeriodBackground = input(title='Color Background?', defval=true)
testPeriodBackgroundColor = testPeriodBackground and time >= testPeriodStart and time <= testPeriodStop ? #00FF00 : na
testPeriod() => true
ema1 = input(5, title='Select EMA 1')
ema2 = input(13, title='Select EMA 2')
//ema3 = input(50, title='Select EMA 3')
//SL = input(70, title='Stoploss')
//TR = input(250, title='Target')
expo = ta.ema(close, ema1)
ma = ta.ema(close, ema2)
//EMA_50 = ta.ema(close, ema3)
//avg_1 = avg (expo, ma)
//s2 = ta.cross(expo, ma) ? avg_1 : na
//plot(s2, style=plot.style_line, linewidth=3, color=color.red, transp=0)
p1 = plot(expo, color=color.rgb(231, 15, 15), linewidth=2)
p2 = plot(ma, color=#0db63a, linewidth=2)
fill(p1, p2, color=color.new(color.white, 80))
longCondition = ta.crossover(expo, ma)
shortCondition = ta.crossunder(expo, ma)
if testPeriod()
//strategy.entry('Long', strategy.long, when=longCondition)
strategy.entry('Short', strategy.short, when=expo<ma)
//strategy.close("Long", expo<ma, comment= 'SL hit')
strategy.close("Short", expo>ma, comment= 'SL hit')
//plotshape(longCondition and close>EMA_50, title='Buy Signal', text='B', textcolor=color.new(#FFFFFF, 0), style=shape.labelup, size=size.normal, location=location.belowbar, color=color.new(#1B8112, 0))
//plotshape(shortCondition and close<EMA_50, title='Sell Signal', text='S', textcolor=color.new(#FFFFFF, 0), style=shape.labeldown, size=size.normal, location=location.abovebar, color=color.new(#FF5733, 0))