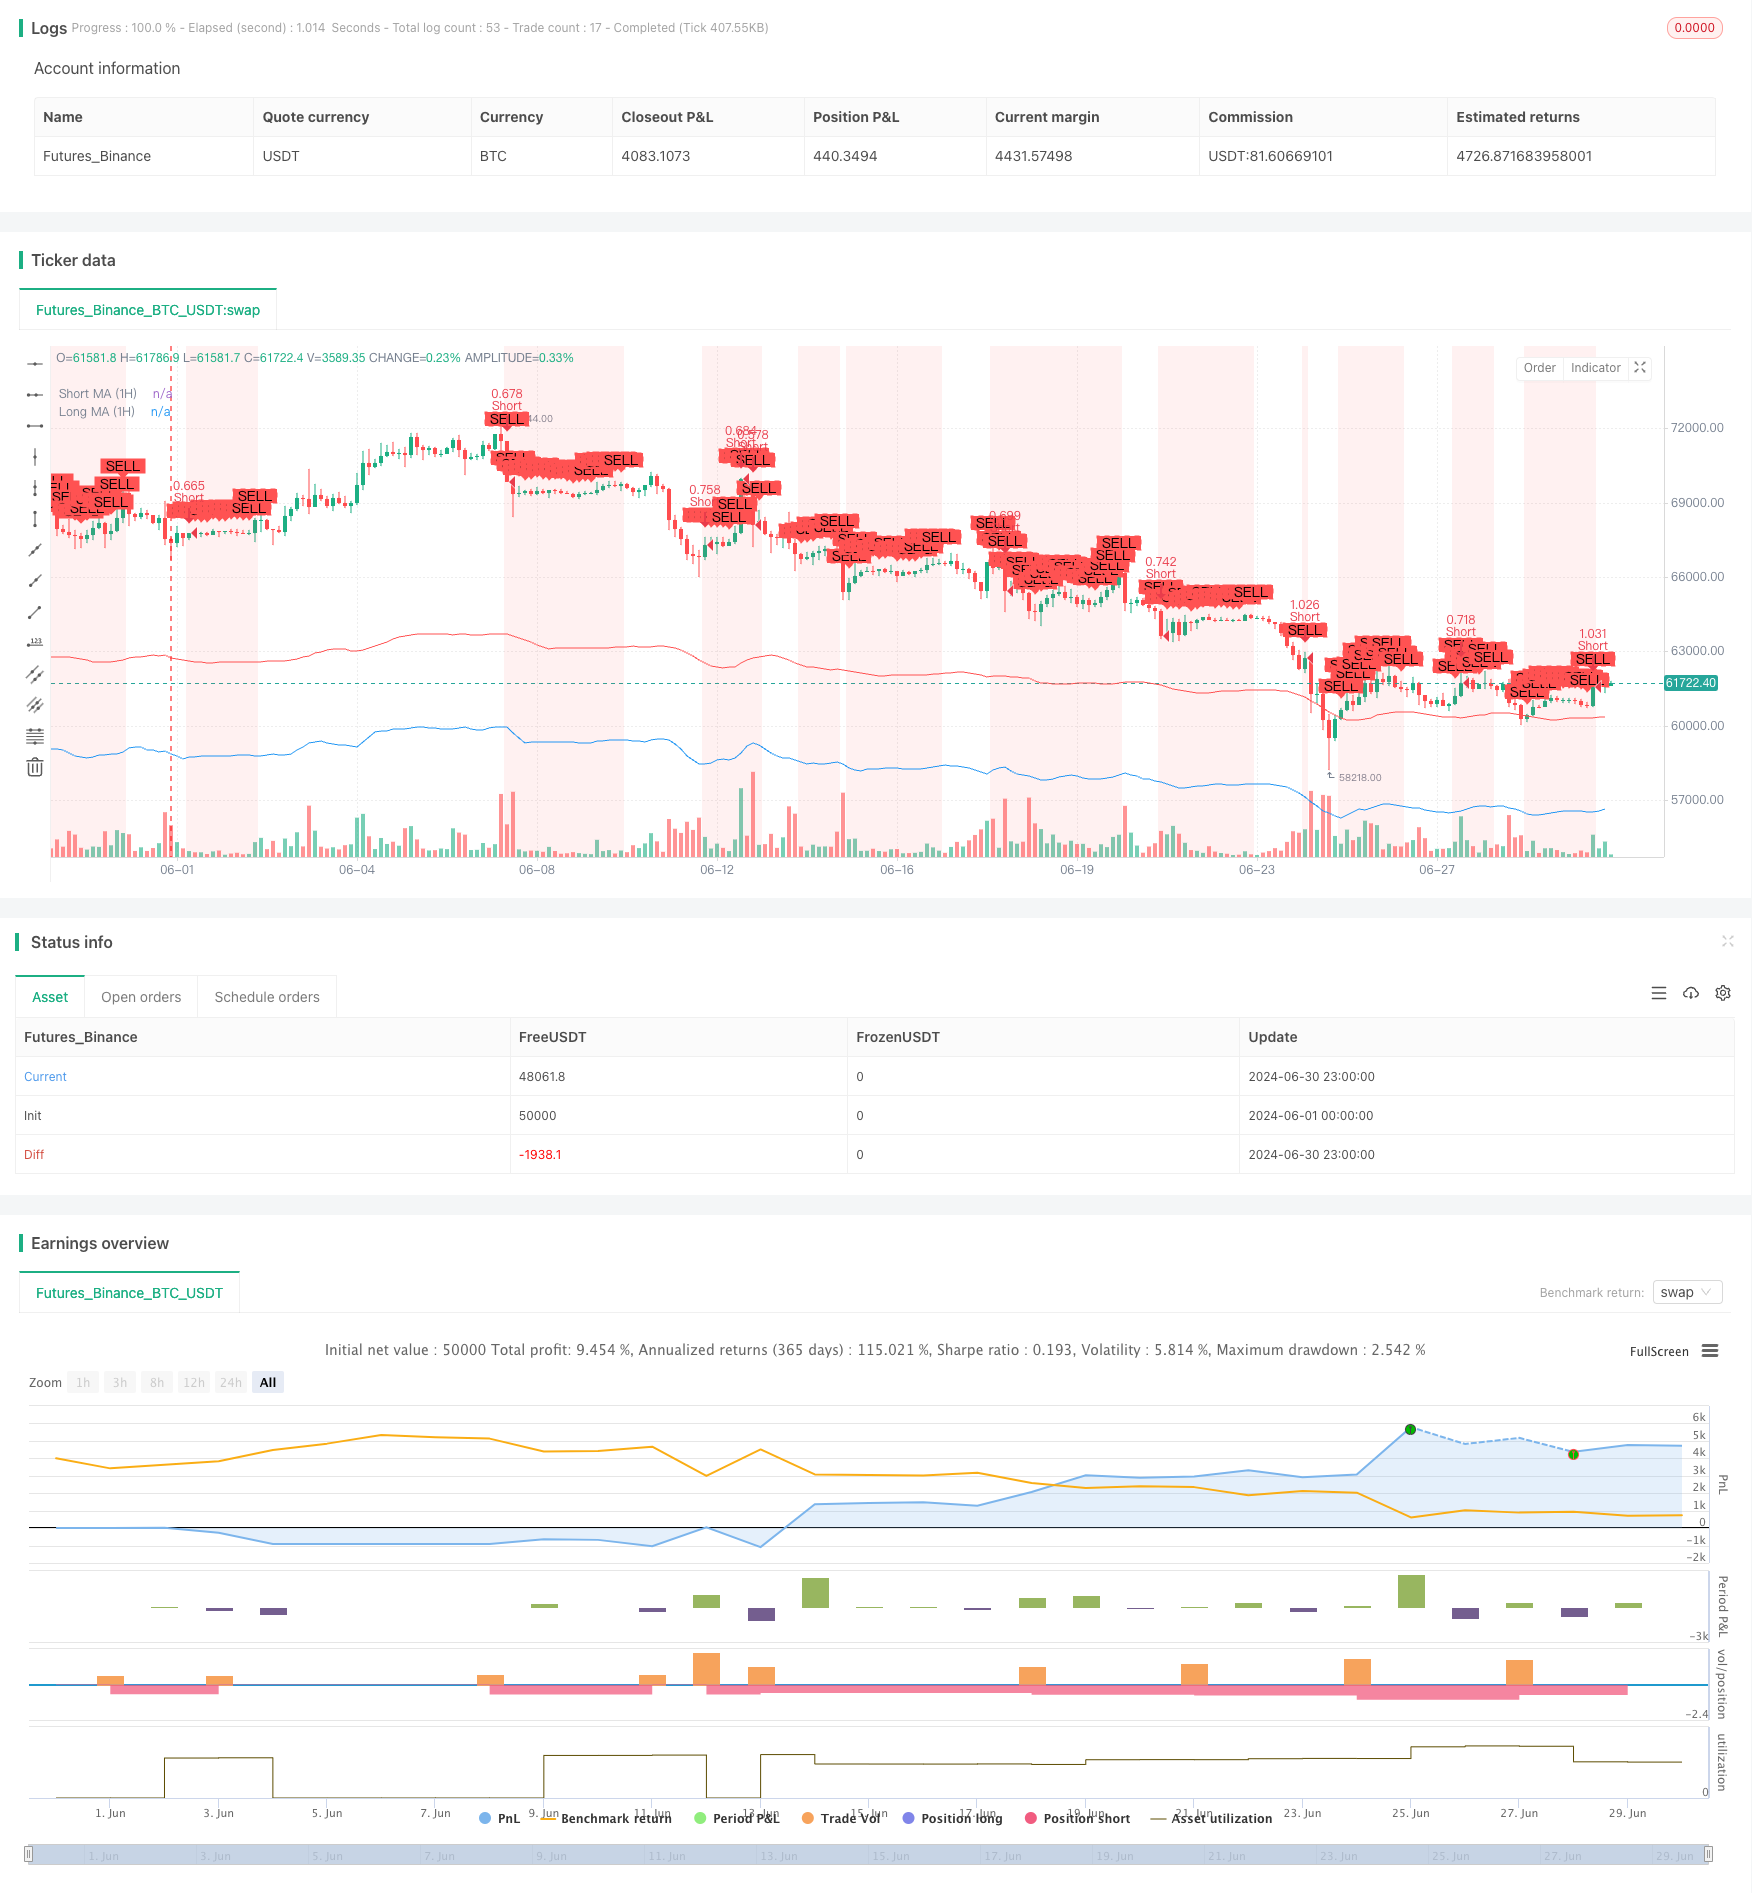
Overview
This strategy is a multi-timeframe trend following trading system that combines moving averages and the RSI indicator to determine market trends and entry timing. The strategy analyzes two timeframes - 1 hour and 15 minutes - to increase the reliability of trading signals. It employs dynamic stop-loss and take-profit levels and uses an ATR-based position sizing method to manage risk.
Strategy Principles
The core principle of this strategy is to confirm trends across multiple timeframes, thereby improving the accuracy of trading signals. Specifically:
1-Hour Timeframe Trend Confirmation:
- Uses 9-period and 21-period Simple Moving Averages (SMA) to determine overall trend direction.
- Utilizes the RSI indicator to identify potential overbought or oversold conditions.
15-Minute Timeframe Entry Confirmation:
- Also uses 9-period and 21-period SMAs to confirm short-term trends.
- Employs the RSI indicator to further confirm entry timing.
Trade Signal Generation:
- Long Signal: Short-term SMA is above long-term SMA on both 1-hour and 15-minute timeframes, and RSI is not overbought.
- Short Signal: Short-term SMA is below long-term SMA on both timeframes, and RSI is not oversold.
Risk Management:
- Uses the ATR indicator to dynamically set stop-loss and take-profit levels.
- Calculates position size based on account capital, risk tolerance, and market volatility.
Strategy Advantages
Multi-Timeframe Confirmation: Analyzing market trends across different timeframes significantly reduces the risk of false breakouts and signals.
Trend Following and Momentum Combination: Moving averages are used to identify trends, while RSI confirms momentum, improving the success rate of trades.
Dynamic Risk Management: Using ATR to set stop-loss and take-profit levels allows automatic adjustment based on market volatility, adapting to different market conditions.
Flexible Position Management: Calculating position size based on account size, risk preference, and market volatility contributes to long-term stable capital growth.
Visual Aids: The strategy plots various indicators and signals on the chart, allowing traders to intuitively understand and evaluate trading opportunities.
Strategy Risks
Trend Reversal Risk: The strategy may experience consecutive losses during strong trend reversals.
Overtrading: In ranging markets, the strategy may generate too many trading signals, increasing transaction costs.
Slippage Risk: In rapidly changing markets, actual execution prices may differ significantly from prices at signal generation.
Parameter Sensitivity: Strategy performance may be sensitive to parameter settings such as moving average periods and RSI thresholds.
Market Environment Dependency: The strategy performs well in trending markets but may underperform in choppy markets.
Strategy Optimization Directions
Add Filters: Introduce additional technical indicators or market sentiment indicators, such as volume, volatility, or fundamental data, to improve signal quality.
Adaptive Parameters: Develop algorithms that can dynamically adjust moving average periods and RSI thresholds based on market conditions.
Machine Learning Integration: Use machine learning algorithms to optimize parameter selection and signal generation processes.
Market Regime Recognition: Develop modules capable of identifying different market states (e.g., trending, ranging, high volatility) and adjust strategy behavior accordingly.
Improve Exit Mechanisms: In addition to fixed stop-loss and take-profit levels, consider using trailing stops or indicator-based dynamic exit strategies.
Add Time Filters: Incorporate trading time window restrictions to avoid periods of poor liquidity or excessive volatility.
Multi-Asset Correlation Analysis: If using the strategy on multiple assets, add correlation analysis to optimize the overall portfolio’s risk-return characteristics.
Conclusion
This multi-timeframe moving average and RSI trend trading strategy demonstrates how to combine multiple technical indicators and timeframes to build a relatively robust trading system. By confirming overall trends on longer timeframes and seeking specific entry opportunities on shorter timeframes, the strategy aims to improve the success rate and reliability of trades. The dynamic risk management and position sizing methods further enhance the strategy’s practicality.
However, like all trading strategies, it is not without flaws. In practical application, traders need to continuously monitor strategy performance and adjust parameters or optimize strategy logic in response to market changes. Through ongoing backtesting, optimization, and live trading validation, this strategy can become a promising trading tool, particularly suitable for traders who prefer to follow market trends and seek relatively stable returns.
//@version=5
strategy("SOL Futures Trading with MTF Confirmation", overlay=true)

// Input parameters
short_ma_length = input.int(9, title="Short MA Length")
long_ma_length = input.int(21, title="Long MA Length")
rsi_length = input.int(14, title="RSI Length")
rsi_overbought = input.int(70, title="RSI Overbought Level")
rsi_oversold = input.int(30, title="RSI Oversold Level")
atr_length = input.int(14, title="ATR Length")
risk_percentage = input.float(1, title="Risk Percentage", step=0.1) / 100
capital = input.float(50000, title="Capital")

// Higher Time Frame (1-hour) Indicators
short_ma_1h = request.security(syminfo.tickerid, "60", ta.sma(close, short_ma_length))
long_ma_1h = request.security(syminfo.tickerid, "60", ta.sma(close, long_ma_length))
rsi_1h = request.security(syminfo.tickerid, "60", ta.rsi(close, rsi_length))

// Lower Time Frame (15-minute) Confirmation Indicators
short_ma_15m = ta.sma(close, short_ma_length)
long_ma_15m = ta.sma(close, long_ma_length)
rsi_15m = ta.rsi(close, rsi_length)

// ATR for dynamic stop loss and take profit
atr = ta.atr(atr_length)

// Position sizing
position_size = (capital * risk_percentage) / atr

// Strategy Conditions on 1-hour chart
longCondition_1h = (short_ma_1h > long_ma_1h) and (rsi_1h < rsi_overbought)
shortCondition_1h = (short_ma_1h < long_ma_1h) and (rsi_1h > rsi_oversold)

// Entry Confirmation on 15-minute chart
longCondition_15m = (short_ma_15m > long_ma_15m) and (rsi_15m < rsi_overbought)
shortCondition_15m = (short_ma_15m < long_ma_15m) and (rsi_15m > rsi_oversold)

// Combine Conditions
longCondition = longCondition_1h and longCondition_15m
shortCondition = shortCondition_1h and shortCondition_15m

// Dynamic stop loss and take profit
long_stop_loss = close - 1.5 * atr
long_take_profit = close + 3 * atr
short_stop_loss = close + 1.5 * atr
short_take_profit = close - 3 * atr

// Plotting Moving Averages
plot(short_ma_1h, color=color.blue, title="Short MA (1H)")
plot(long_ma_1h, color=color.red, title="Long MA (1H)")

// Highlighting Long and Short Conditions
bgcolor(longCondition ? color.new(color.green, 90) : na, title="Long Signal Background")
bgcolor(shortCondition ? color.new(color.red, 90) : na, title="Short Signal Background")

// Generate Buy/Sell Signals with dynamic stop loss and take profit
if (longCondition)
    strategy.entry("Long", strategy.long, qty=position_size)
    strategy.exit("Long Exit", "Long", stop=long_stop_loss, limit=long_take_profit)

if (shortCondition)
    strategy.entry("Short", strategy.short, qty=position_size)
    strategy.exit("Short Exit", "Short", stop=short_stop_loss, limit=short_take_profit)

// Plotting Buy/Sell Signals
plotshape(series=longCondition, title="Buy Signal", location=location.belowbar, color=color.green, style=shape.labelup, text="BUY")
plotshape(series=shortCondition, title="Sell Signal", location=location.abovebar, color=color.red, style=shape.labeldown, text="SELL")

// // Plotting RSI
// hline(rsi_overbought, "RSI Overbought", color=color.red)
// hline(rsi_oversold, "RSI Oversold", color=color.green)
// plot(rsi_1h, title="RSI (1H)", color=color.blue)

// // Plotting ATR
// plot(atr, title="ATR", color=color.purple)