Overview
The Dynamic Position Management RSI Overbought Reversal Strategy is a short-term trading approach that combines technical indicators with dynamic position management. This strategy primarily utilizes the Relative Strength Index (RSI) and Simple Moving Averages (SMA) to identify potential overbought conditions and reversal opportunities, while optimizing risk-reward ratio through a scaled entry mechanism. The core idea is to enter short positions when an asset is in a long-term downtrend and showing short-term overbought signals, then exit when the market indicates oversold conditions or a trend reversal.
Strategy Principles
The strategy operates based on the following key steps: 1. Long-term Trend Assessment: Uses a 200-day Simple Moving Average (SMA) as a long-term trend filter. Short entries are only considered when the price is below the 200-day SMA. 2. Overbought Condition Identification: Employs a 2-period RSI indicator to detect short-term overbought conditions when it exceeds 75 for two consecutive days. 3. Scaled Position Building: Initiates with a 10% position size, then gradually increases the position as price moves higher. Additional 20%, 30%, and 40% positions are added when price exceeds previous entry points. 4. Exit Conditions: Closes all positions when the 2-period RSI drops below 30 (indicating potential oversold conditions) or when the 10-day SMA crosses above the 30-day SMA (signaling a potential trend reversal).
Strategy Advantages
- Risk Management: Effectively controls risk exposure per trade through scaled entries and dynamic position management.
- Trend Following: Utilizes a combination of long and short-term moving averages to capture long-term trends while identifying short-term reversal opportunities.
- Flexibility: Strategy parameters can be adjusted to adapt to different market environments and trading instruments.
- Automation Potential: Clear strategy logic facilitates easy implementation for automated trading systems.
Strategy Risks
- Market Risk: Potential for sustained losses in strongly bullish market conditions.
- Over-exposure Risk: The scaling mechanism may lead to excessive market exposure if triggered by false signals.
- Liquidity Risk: In less liquid markets, large trades may result in increased slippage.
- Technical Indicator Limitations: RSI and SMA indicators may generate false signals, leading to incorrect trading decisions.
Strategy Optimization Directions
- Incorporate Volatility Indicators: Integrate ATR (Average True Range) or other volatility indicators to dynamically adjust entry and exit thresholds.
- Refine Scaling Logic: Consider dynamically adjusting scaling ratios based on market volatility to avoid over-exposure during highly volatile periods.
- Add Fundamental Filters: Incorporate fundamental factors, such as market sentiment indicators or macroeconomic data, to enhance the reliability of entry signals.
- Backtesting and Optimization: Conduct extensive historical data backtests to optimize parameter settings and improve strategy stability and profitability.
Conclusion
The Dynamic Position Management RSI Overbought Reversal Strategy is a short-term trading approach that combines technical analysis with risk management principles. By leveraging RSI overbought signals and SMA trend determination, the strategy aims to capture potential market reversals. Its scaled entry and dynamic exit mechanisms help optimize the risk-reward profile. However, investors should be aware of market risks and technical indicator limitations when employing this strategy, and continually optimize strategy parameters and logic based on actual trading environments. With proper risk control and ongoing strategy refinement, this approach has the potential to become an effective quantitative trading tool.
/*backtest
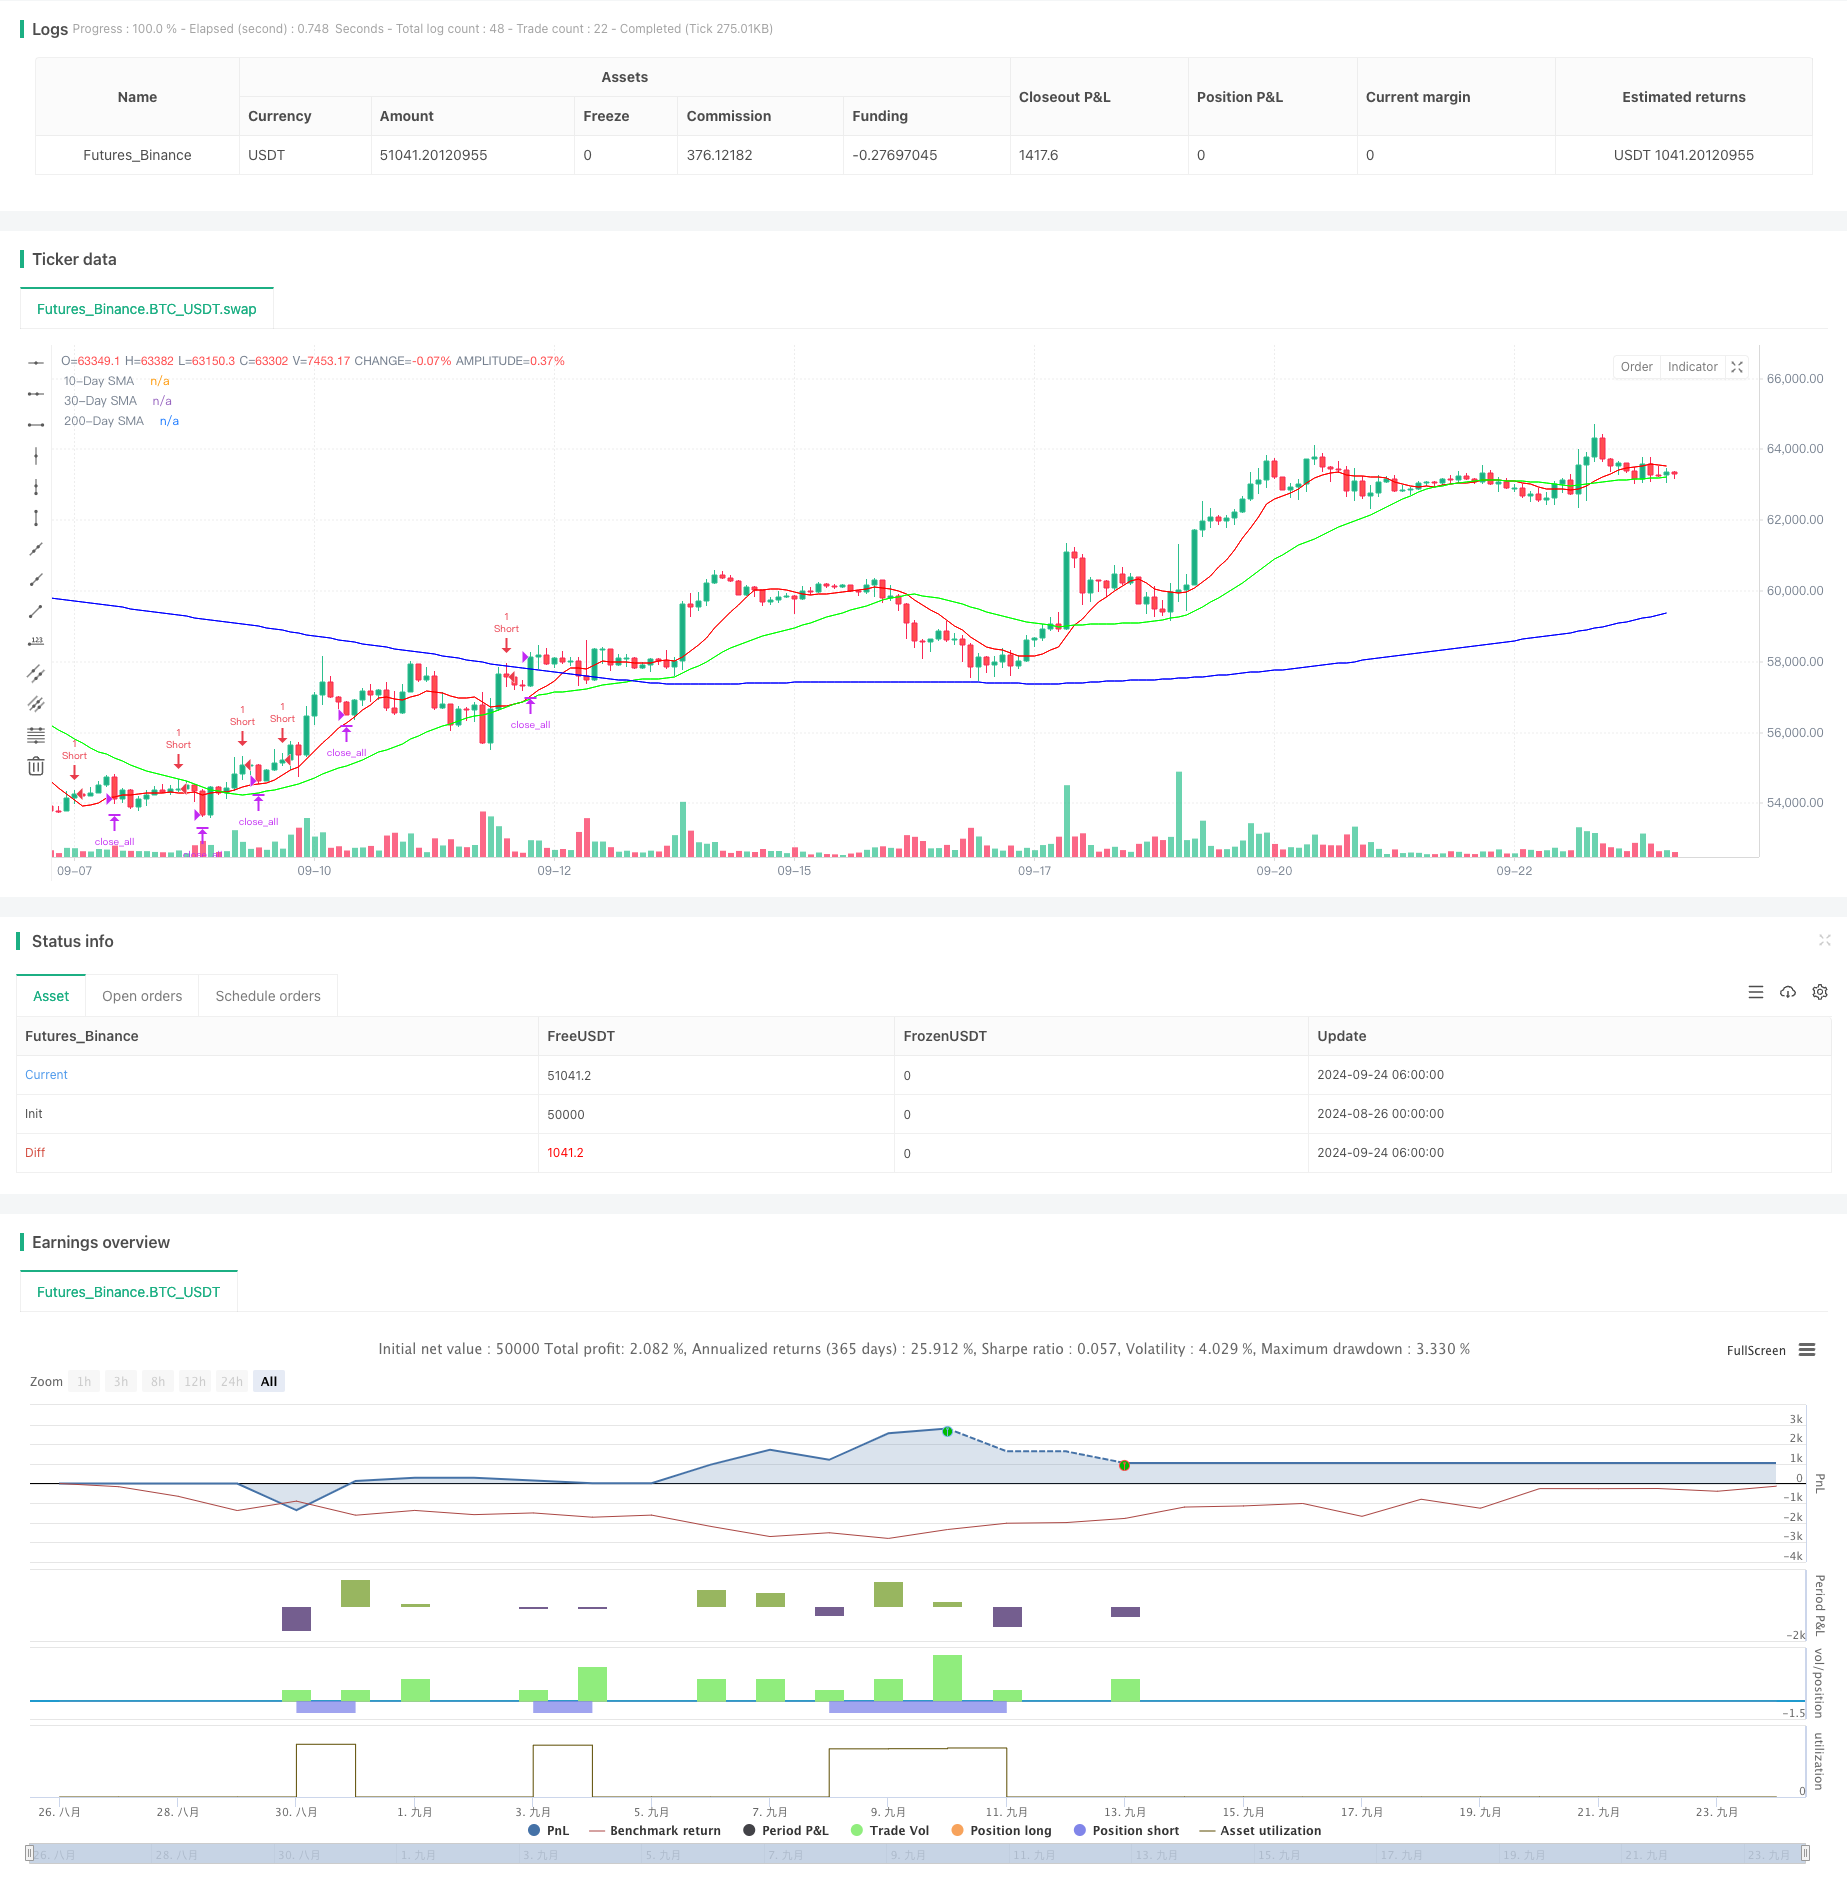
start: 2024-08-26 00:00:00
end: 2024-09-24 08:00:00
period: 2h
basePeriod: 2h
exchanges: [{"eid":"Futures_Binance","currency":"BTC_USDT"}]
*/
//@version=5
strategy("TPS Short Strategy by Larry Conners", overlay=true)
// Define parameters as inputs
sma_length_200 = input.int(200, title="200-Day SMA Length")
rsi_length_2 = input.int(2, title="2-Period RSI Length")
sma_length_10 = input.int(10, title="10-Day SMA Length")
sma_length_30 = input.int(30, title="30-Day SMA Length")
// Define colors as RGB values
color_sma_200 = input.color(color.rgb(0, 0, 255), title="200-Day SMA Color") // Blue
color_sma_10 = input.color(color.rgb(255, 0, 0), title="10-Day SMA Color") // Red
color_sma_30 = input.color(color.rgb(0, 255, 0), title="30-Day SMA Color") // Green
// Calculate indicators
sma_200 = ta.sma(close, sma_length_200)
rsi_2 = ta.rsi(close, rsi_length_2)
sma_10 = ta.sma(close, sma_length_10)
sma_30 = ta.sma(close, sma_length_30)
// Define conditions
below_sma_200 = close < sma_200
rsi_2_above_75_two_days = rsi_2[1] > 75 and rsi_2 > 75
price_higher_than_entry = na(strategy.opentrades.entry_price(0)) ? false : close > strategy.opentrades.entry_price(0)
// Entry conditions
if (below_sma_200 and rsi_2_above_75_two_days and na(strategy.opentrades.entry_price(0)))
strategy.entry("Short", strategy.short, qty=1) // Short 10% of the position
// Scaling in conditions
if (price_higher_than_entry)
strategy.entry("Short2", strategy.short, qty=2) // Short 20% more of the position
if (price_higher_than_entry)
strategy.entry("Short3", strategy.short, qty=3) // Short 30% more of the position
if (price_higher_than_entry)
strategy.entry("Short4", strategy.short, qty=4) // Short 40% more of the position
// Exit conditions
exit_condition_rsi_below_30 = rsi_2 < 30
exit_condition_sma_cross = ta.crossover(sma_10, sma_30)
if (exit_condition_rsi_below_30 or exit_condition_sma_cross)
strategy.close_all() // Close all positions
// Plot indicators
plot(sma_200, color=color_sma_200, title="200-Day SMA")
plot(sma_10, color=color_sma_10, title="10-Day SMA")
plot(sma_30, color=color_sma_30, title="30-Day SMA")