概述
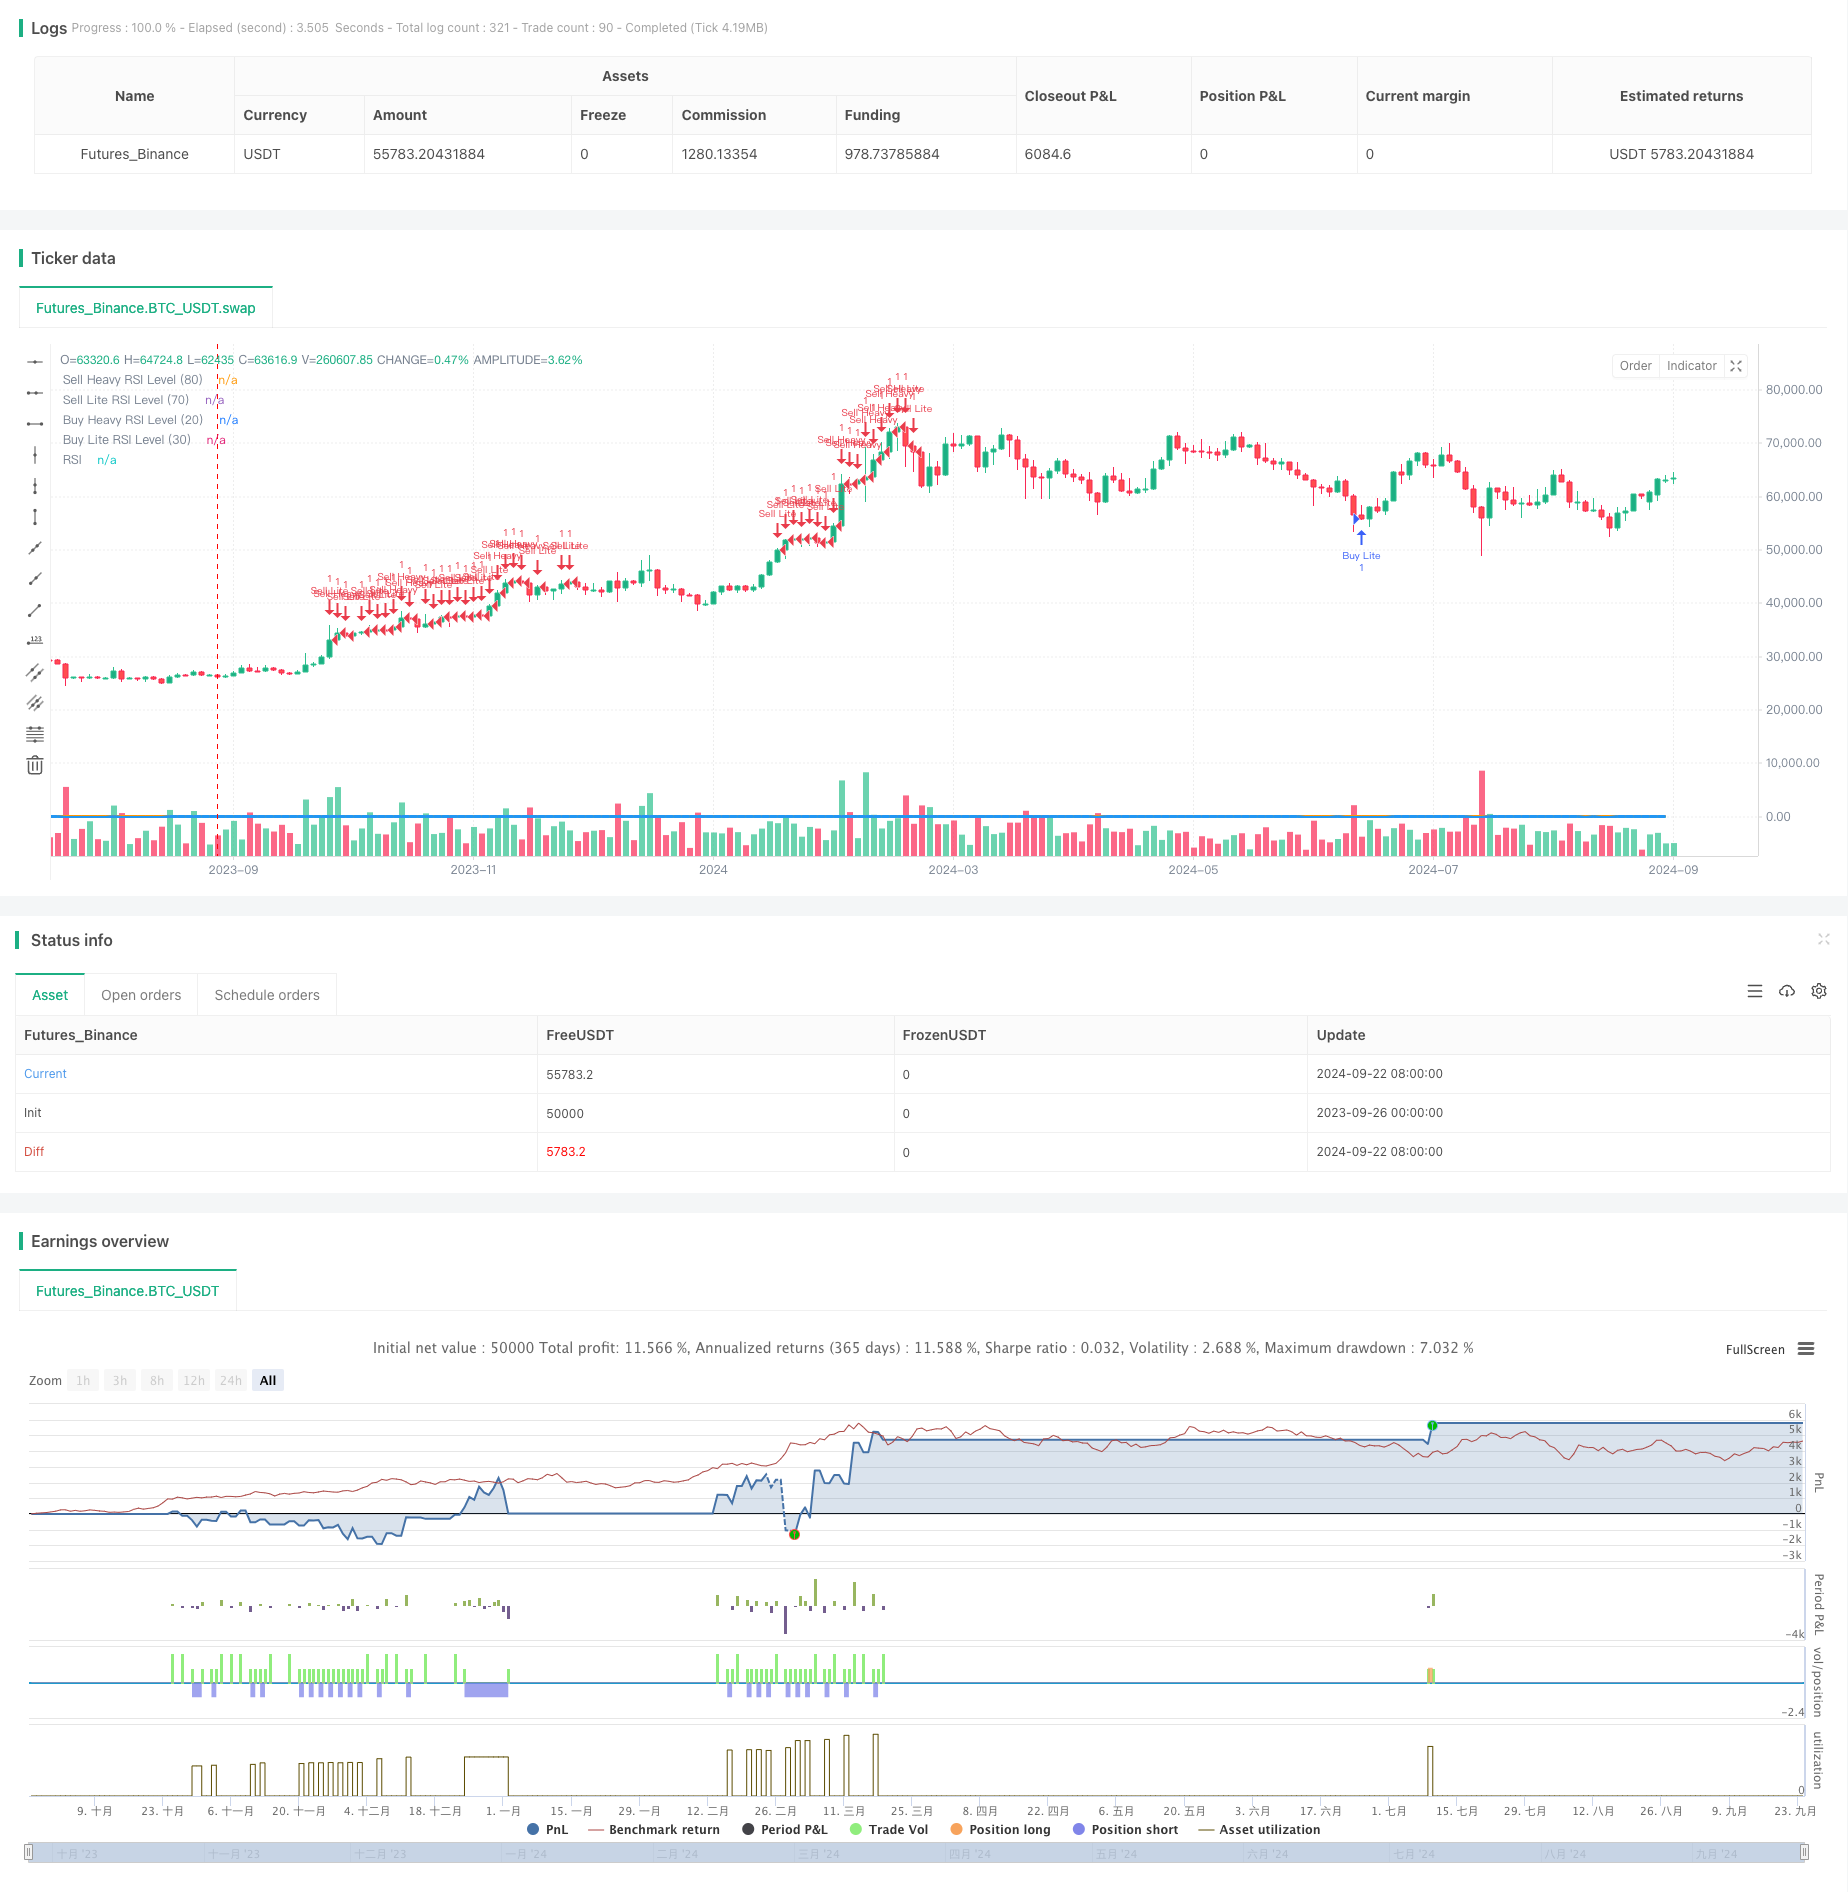
RSI多区间交易策略是一种基于相对强弱指标(RSI)的自动化交易系统,专为5分钟图表设计。该策略通过划分多个RSI区间来触发不同强度的买入和卖出信号,同时结合了止盈和止损机制以管理风险。这种方法允许交易者根据市场的超买和超卖程度灵活调整头寸,有潜力在波动市场中捕捉短期价格变动。
策略原理
该策略的核心是利用RSI指标在不同水平触发交易信号:
买入信号:
- RSI < 20: 触发”重度买入”
- RSI 在20-30之间: 触发”轻度买入”
卖出信号:
- RSI > 80: 触发”重度卖出”
- RSI 在70-80之间: 触发”轻度卖出”
每个交易都设有固定的止盈和止损水平,以保护利润和限制潜在损失。策略还包括警报功能,在RSI达到关键水平时通知交易者。
策略优势
多层次入场: 通过区分”重度”和”轻度”交易信号,策略可以根据市场超买/超卖程度的强弱调整仓位大小。
风险管理: 内置的止盈和止损机制有助于自动化风险控制,防止单笔交易造成过大损失。
高度可定制: 交易者可以根据个人风险偏好和市场条件调整RSI水平、止盈止损点等参数。
实时警报: 策略设置了多个警报触发点,有助于交易者及时关注市场动向,即使在不实际执行自动交易时也能获得有价值的市场洞察。
适应性强: 该策略适用于多种金融工具,特别适合波动性较大的市场。
策略风险
假突破风险: 在震荡市场中,RSI可能频繁穿越设定的阈值,导致过多交易和潜在的亏损。
趋势市场表现: 在强劲趋势中,策略可能会过早平仓或错过大的行情,因为RSI可能长期处于超买或超卖区域。
参数敏感性: 策略的性能高度依赖于RSI参数和入场阈值的设置,不当的参数可能导致表现不佳。
滑点风险: 在快速市场中,实际的成交价格可能与预期有显著差异,影响止盈止损的有效性。
过度交易: 频繁的交易信号可能导致过高的交易成本,侵蚀潜在利润。
策略优化方向
引入趋势过滤器: 结合移动平均线或其他趋势指标,以避免在强趋势中逆势交易。
动态止盈止损: 根据市场波动性自动调整止盈止损水平,以适应不同市场环境。
时间过滤: 增加交易时间窗口限制,避开低流动性时段或重要新闻发布时间。
量化分析优化: 使用回测数据进行蒙特卡洛模拟,找出最优参数组合。
结合其他技术指标: 如MACD或布林带,增加交易信号的确认机制。
仓位管理优化: 实现基于账户余额和市场波动性的动态仓位管理。
总结
RSI多区间交易策略为交易者提供了一种基于市场动量的系统化交易方法。通过细分RSI水平和引入多级别交易信号,该策略旨在捕捉短期市场波动,同时通过止盈止损机制管理风险。虽然策略具有高度的可定制性和潜在的盈利能力,但交易者需要注意参数优化和市场适应性的挑战。通过引入额外的过滤机制和动态风险管理,该策略有潜力成为一个强大的自动化交易工具。然而,如同所有交易策略一样,在实盘交易中应谨慎使用,并进行充分的回测和前向测试。
/*backtest
start: 2023-09-26 00:00:00
end: 2024-09-24 08:00:00
period: 2d
basePeriod: 2d
exchanges: [{"eid":"Futures_Binance","currency":"BTC_USDT"}]
*/

//@version=5
strategy("M5 Trading Rule", overlay=true)

// Copyright © 2024 TRADINGWITHKAY. All rights reserved.
// Unauthorized use, distribution, and modification of this code are strictly prohibited.

// Input parameters
rsiLength = input(14, title="RSI Length")
rsiOverboughtHeavy = input(80, title="RSI Sell Heavy Level")
rsiOverboughtLite = input(70, title="RSI Sell Lite Level")
rsiOversoldHeavy = input(20, title="RSI Buy Heavy Level")
rsiOversoldLite = input(30, title="RSI Buy Lite Level")
takeProfitPips = input(50, title="Take Profit (Pips)")
stopLossPips = input(50, title="Stop Loss (Pips)")
pipValue = syminfo.mintick * 10 // Assuming 1 pip = 0.0001 for Forex

// Calculate RSI
rsi = ta.rsi(close, rsiLength)

// Convert pips to price distance
takeProfitPrice = takeProfitPips * pipValue
stopLossPrice = stopLossPips * pipValue

// Conditions for entries
buyHeavyCondition = rsi < rsiOversoldHeavy
buyLiteCondition = rsi < rsiOversoldLite and not buyHeavyCondition
sellHeavyCondition = rsi > rsiOverboughtHeavy
sellLiteCondition = rsi > rsiOverboughtLite and not sellHeavyCondition

// Plot the RSI levels for overbought and oversold zones
plot(rsiOverboughtHeavy, title="Sell Heavy RSI Level (80)", color=color.red, linewidth=2, style=plot.style_line)
plot(rsiOverboughtLite, title="Sell Lite RSI Level (70)", color=color.orange, linewidth=2, style=plot.style_line)
plot(rsiOversoldHeavy, title="Buy Heavy RSI Level (20)", color=color.green, linewidth=2, style=plot.style_line)
plot(rsiOversoldLite, title="Buy Lite RSI Level (30)", color=color.blue, linewidth=2, style=plot.style_line)

// Execute Buy Heavy
if (buyHeavyCondition)
    strategy.entry("Buy Heavy", strategy.long)
    // Separate Take Profit and Stop Loss
    strategy.exit("Take Profit", "Buy Heavy", limit=close + takeProfitPrice)
    strategy.exit("Stop Loss", "Buy Heavy", stop=close - stopLossPrice)
    alert("RSI is below 20! Buy Heavy Condition Triggered!", alert.freq_once_per_bar)

// Execute Buy Lite
if (buyLiteCondition)
    strategy.entry("Buy Lite", strategy.long)
    // Separate Take Profit and Stop Loss
    strategy.exit("Take Profit", "Buy Lite", limit=close + takeProfitPrice)
    strategy.exit("Stop Loss", "Buy Lite", stop=close - stopLossPrice)
    alert("RSI is below 30! Buy Lite Condition Triggered!", alert.freq_once_per_bar)

// Execute Sell Heavy
if (sellHeavyCondition)
    strategy.entry("Sell Heavy", strategy.short)
    // Separate Take Profit and Stop Loss
    strategy.exit("Take Profit", "Sell Heavy", limit=close - takeProfitPrice)
    strategy.exit("Stop Loss", "Sell Heavy", stop=close + stopLossPrice)
    alert("RSI is above 80! Sell Heavy Condition Triggered!", alert.freq_once_per_bar)

// Execute Sell Lite
if (sellLiteCondition)
    strategy.entry("Sell Lite", strategy.short)
    // Separate Take Profit and Stop Loss
    strategy.exit("Take Profit", "Sell Lite", limit=close - takeProfitPrice)
    strategy.exit("Stop Loss", "Sell Lite", stop=close + stopLossPrice)
    alert("RSI is above 70! Sell Lite Condition Triggered!", alert.freq_once_per_bar)

// Plot RSI on a separate chart for easier visibility
plot(rsi, title="RSI", color=color.blue, linewidth=2)

// Alert when price hits the high or low RSI levels
if (rsi <= rsiOversoldHeavy)
    alert("Price has reached the Buy Heavy RSI Level (20)!", alert.freq_once_per_bar)

if (rsi <= rsiOversoldLite and rsi > rsiOversoldHeavy)
    alert("Price has reached the Buy Lite RSI Level (30)!", alert.freq_once_per_bar)

if (rsi >= rsiOverboughtHeavy)
    alert("Price has reached the Sell Heavy RSI Level (80)!", alert.freq_once_per_bar)

if (rsi >= rsiOverboughtLite and rsi < rsiOverboughtHeavy)
    alert("Price has reached the Sell Lite RSI Level (70)!", alert.freq_once_per_bar)