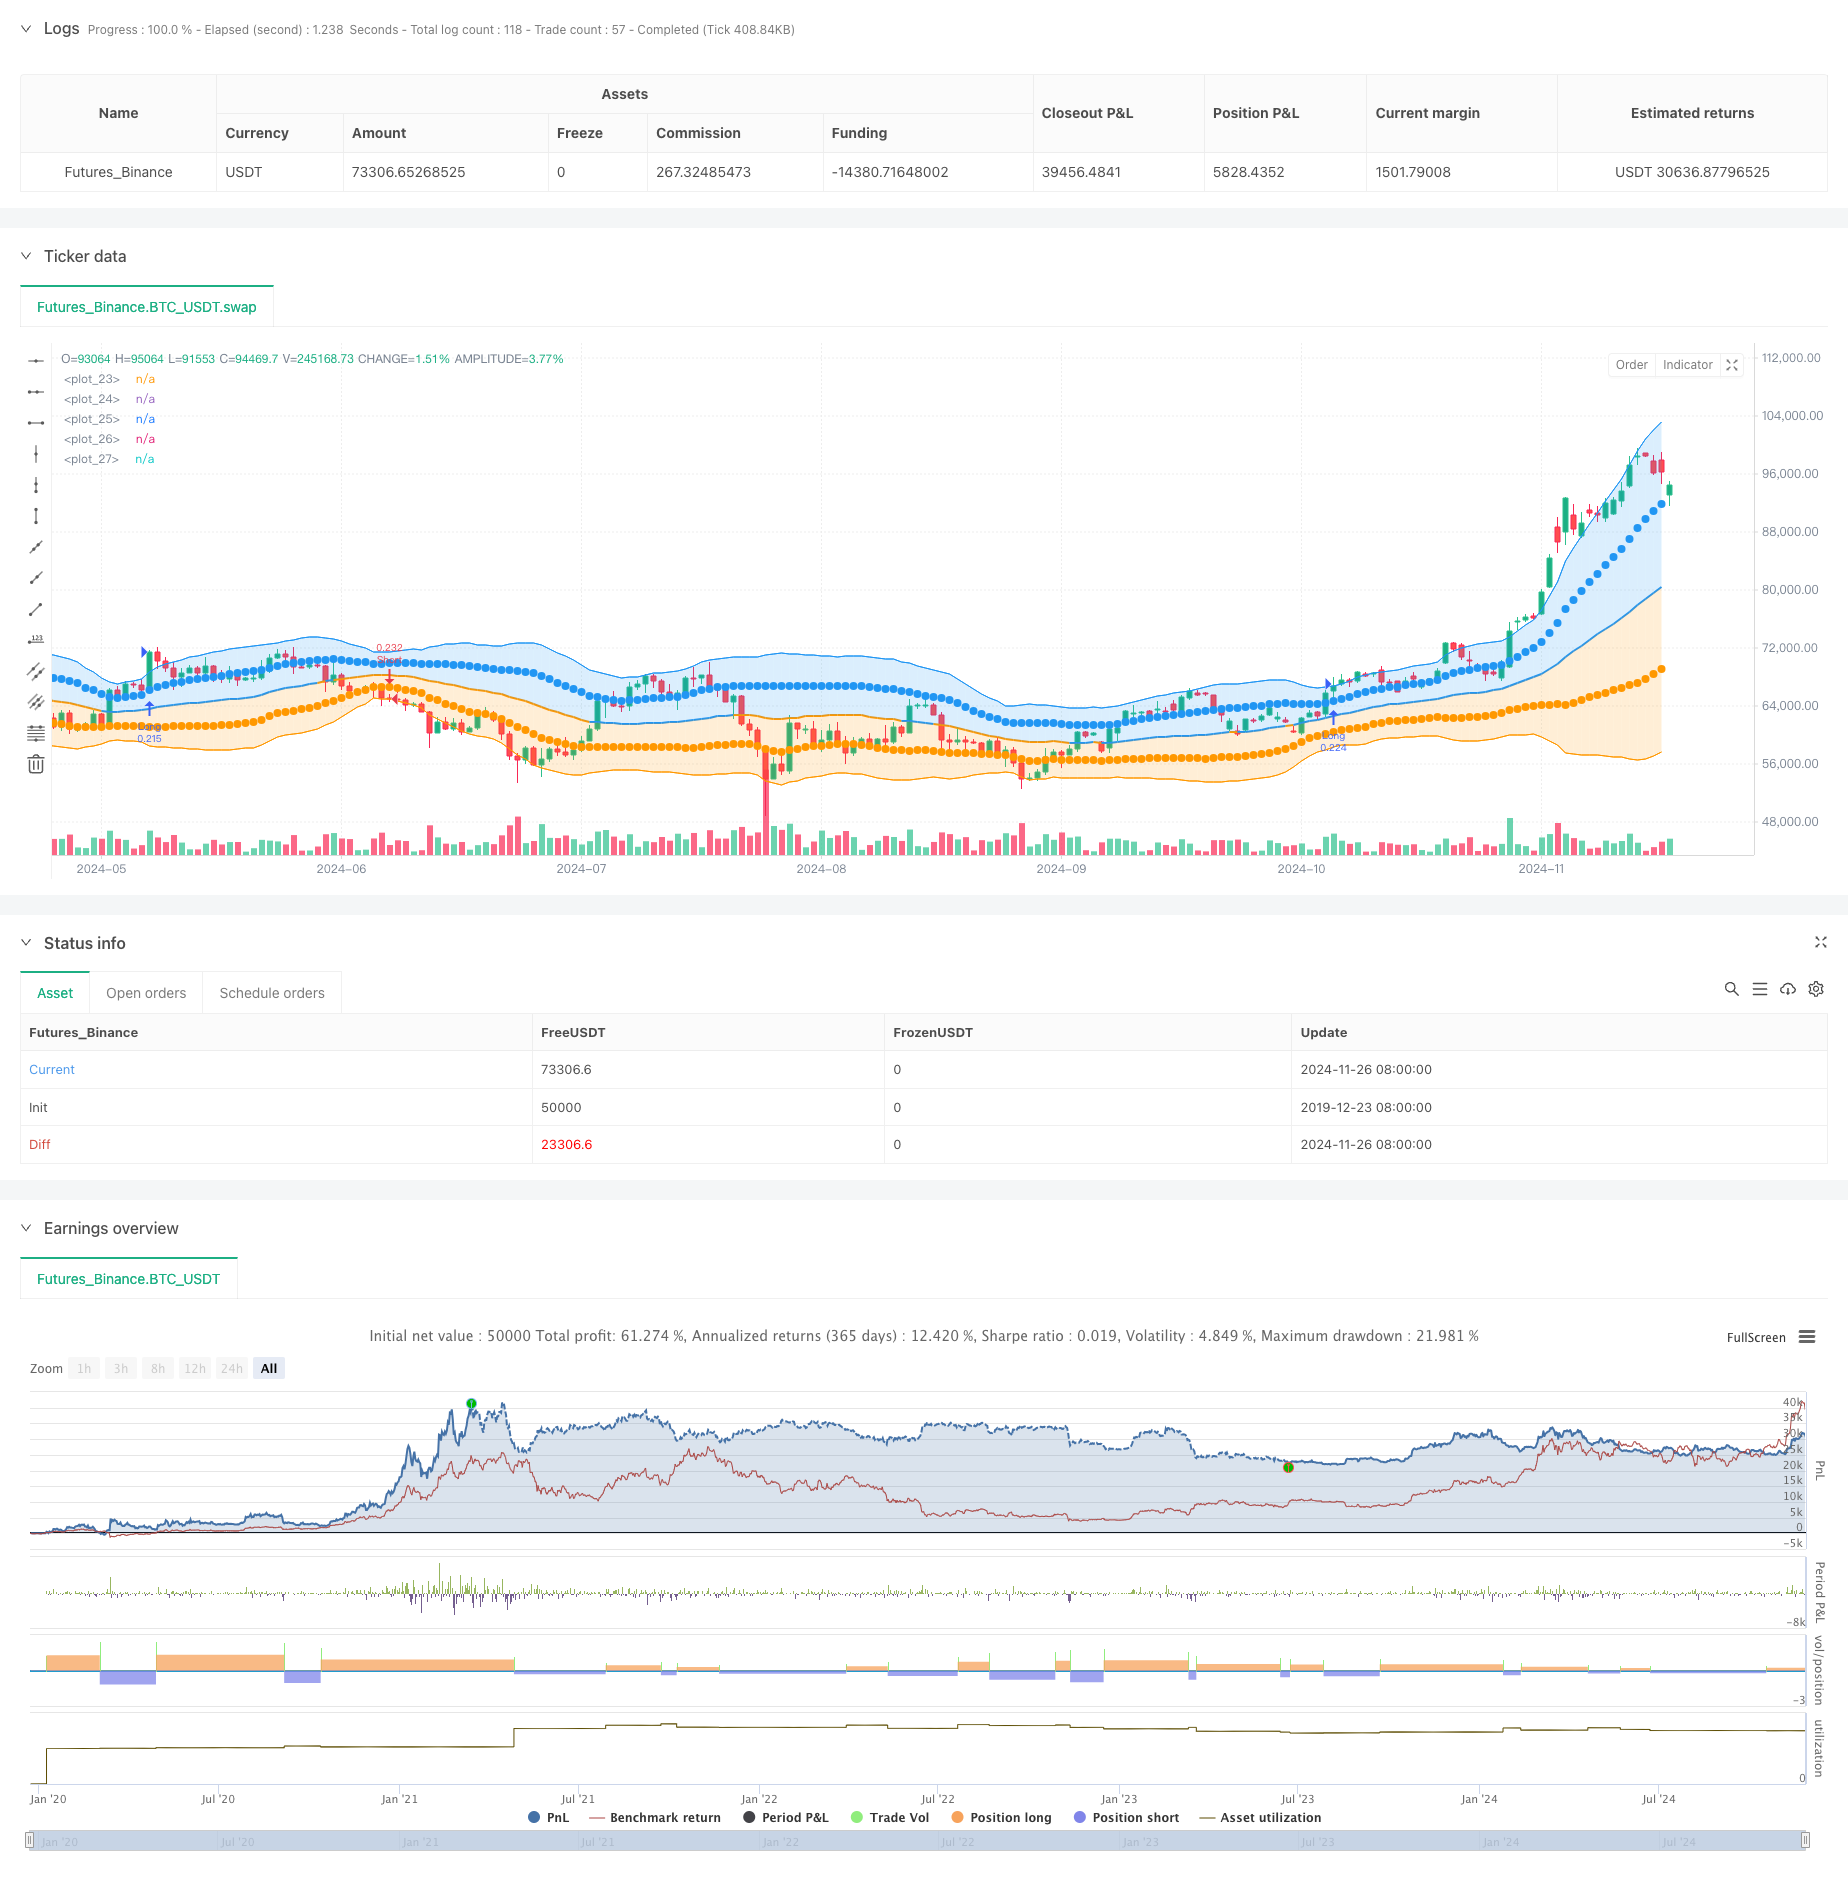
Dual Standard Deviation Bollinger Bands Momentum Breakout Strategy
Author: ChaoZhang, Date: 2024-11-28 15:10:20Tags: BBSMASDMULTATR

Overview
This strategy represents an innovative application of the Bollinger Bands indicator, utilizing dual standard deviation bands for momentum capture. The core mechanism relies on a system of Bollinger Bands constructed using two different standard deviation levels (1SD and 2SD), generating trading signals when price breaks through the 2SD channel. Through precise mathematical modeling and statistical principles, this strategy provides traders with a systematic trading approach.
Strategy Principles
The strategy employs a 34-period moving average as the middle band, with upper and lower bands calculated using both single and double standard deviations. Buy signals are generated when price breaks above the 2SD upper band, while sell signals occur when price breaks below the 2SD lower band. The strategy includes automatic stop-loss mechanisms, closing long positions when price breaks below the lower band and short positions when price breaks above the upper band. A money management system is implemented, using 30% of account equity per trade for effective risk control.
Strategy Advantages
- Dual standard deviation design provides more precise market extreme judgments
- Automated entry/exit mechanisms reduce human judgment errors
- Comprehensive money management system ensures controlled risk
- Highly adaptable parameters suitable for different market conditions
- High degree of visualization with clear trading signals
- Combines trend following and volatility breakout trading approaches
Strategy Risks
- May generate frequent false breakouts in ranging markets
- Stop-loss settings might lead to premature exits in highly volatile markets
- Fixed position sizing might increase risk during consecutive losses
- Improper parameter settings may result in lagging signals Risk management recommendations:
- Confirm signals with additional technical indicators
- Dynamically adjust standard deviation multiplier
- Implement trailing stop-loss mechanisms
- Adjust position size based on volatility
Optimization Directions
- Introduce adaptive standard deviation calculation methods for automatic adjustment of band width based on market volatility
- Add volume confirmation mechanism to improve breakout signal reliability
- Optimize money management system with dynamic position sizing
- Implement trend filters to reduce false signals in ranging markets
- Develop intelligent parameter optimization system for automated strategy tuning
Summary
This innovative strategy based on the classic Bollinger Bands indicator provides a trading system with both theoretical foundation and practical utility through its dual standard deviation design. While maintaining operational simplicity and intuitiveness, the strategy offers traders a reliable trading tool through rigorous mathematical modeling and comprehensive risk control mechanisms. Although there is room for optimization, its core logic is sound and demonstrates good practical value.
/*backtest
start: 2019-12-23 08:00:00
end: 2024-11-27 00:00:00
period: 1d
basePeriod: 1d
exchanges: [{"eid":"Futures_Binance","currency":"BTC_USDT"}]
*/

//@version=5
// Baker Odeh's Strategy - Bollinger Bands : 27/SEP/2014 01:36 : 1.0
// This displays the traditional Bollinger Bands, the difference is
// that the 1st and 2nd StdDev are outlined with two colors and two
// different levels, one for each Standard Deviation

strategy(shorttitle="Baker Odeh's Strategy - Bollinger Bands", title="Baker Odeh's Strategy - Bollinger Bands", overlay=true, currency=currency.NONE, initial_capital=30, default_qty_type=strategy.percent_of_equity, default_qty_value=20)
src = input(close)
length = input.int(34, minval=1)
mult = input.float(2.0, minval=0.001, maxval=50)

basis = ta.sma(src, length)
dev = ta.stdev(src, length)
dev2 = mult * dev

upper1 = basis + dev
lower1 = basis - dev
upper2 = basis + dev2
lower2 = basis - dev2

colorBasis = src >= basis ? color.blue : color.orange

pBasis = plot(basis, linewidth=2, color=colorBasis)
pUpper1 = plot(upper1, color=color.new(color.blue, 0), style=plot.style_circles)
pLower1 = plot(lower1, color=color.new(color.orange, 0), style=plot.style_circles)
pUpper2 = plot(upper2, color=color.new(color.blue, 0))
pLower2 = plot(lower2, color=color.new(color.orange, 0))

fill(pBasis, pUpper2, color=color.new(color.blue, 80))
fill(pUpper1, pUpper2, color=color.new(color.blue, 80))
fill(pBasis, pLower2, color=color.new(color.orange, 80))
fill(pLower1, pLower2, color=color.new(color.orange, 80))

if (close > upper2)
    strategy.entry("Long", strategy.long)

if (close < lower2)
    strategy.entry("Short", strategy.short)

if (close <= lower2)
    strategy.close("Long")

if (close >= upper2)
    strategy.close("Short")
- Multi-Period Bollinger Bands Touch Trend Reversal Quantitative Trading Strategy
- Multi-Technical Indicator Dynamic Adaptive Trading Strategy (MTDAT)
- Enhanced Mean Reversion Strategy with MACD-ATR Implementation
- Multi-Level Intelligent Dynamic Trailing Stop Strategy Based on Bollinger Bands and ATR
- Bollinger Bands Mean Reversion Trading Strategy with Dynamic Support
- Bollinger Bands Precise Crossover Quantitative Strategy
- Bollinger Bands Breakout Quantitative Trading Strategy
- Bollinger Bands Momentum Reversal Quantitative Strategy
- Bollinger Band ATR Trend Following Strategy
- Enhanced Dynamic Bollinger Bands Trading Strategy
- ADX Trend Breakout Momentum Trading Strategy
- Trend Following and Mean Reversion Dual Optimization Trading System(Double Seven Strategy)
- Multi-Period Moving Average and RSI Momentum Cross Strategy
- Dual Moving Average MACD Crossover Date-Adjustable Quantitative Trading Strategy
- High-Frequency Dynamic Multi-Indicator Moving Average Crossover Strategy
- Triple Exponential Moving Average Trend Trading Strategy
- Multi-Timeframe EMA Trend Strategy with Daily High-Low Breakout System
- Advanced Flexible Multi-Period Moving Average Crossover Strategy
- T3 Moving Average Trend Following Strategy with Trailing Stop Loss
- Multi-Technical Indicator Trend Following Strategy with Ichimoku Cloud Breakout and Stop-Loss System
- Advanced Timeframe Fibonacci Retracement with High-Low Breakout Trading System
- RSI Dynamic Exit Level Momentum Trading Strategy
- Multi-Indicator Cross-Trend Tracking and Volume-Price Combined Adaptive Trading Strategy
- Advanced Dual Moving Average Momentum Trend Following Trading System
- Dynamic Take-Profit Smart Trailing Strategy
- Multi-Timeframe Trend Following Strategy with ATR Volatility Management
- Dynamic Cost Averaging Strategy System Based on Bollinger Bands and RSI
- Multi-SMA Support Level False Breakout Strategy with ATR Stop-Loss System
- EMA Crossover Strategy with Stop Loss and Take Profit Optimization System
- VWAP-MACD-RSI Multi-Factor Quantitative Trading Strategy