Multi-Trend Momentum Crossover Strategy with Volatility Optimization System
Author: ChaoZhang, Date: 2024-11-29 16:07:17Tags: EMAMACDRSIBBATRVOL

Overview
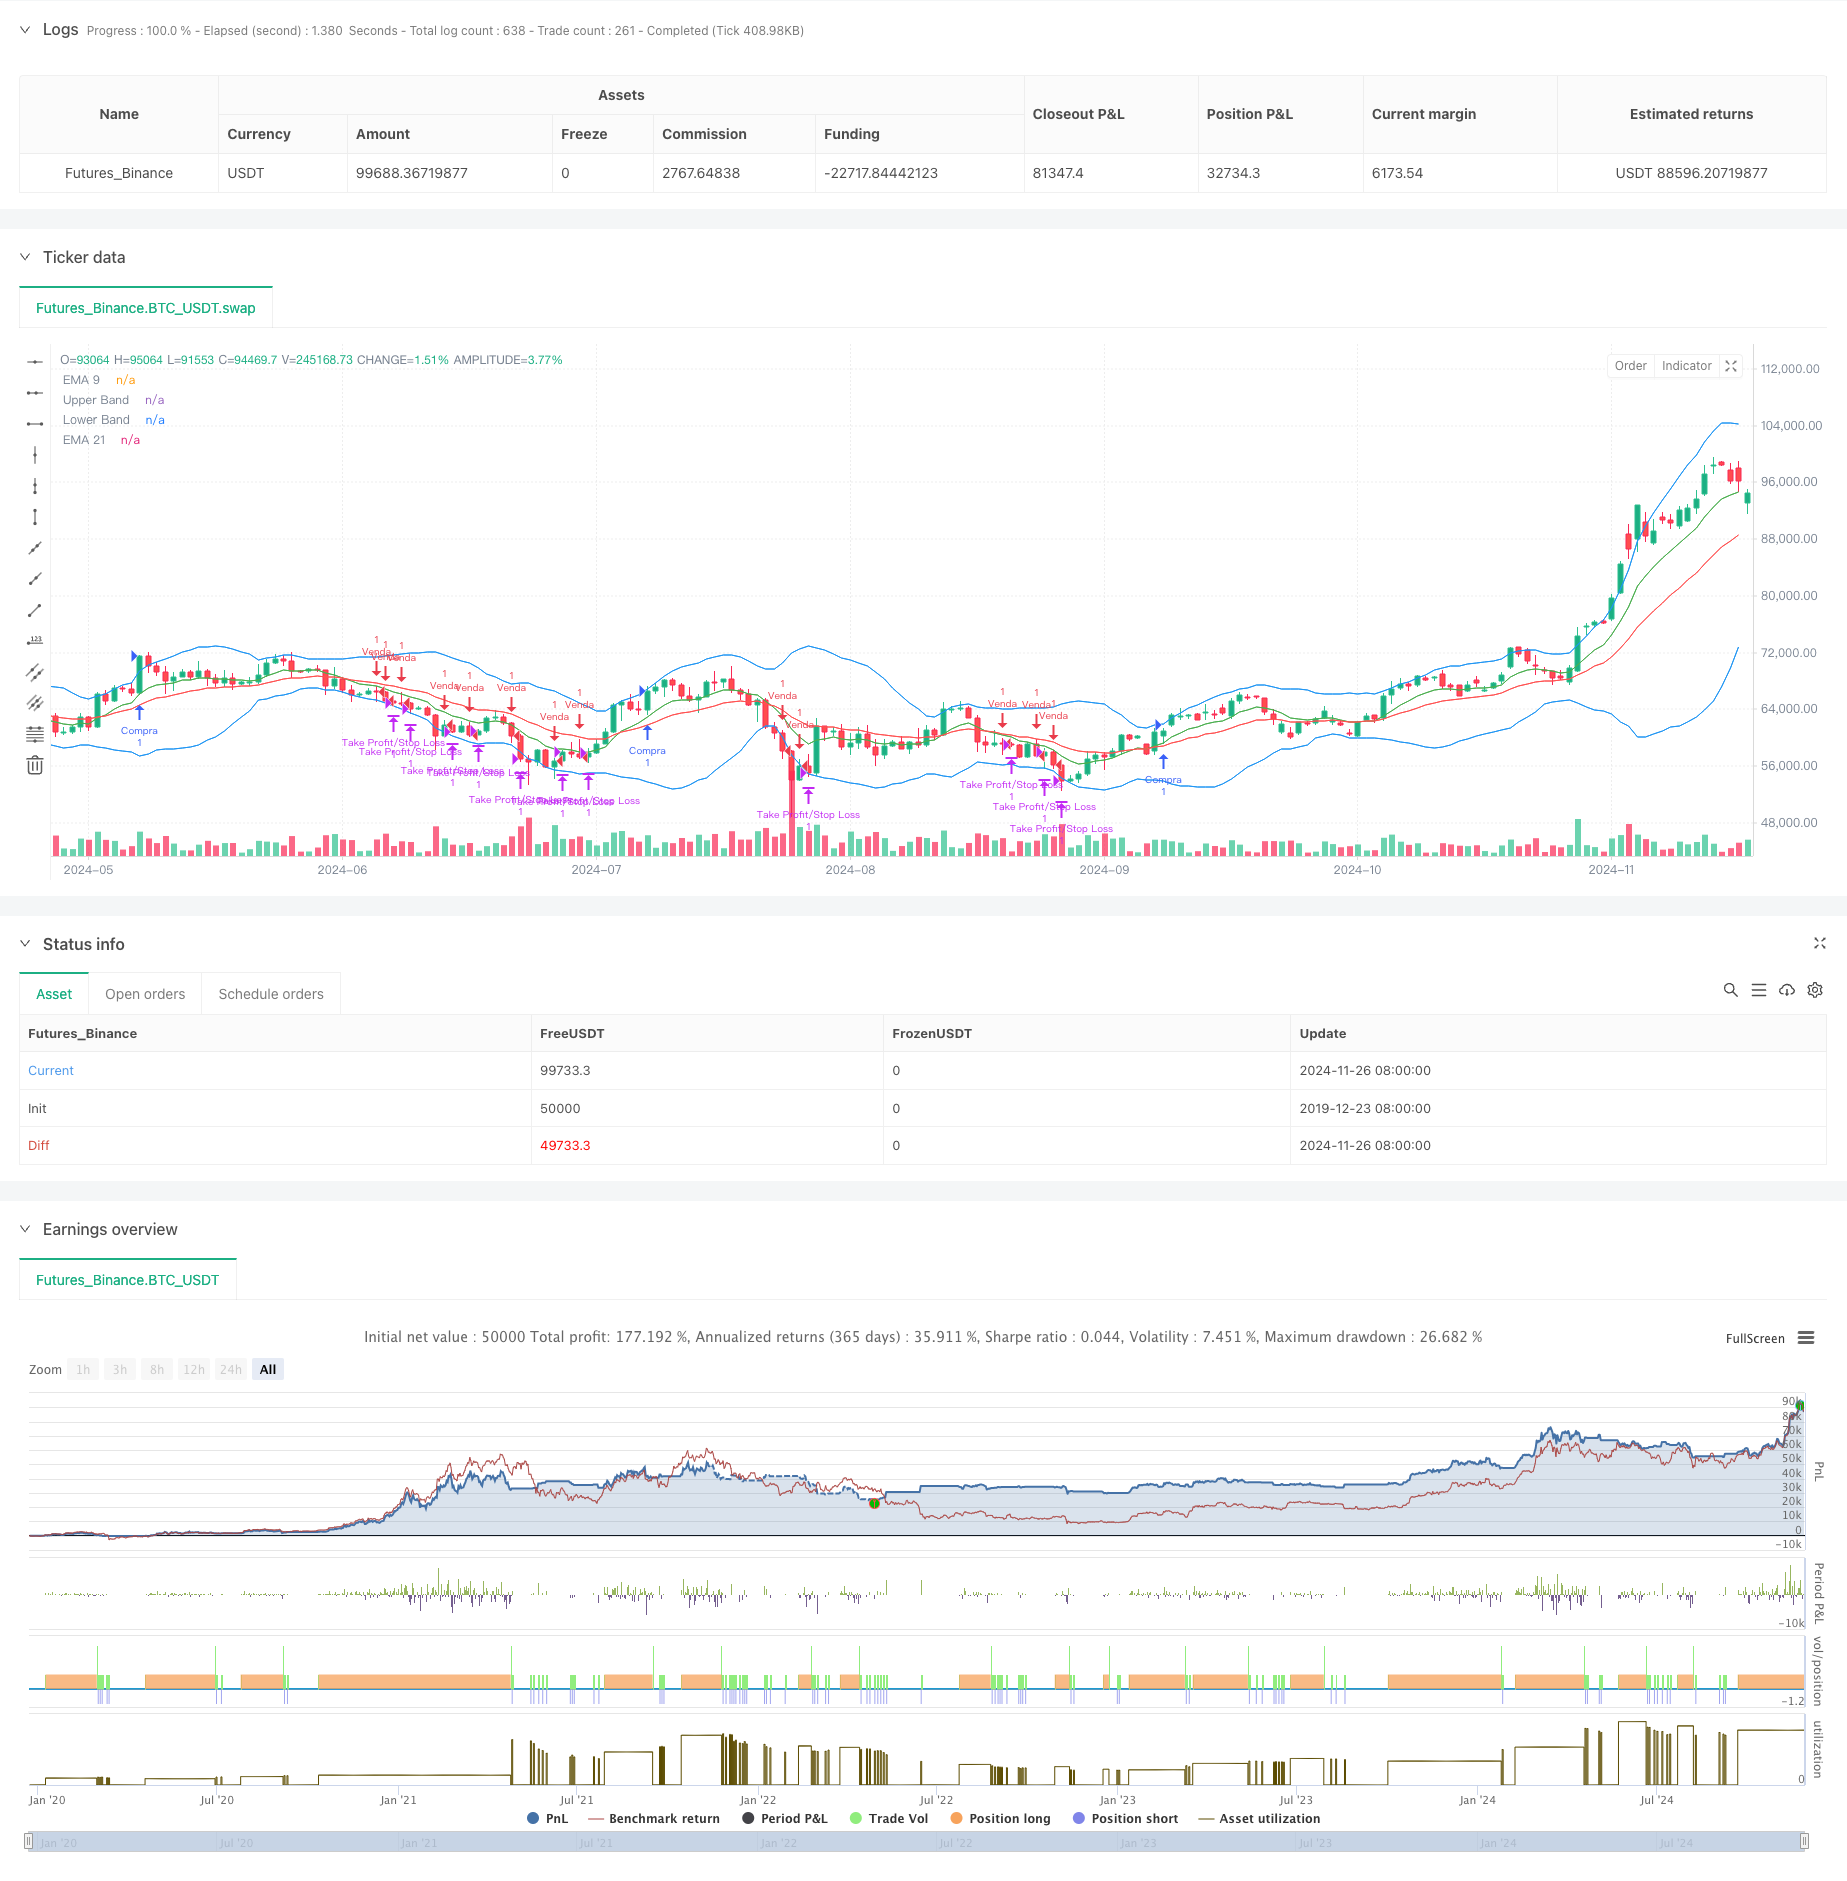
This strategy is a comprehensive trend-following system that combines multiple technical indicators and momentum analysis methods. The core of the strategy utilizes moving average crossovers, trend confirmation, and momentum indicators, combined with volatility control for risk management. The strategy shows good adaptability in markets with clear medium to long-term trends.
Strategy Principles
The strategy employs a multi-layered signal confirmation mechanism, including the following key elements:
- Uses 9-day and 21-day Exponential Moving Averages (EMA) as primary trend indicators
- Confirms trend momentum using MACD indicator, requiring alignment of MACD and signal lines
- Incorporates RSI for overbought/oversold conditions within defined ranges
- Monitors price volatility using Bollinger Bands
- Sets dynamic stop-loss and take-profit levels using ATR
- Confirms trades with volume analysis, requiring above 14-day average volume
The comprehensive trading conditions are: Long conditions: EMA9 crosses above EMA21, MACD line above signal line and positive, RSI between 40-70, price above EMA9 Short conditions: EMA9 crosses below EMA21, MACD line below signal line and negative, RSI between 30-60, price below EMA9
Strategy Advantages
- Multiple technical indicators improve signal reliability
- Dynamic stop-loss adjustment using ATR adapts to market volatility
- Volume confirmation enhances trade validity
- Reasonable RSI ranges prevent chasing extremes
- Bollinger Bands assist in volatility state assessment
- 2:1 profit-to-loss ratio provides favorable risk-reward profile
Strategy Risks
- Multiple indicators may cause signal lag, missing opportunities in fast markets
- May generate frequent false signals in ranging markets
- Fixed RSI ranges might limit trading opportunities in special market conditions
- Volume dependency may affect performance in low liquidity environments
- Stop-loss positions may be easily triggered in high volatility conditions
Optimization Directions
- Consider implementing adaptive parameter adjustment based on market conditions
- Add market state classification to use different parameter sets for different market conditions
- Consider adding trend strength indicators to improve trend identification accuracy
- Optimize stop-loss mechanism by implementing trailing stops or composite stop strategies
- Add volume filters to avoid trading in low liquidity conditions
- Consider adding time filters to avoid trading during unfavorable periods
Summary
This strategy constructs a relatively complete trend-following trading system through the combination of multiple technical indicators. The core advantages lie in signal reliability and rational risk control, though it faces challenges with lag and parameter optimization. Through the proposed optimization directions, the strategy has potential for improved performance in live trading. It is recommended to conduct thorough historical data testing and adjust parameters according to specific market characteristics before implementation.
/*backtest
start: 2019-12-23 08:00:00
end: 2024-11-27 08:00:00
period: 1d
basePeriod: 1d
exchanges: [{"eid":"Futures_Binance","currency":"BTC_USDT"}]
*/

//@version=5
strategy("Estratégia Cripto - 1D", shorttitle="Estratégia Cripto", overlay=true)

// Definição das Médias Móveis Exponenciais (EMA)
ema9 = ta.ema(close, 9)
ema21 = ta.ema(close, 21)

// Definição do MACD
[macdLine, signalLine, _] = ta.macd(close, 12, 26, 9)

// Definição do RSI
rsi = ta.rsi(close, 14)

// Volume médio
volMedio = ta.sma(volume, 14)

// Definição das Bollinger Bands
basis = ta.sma(close, 20)
dev = ta.stdev(close, 20)
upperBand = basis + 2 * dev
lowerBand = basis - 2 * dev

// Condições de Compra (Long)
longCondition = (ema9 > ema21) and (macdLine > signalLine) and (macdLine > 0) and (volume > volMedio) and (rsi > 40 and rsi < 70) and (close > ema9)
if (longCondition)
    strategy.entry("Compra", strategy.long)

// Condições de Venda (Short)
shortCondition = (ema9 < ema21) and (macdLine < signalLine) and (macdLine < 0) and (volume > volMedio) and (rsi < 60 and rsi > 30) and (close < ema9)
if (shortCondition)
    strategy.entry("Venda", strategy.short)

// Stop Loss e Take Profit
strategy.exit("Take Profit/Stop Loss", from_entry="Compra", loss=200, profit=400)
strategy.exit("Take Profit/Stop Loss", from_entry="Venda", loss=200, profit=400)

// Plotagem das Médias Móveis e Bollinger Bands
plot(ema9, color=color.green, title="EMA 9")
plot(ema21, color=color.red, title="EMA 21")
plot(upperBand, color=color.blue, title="Upper Band")
plot(lowerBand, color=color.blue, title="Lower Band")
- No Upper Wick Bullish Candle Breakout Strategy
- Multi-Indicator Dynamic Stop-Loss Momentum Trend Trading Strategy
- Multi-Indicator Adaptive Trading Strategy Based on RSI, MACD and Volume
- Multi-Factor Counter-Trend Trading Strategy
- Reverse Volatility Breakout Strategy
- EMA/MACD/RSI Crossover Strategy
- MACD Valley Detector Strategy
- Multi-Indicator High Leverage Short-Term Trading Strategy
- Multi-Indicator Trend Following Dynamic Risk Management Strategy
- Enhanced EMA Crossover Strategy with RSI/MACD/ATR
- Dual EMA Indicator Smart Crossing Trading System with Dynamic Stop-Loss and Take-Profit Strategy
- OBV-SMA Crossover with RSI Filter Multi-Dimensional Momentum Trading Strategy
- Dynamic Volatility Trading Strategy Based on Bollinger Bands and Candlestick Patterns
- Advanced Fair Value Gap Detection Strategy with Dynamic Risk Management and Fixed Take Profit
- Dynamic RSI Oversold Rebound Trading Strategy with Stop-Loss Optimization Model
- Dynamic ATR Stop-Loss RSI Oversold Rebound Quantitative Strategy
- Advanced Dual EMA Strategy with ATR Volatility Filter System
- Dual EMA Dynamic Zone Trend Following Strategy
- Multi-MA Crossover with RSI Dynamic Trailing Stop Loss Quantitative Trading Strategy
- Dual EMA Trend Momentum Trading Strategy
- Multi-Indicator Trend Breakout Quantitative Trading Strategy
- Momentum Indicator Oscillation Threshold Enhanced Trading Strategy
- Multi-Zone SMC Theory Based Intelligent Trend Following Strategy
- Dynamic Multi-Period Quantitative Trading Strategy Combining RSI and EMA
- Multi-Dimensional Technical Indicator Trend Following Quantitative Strategy
- Dual Moving Average Crossover Adaptive Parameter Trading Strategy
- Multi-Trend Following and Structure Breakout Strategy
- TRAMA Dual Moving Average Crossover Intelligent Quantitative Trading Strategy
- Multi-Timeframe RSI-EMA Momentum Trading Strategy with Position Scaling
- Multi-MA Trend Following with RSI Momentum Strategy