概述
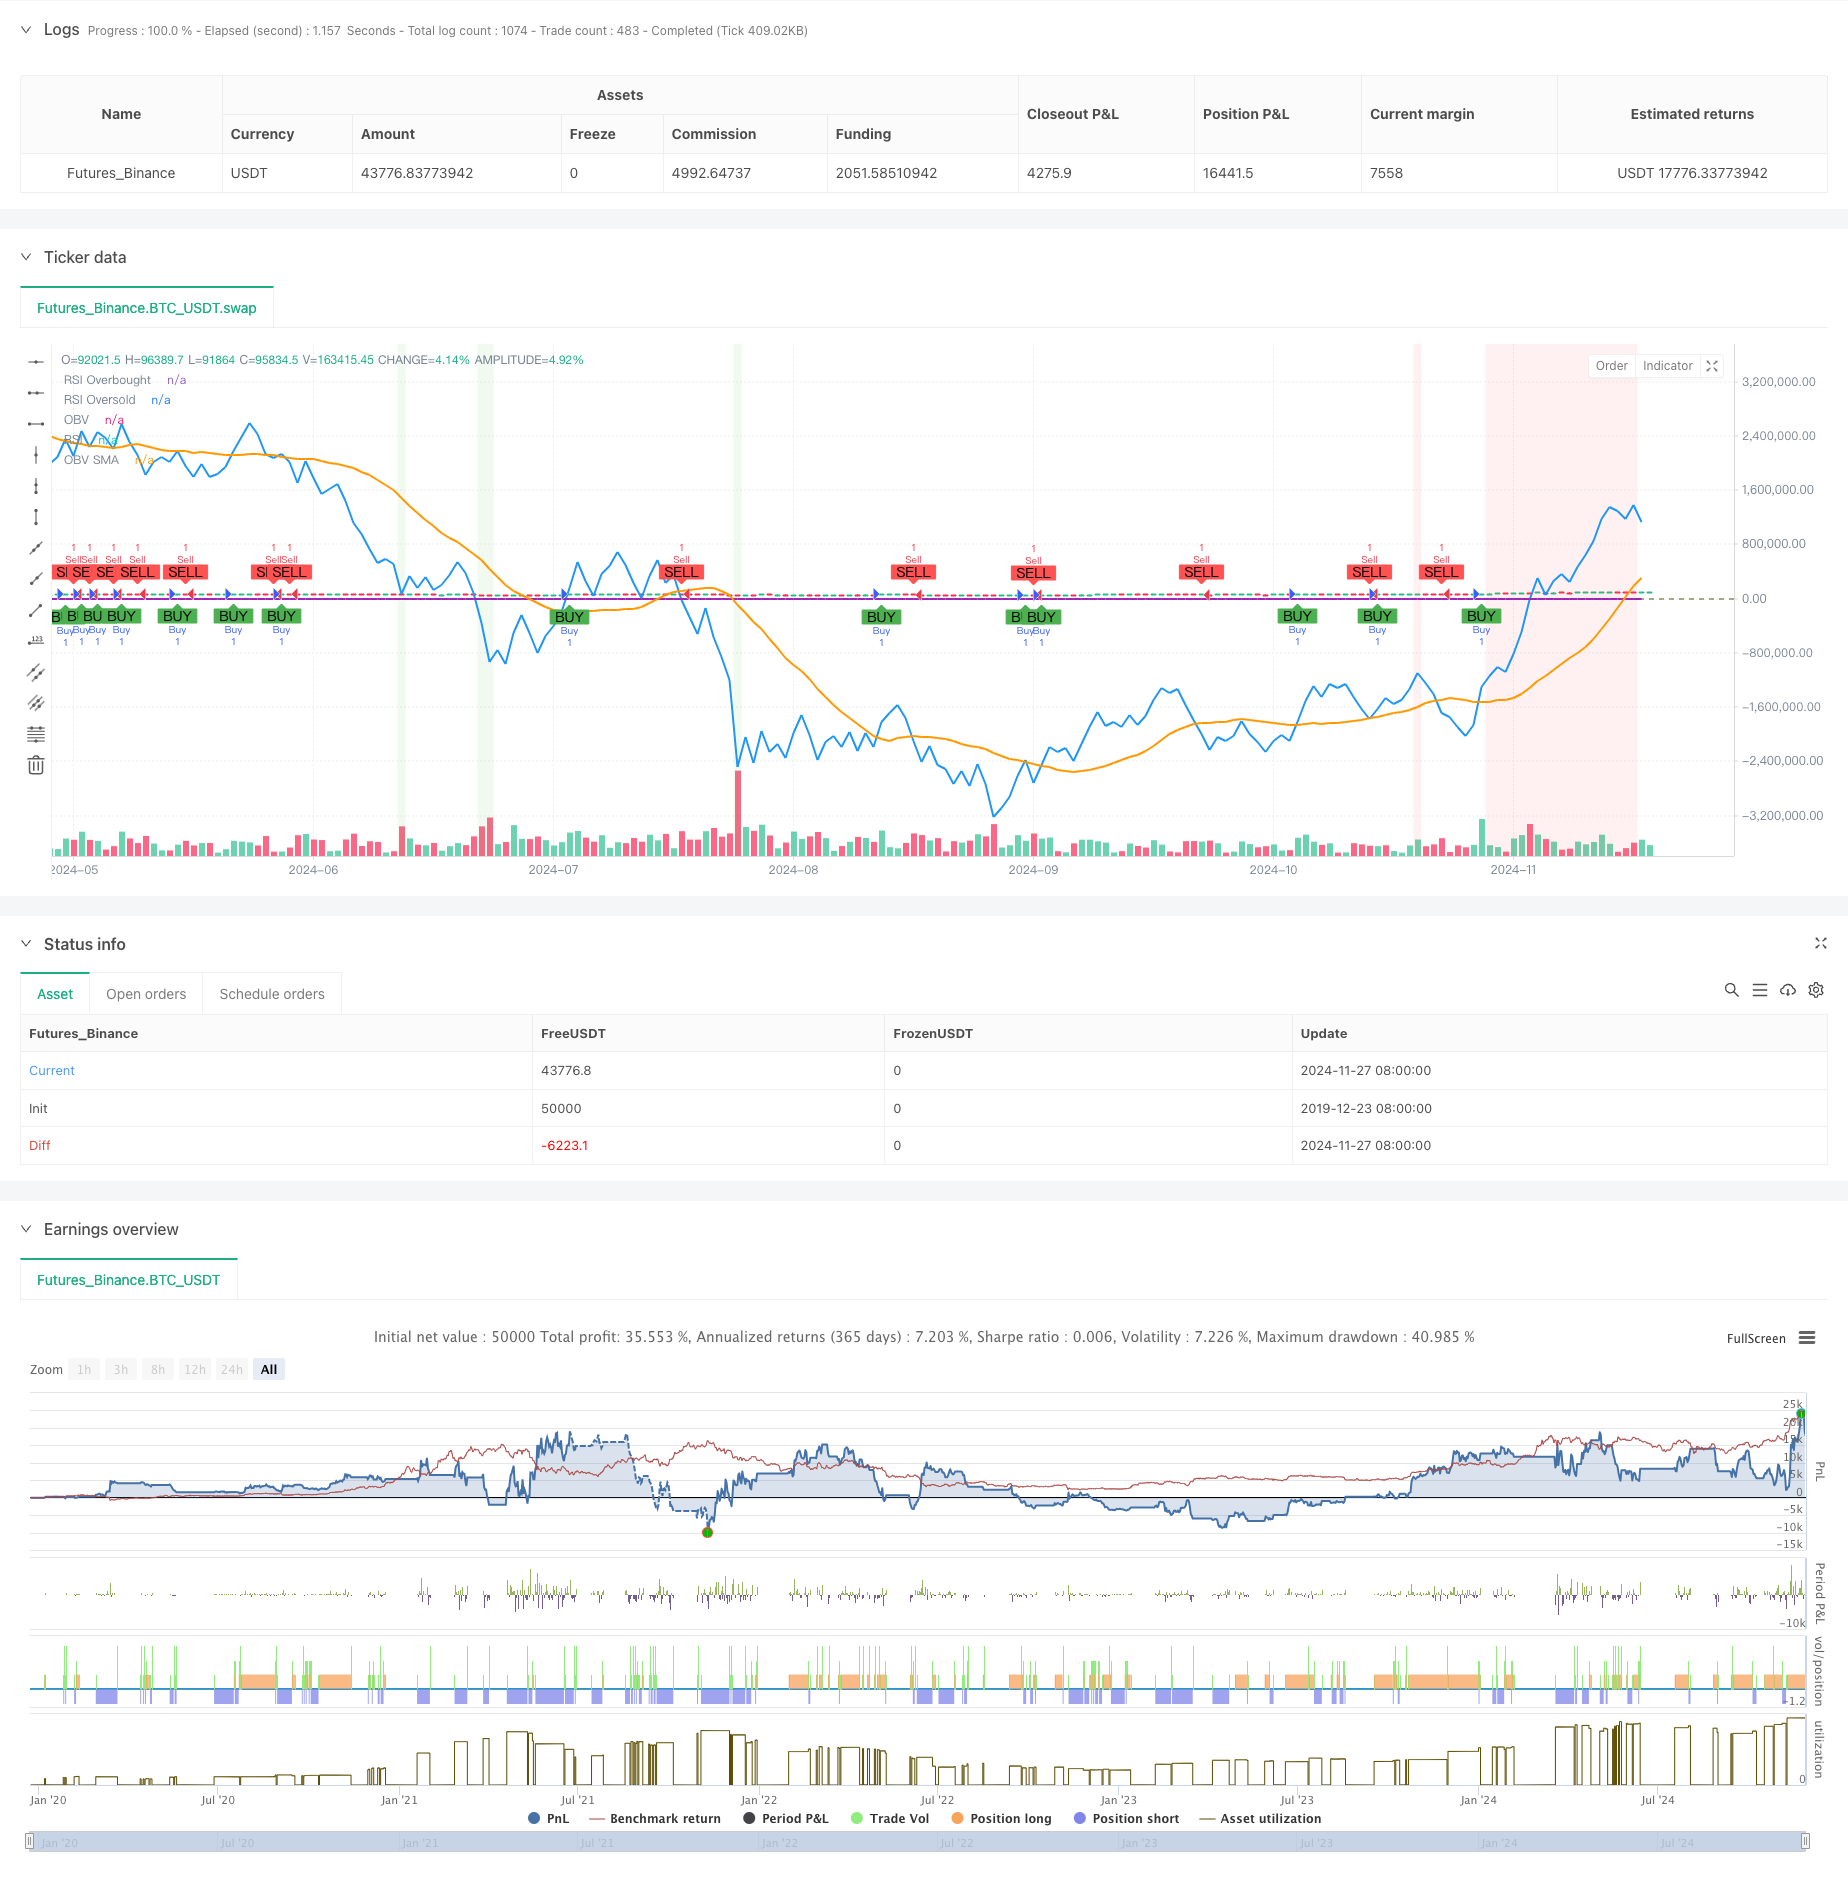
该策略是一个结合了成交量能量指标(OBV)、移动平均线(SMA)和相对强弱指标(RSI)的多维度动量交易系统。策略通过监测OBV与其移动平均线的交叉信号来捕捉市场动量,同时利用RSI指标进行过滤,有效避免过度追涨杀跌。策略还集成了百分比止损和获利了结机制,实现风险收益的平衡管理。
策略原理
策略的核心逻辑建立在三个维度上: 1. OBV指标用于衡量累积成交量的市场情绪,通过计算价格变动方向与成交量的累积来反映市场的买卖力量对比。 2. OBV的20周期移动平均线作为基准线,当OBV向上穿越移动平均线且RSI低于70时,触发做多信号;当OBV向下穿越移动平均线且RSI高于30时,触发做空信号。 3. RSI指标的引入作为过滤器,防止在过度超买超卖区域开仓,有效降低假突破风险。
策略采用固定百分比的止损(2%)和获利目标(4%),这种对称的风险管理框架有助于维持稳定的收益风险比。
策略优势
- 多维度信号确认机制降低了虚假信号的影响
- 将成交量、价格动量和超买超卖指标有机结合
- 清晰的风险管理框架,固定的止损和获利目标
- 策略逻辑简单明确,易于理解和维护
- 可视化设计优秀,交易信号和指标展示清晰
策略风险
- 在高波动市场中可能频繁触发止损
- 固定百分比的止损可能不适应所有市场环境
- RSI过滤条件可能错过一些重要的趋势起点
- OBV指标在低流动性环境下可能产生误导性信号
- 策略未考虑市场周期性特征的影响
策略优化方向
- 引入自适应的止损机制,如ATR止损或波动率调整的止损
- 增加趋势过滤器,如长周期均线判断主趋势方向
- 优化RSI参数,考虑动态调整超买超卖阈值
- 添加成交量筛选条件,确保信号在有效成交量支撑下触发
- 考虑引入时间过滤,避开高波动性时段
- 增加位置管理机制,实现仓位的动态调整
总结
这是一个设计合理的多维度动量交易策略,通过结合技术指标的优势,构建了一个完整的交易系统。策略的核心优势在于其多层面的信号确认机制和规范的风险管理框架。虽然存在一些潜在风险,但通过建议的优化方向,可以进一步提升策略的稳健性和适应性。策略的实用价值主要体现在其逻辑清晰、易于实施和维护等方面。建议交易者在实盘应用前,充分测试不同市场环境下的表现,并根据具体需求进行参数优化。
策略源码
/*backtest
start: 2019-12-23 08:00:00
end: 2024-11-28 00:00:00
period: 1d
basePeriod: 1d
exchanges: [{"eid":"Futures_Binance","currency":"BTC_USDT"}]
*/

//@version=5
strategy("OBV Strategy with SMA, RSI, SL and TP (Improved Visualization)", overlay=true)

// حساب OBV يدويًا
obv = ta.cum(math.sign(close - close[1]) * volume)

// إعداد المتوسط المتحرك البسيط لـ OBV
lengthOBV = input(20, title="OBV SMA Length")
obvSMA = ta.sma(obv, lengthOBV)

// إعداد مؤشر RSI
lengthRSI = input(14, title="RSI Length")
rsi = ta.rsi(close, lengthRSI)

// إعدادات وقف الخسارة وجني الأرباح
stopLossPerc = input(2.0, title="Stop Loss %") / 100   // 2% وقف خسارة
takeProfitPerc = input(4.0, title="Take Profit %") / 100   // 4% جني أرباح

// حساب مستوى وقف الخسارة وجني الأرباح
longStopLoss = close * (1 - stopLossPerc)
longTakeProfit = close * (1 + takeProfitPerc)
shortStopLoss = close * (1 + stopLossPerc)
shortTakeProfit = close * (1 - takeProfitPerc)

// إعداد شروط الشراء
longCondition = ta.crossover(obv, obvSMA) and rsi < 70
if (longCondition)
    strategy.entry("Buy", strategy.long)
    strategy.exit("Take Profit/Stop Loss", "Buy", stop=longStopLoss, limit=longTakeProfit)

// إعداد شروط البيع
shortCondition = ta.crossunder(obv, obvSMA) and rsi > 30
if (shortCondition)
    strategy.entry("Sell", strategy.short)
    strategy.exit("Take Profit/Stop Loss", "Sell", stop=shortStopLoss, limit=shortTakeProfit)

// رسم OBV والمؤشرات الأخرى على الرسم البياني
plot(obv, title="OBV", color=color.blue, linewidth=2) // رسم OBV بخط أزرق عريض
plot(obvSMA, title="OBV SMA", color=color.orange, linewidth=2) // رسم SMA بخط برتقالي

// رسم إشارات الشراء والبيع على الرسم البياني
plotshape(series=longCondition, title="Buy Signal", location=location.belowbar, color=color.green, style=shape.labelup, text="BUY")
plotshape(series=shortCondition, title="Sell Signal", location=location.abovebar, color=color.red, style=shape.labeldown, text="SELL")

// رسم RSI في نافذة منفصلة بوضوح أكبر
hline(70, "RSI Overbought", color=color.red, linestyle=hline.style_dashed)
hline(30, "RSI Oversold", color=color.green, linestyle=hline.style_dashed)
plot(rsi, title="RSI", color=color.purple, linewidth=2)

// إضافة منطقة RSI بالألوان
bgcolor(rsi > 70 ? color.new(color.red, 90) : rsi < 30 ? color.new(color.green, 90) : na)
相关推荐