概述
本文介绍了一种名为”多指标高杠杆短线交易策略”的量化交易方法。该策略旨在利用多个技术指标的组合,在短时间内捕捉市场波动,实现快速获利。策略核心是通过指数移动平均线(EMA)、相对强弱指标(RSI)、移动平均线趋同散度指标(MACD)以及平均真实范围(ATR)的协同作用,精准定位入场和出场时机,同时运用高杠杆放大收益。
策略原理
趋势识别:使用5周期和15周期的EMA交叉来判断短期趋势方向。当短期EMA上穿长期EMA时,视为上升趋势;反之则为下降趋势。
超买超卖判断:采用7周期的RSI指标,设定80为超买阈值,20为超卖阈值。RSI低于80时考虑做多,高于20时考虑做空,避免在极端区域开仓。
趋势确认:利用MACD指标(参数为6,13,5)进一步验证趋势强度。MACD线位于信号线上方支持做多,位于下方支持做空。
风险管理:基于5周期ATR设置动态止损和止盈水平,乘数为1.5倍,以适应市场波动性。
入场条件:
- 做多:短期EMA上穿长期EMA,RSI低于80,MACD线在信号线上方。
- 做空:短期EMA下穿长期EMA,RSI高于20,MACD线在信号线下方。
出场条件:达到基于ATR设置的动态止损或止盈位。
策略优势
多维度分析:结合趋势、动量和波动性指标,全面评估市场状况,提高交易准确性。
快速反应:短周期指标设置使策略能够迅速捕捉市场变化,适合短线交易。
风险控制:动态止损止盈机制根据市场波动自动调整,有效控制风险。
高收益潜力:利用高杠杆放大收益,适合风险承受能力较强的交易者。
自适应性:ATR based风险管理使策略能够适应不同市场环境。
清晰的交易信号:多指标协同提供明确的入场和出场信号,减少主观判断。
策略风险
高杠杆风险:虽然高杠杆可以放大收益,但同时也会放大损失,可能导致账户快速亏损。
假突破风险:短期EMA交叉可能产生假信号,导致频繁交易和不必要的手续费损失。
趋势反转风险:在强趋势市场中,RSI可能长期处于超买或超卖状态,影响策略表现。
市场波动风险:在剧烈波动行情下,ATR based止损可能过宽,增加单笔交易风险。
滑点风险:高频交易可能面临严重滑点,实际执行价格可能与预期有较大偏差。
系统风险:依赖多个指标的复杂策略可能因单个指标失效而整体表现下降。
策略优化方向
参数优化:可通过回测对EMA、RSI、MACD和ATR的参数进行细致调优,以适应不同市场周期。
增加过滤器:引入成交量、波动率等额外指标作为过滤条件,减少假信号。
时间过滤:加入交易时间窗口限制,避开波动较大或流动性不足的时段。
动态杠杆管理:根据市场波动性和账户净值动态调整杠杆率,平衡风险和收益。
趋势强度评估:整合趋势强度指标,如ADX,仅在强趋势市场开仓,提高胜率。
机器学习优化:利用机器学习算法动态调整指标权重,提高策略适应性。
多时间框架分析:结合更长周期指标确认大趋势,提高交易方向的准确性。
风险敞口管理:设置最大允许亏损金额和最大持仓数量,控制整体风险。
总结
“多指标高杠杆短线交易策略”是一种结合多种技术指标,旨在短期内捕捉市场机会的高频交易方法。通过EMA、RSI、MACD和ATR的协同作用,该策略能够快速识别趋势,确定入场和出场时机,同时利用高杠杆放大收益。尽管策略具有反应迅速、收益潜力大等优势,但也面临高杠杆风险、假突破风险等挑战。为了提高策略的稳定性和盈利能力,可以从参数优化、增加过滤条件、动态风险管理等方面进行改进。总的来说,这是一个适合经验丰富、风险承受能力强的交易者的复杂策略,在实际应用中需要谨慎管理风险,并根据市场变化不断优化调整。
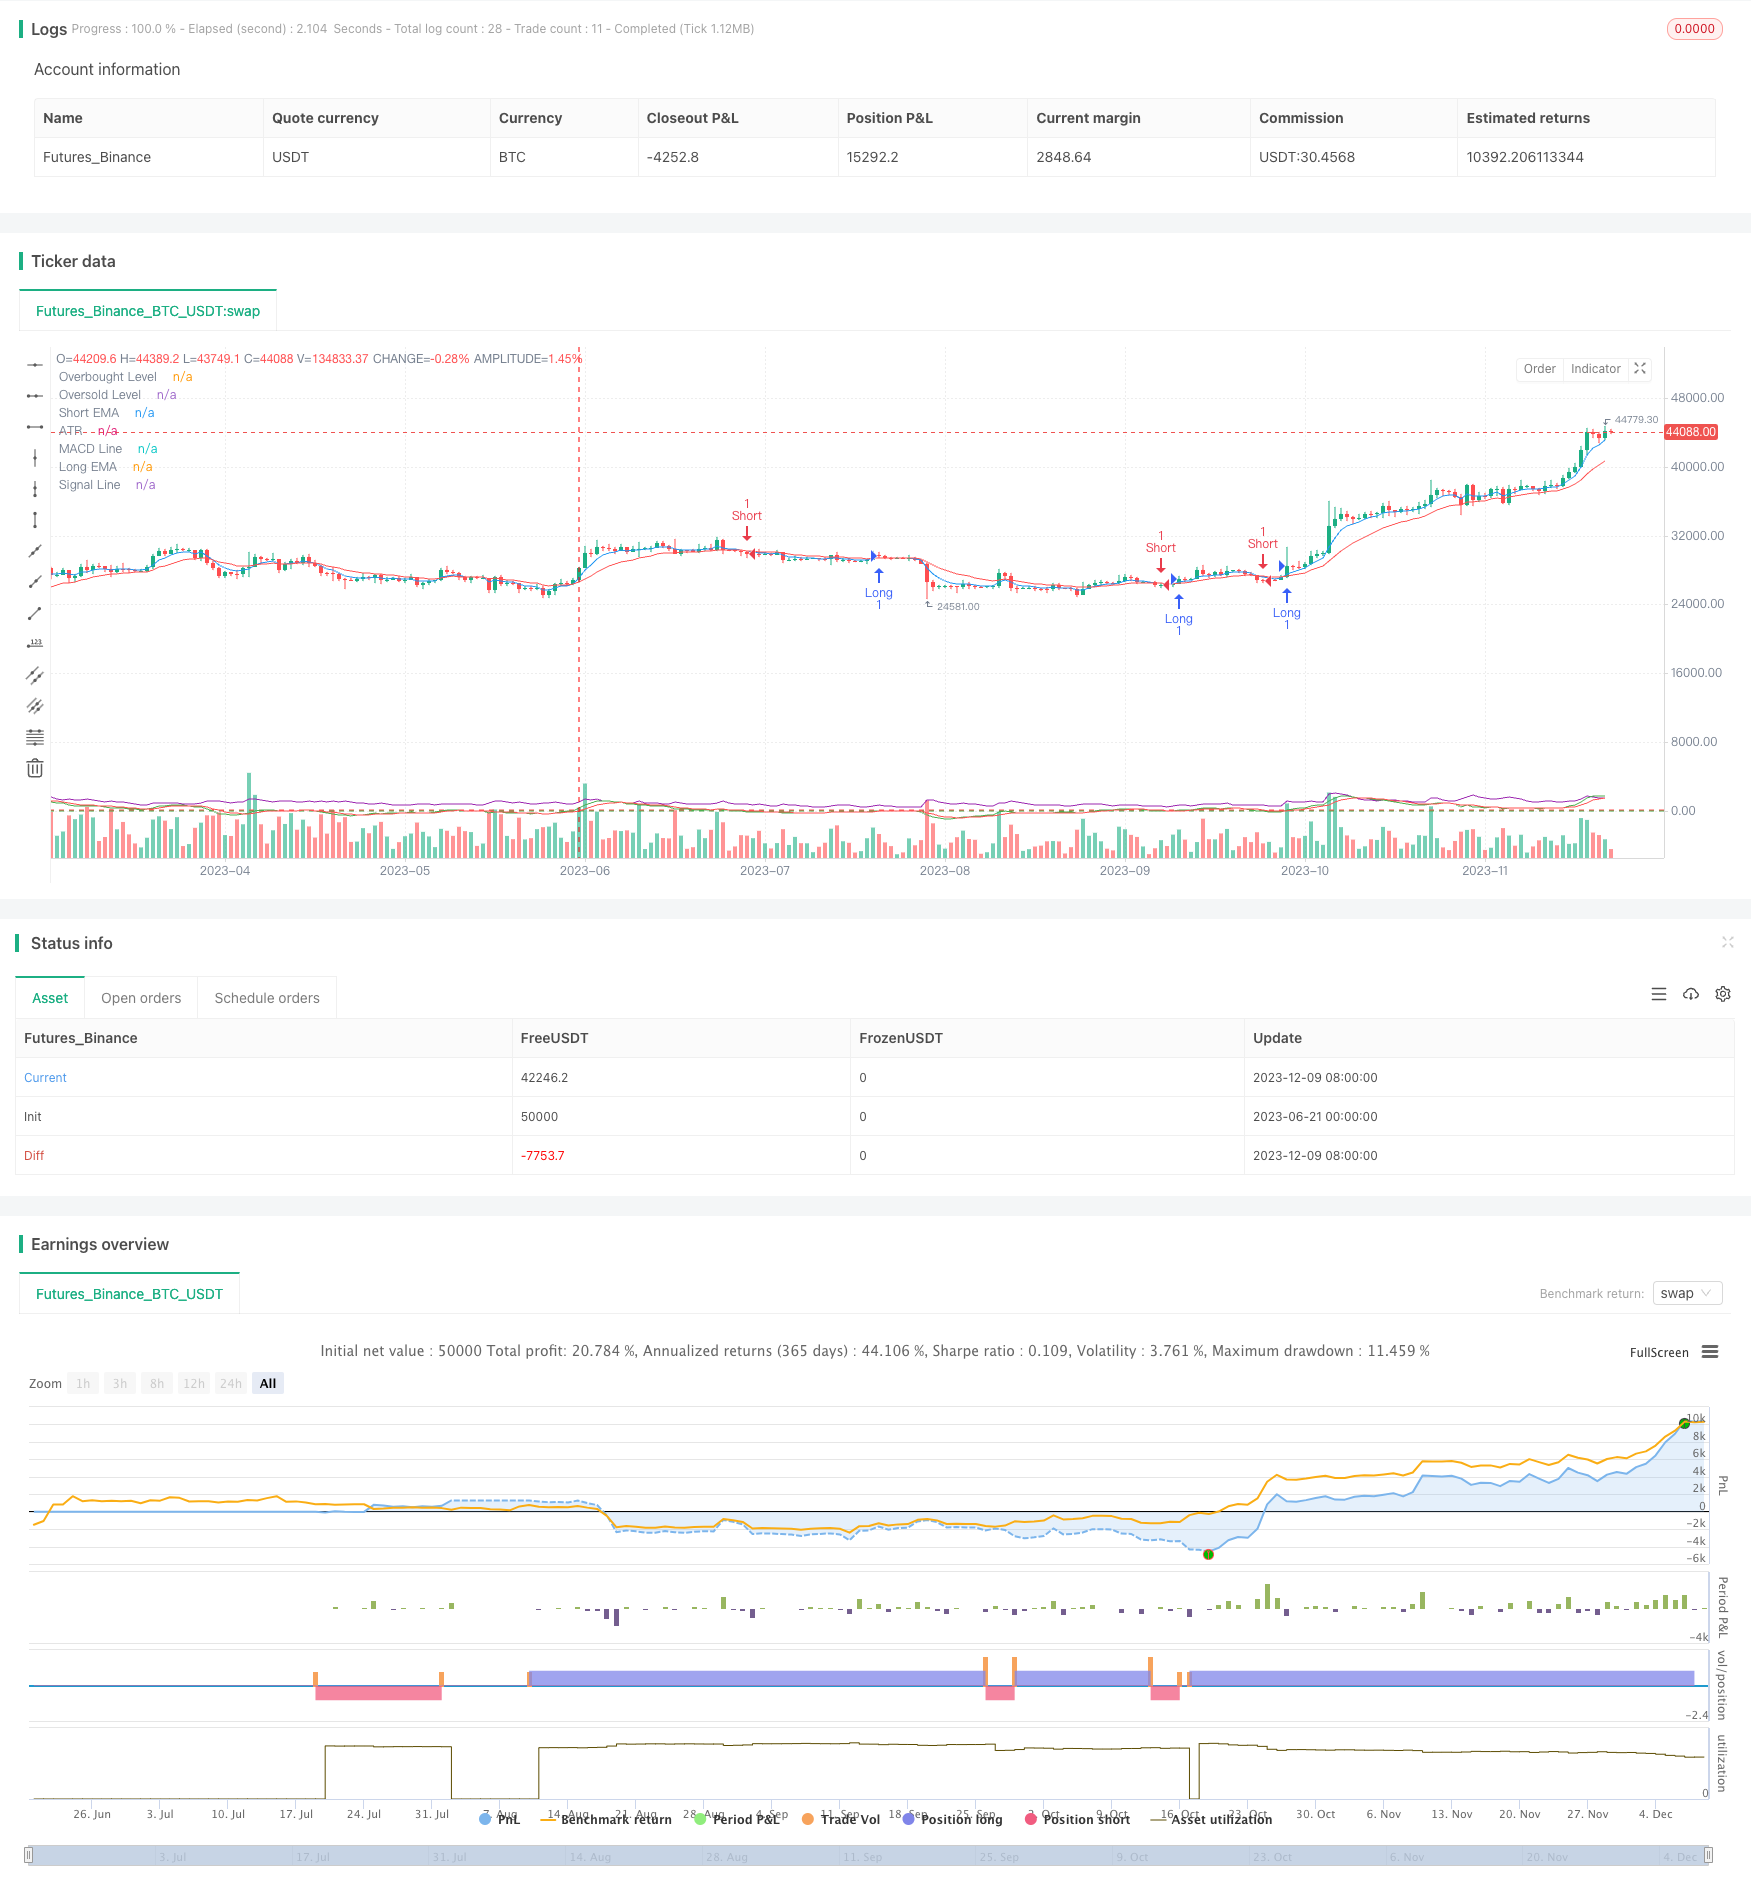
/*backtest
start: 2023-06-21 00:00:00
end: 2023-12-10 00:00:00
period: 1d
basePeriod: 1h
exchanges: [{"eid":"Futures_Binance","currency":"BTC_USDT"}]
*/

//@version=5
strategy("High Leverage Scalping Strategy", overlay=true)

// Parameters
shortEmaLength = input.int(5, minval=1, title="Short EMA Length")
longEmaLength = input.int(15, minval=1, title="Long EMA Length")
rsiLength = input.int(7, minval=1, title="RSI Length")
rsiOverbought = input.int(80, minval=50, maxval=100, title="RSI Overbought Level")
rsiOversold = input.int(20, minval=0, maxval=50, title="RSI Oversold Level")
macdFastLength = input.int(6, minval=1, title="MACD Fast Length")
macdSlowLength = input.int(13, minval=1, title="MACD Slow Length")
macdSignalSmoothing = input.int(5, minval=1, title="MACD Signal Smoothing")
atrLength = input.int(5, minval=1, title="ATR Length")
atrMultiplier = input.float(1.5, minval=0.1, title="ATR Multiplier")

// Indicators
shortEma = ta.ema(close, shortEmaLength)
longEma = ta.ema(close, longEmaLength)
rsi = ta.rsi(close, rsiLength)
[macdLine, signalLine, _] = ta.macd(close, macdFastLength, macdSlowLength, macdSignalSmoothing)
atr = ta.atr(atrLength)

// Conditions
longCondition = ta.crossover(shortEma, longEma) and rsi < rsiOverbought and macdLine > signalLine
shortCondition = ta.crossunder(shortEma, longEma) and rsi > rsiOversold and macdLine < signalLine

// Dynamic stop-loss and take-profit levels
longStopLoss = close - (atr * atrMultiplier)
longTakeProfit = close + (atr * atrMultiplier)
shortStopLoss = close + (atr * atrMultiplier)
shortTakeProfit = close - (atr * atrMultiplier)

// Long Entry
if (longCondition)
    strategy.entry("Long", strategy.long)
    strategy.exit("Take Profit/Stop Loss", from_entry="Long", limit=longTakeProfit, stop=longStopLoss)

// Short Entry
if (shortCondition)
    strategy.entry("Short", strategy.short)
    strategy.exit("Take Profit/Stop Loss", from_entry="Short", limit=shortTakeProfit, stop=shortStopLoss)

// Plotting
plot(shortEma, color=color.blue, title="Short EMA")
plot(longEma, color=color.red, title="Long EMA")
hline(rsiOverbought, "Overbought Level", color=color.red)
hline(rsiOversold, "Oversold Level", color=color.green)
plot(macdLine, color=color.green, title="MACD Line")
plot(signalLine, color=color.red, title="Signal Line")
plot(atr, color=color.purple, title="ATR")