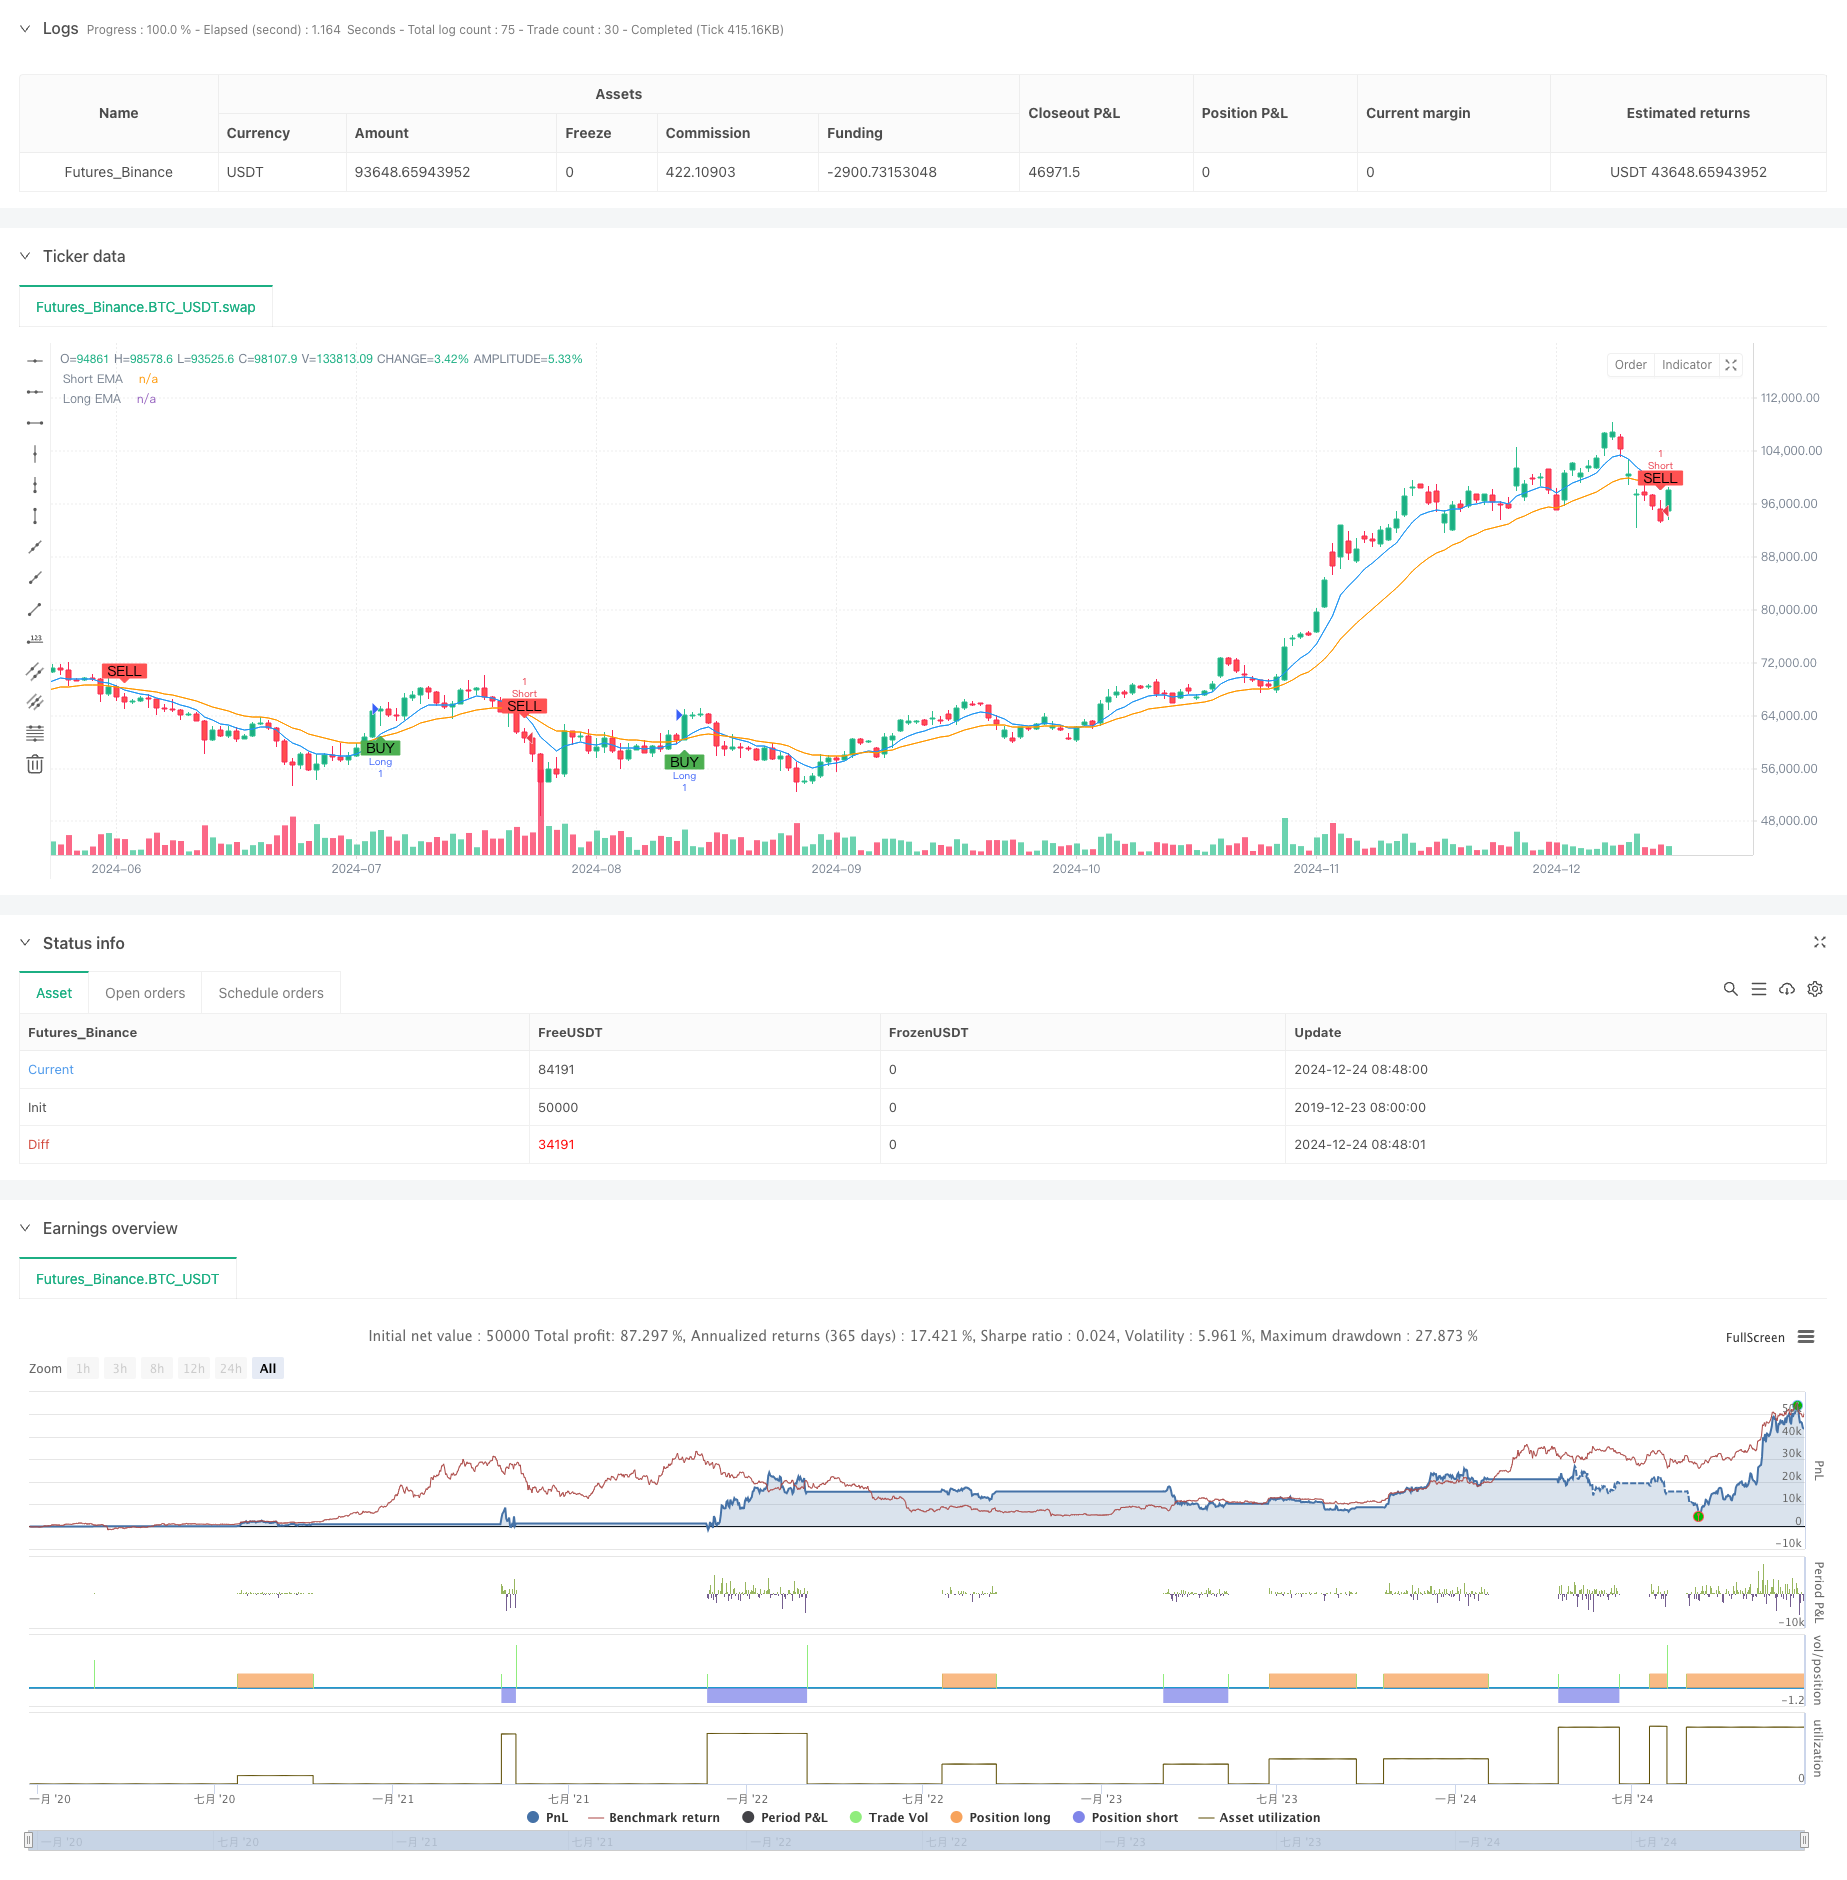
Multi-Indicator High-Frequency Range Trading Strategy
Author: ChaoZhang, Date: 2024-12-27 14:18:57Tags: RSIEMAVOLN-BARTPSL

Overview
This is a high-frequency range trading strategy based on multiple technical indicators. The strategy combines signals from Exponential Moving Average (EMA), Relative Strength Index (RSI), volume analysis, and N-period price pattern recognition to identify optimal entry points in short-term trading. It implements strict risk management through predefined take-profit and stop-loss levels.
Strategy Principle
The core logic relies on multi-dimensional signal confirmation:
- Uses 8-period and 21-period EMA crossovers to determine short-term trend direction
- Validates market momentum using 14-period RSI, with RSI>50 confirming bullish momentum and RSI<50 confirming bearish momentum
- Compares current volume with 20-period average volume to ensure market activity
- Identifies potential reversal patterns by comparing the last 5 candles with the previous 10 candles Trading signals are generated only when all conditions align. Long positions are opened at market price for bullish signals, and short positions for bearish signals. Risk is controlled through 1.5% take-profit and 0.7% stop-loss levels.
Strategy Advantages
- Multi-dimensional signal cross-validation significantly reduces false signals
- Combines benefits of trend-following and momentum trading for improved adaptability
- Volume confirmation prevents trading during illiquid periods
- N-period pattern recognition enables timely detection of market reversals
- Reasonable profit/loss ratios for effective risk control
- Clear logic facilitates continuous optimization and parameter adjustment
Strategy Risks
- Frequent stop-losses may occur in highly volatile markets
- Sensitive to market maker quote delays
- Relatively few opportunities when all indicators align
- Consecutive losses possible in ranging markets Mitigation measures:
- Dynamically adjust profit/loss ratios based on market volatility
- Trade during periods of high liquidity
- Optimize parameters to balance signal quantity and quality
- Implement trailing stops to improve profitability
Optimization Directions
- Introduce adaptive parameter adjustment mechanisms for automatic optimization based on market conditions
- Add volatility filters to pause trading in excessive volatility
- Develop more sophisticated N-period pattern recognition algorithms
- Implement position sizing based on account equity
- Add multiple timeframe confirmation for increased signal reliability
Summary
The strategy identifies quality trading opportunities in high-frequency trading through multi-dimensional technical indicator collaboration. It considers trend, momentum, and volume characteristics while ensuring stability through strict risk control. While there is room for optimization, it represents a logically sound and practical trading approach.
/*backtest
start: 2019-12-23 08:00:00
end: 2024-12-25 08:00:00
period: 1d
basePeriod: 1d
exchanges: [{"eid":"Futures_Binance","currency":"BTC_USDT"}]
*/

//@version=5
strategy("XRP/USD Scalping Strategy with Alerts", overlay=true)

// Input parameters
ema_short = input.int(8, title="Short EMA Period")
ema_long = input.int(21, title="Long EMA Period")
rsiperiod = input.int(14, title="RSI Period")
vol_lookback = input.int(20, title="Volume Lookback Period")
n_bars = input.int(5, title="N-Bars Detection")

take_profit_perc = input.float(1.5, title="Take Profit (%)") / 100
stop_loss_perc = input.float(0.7, title="Stop Loss (%)") / 100

// Indicators
ema_short_line = ta.ema(close, ema_short)
ema_long_line = ta.ema(close, ema_long)
rsi = ta.rsi(close, rsiperiod)
avg_volume = ta.sma(volume, vol_lookback)

// N-bar detection function
bullish_nbars = ta.lowest(low, n_bars) > ta.lowest(low, n_bars * 2)
bearish_nbars = ta.highest(high, n_bars) < ta.highest(high, n_bars * 2)

// Entry conditions
long_condition = ta.crossover(ema_short_line, ema_long_line) and rsi > 50 and volume > avg_volume and bullish_nbars
short_condition = ta.crossunder(ema_short_line, ema_long_line) and rsi < 50 and volume > avg_volume and bearish_nbars

// Plot signals
plotshape(long_condition, title="Buy Signal", location=location.belowbar, color=color.green, style=shape.labelup, text="BUY")
plotshape(short_condition, title="Sell Signal", location=location.abovebar, color=color.red, style=shape.labeldown, text="SELL")

// Strategy execution
if (long_condition)
    strategy.entry("Long", strategy.long)
    strategy.exit("TP/SL", from_entry="Long", limit=close * (1 + take_profit_perc), stop=close * (1 - stop_loss_perc))

if (short_condition)
    strategy.entry("Short", strategy.short)
    strategy.exit("TP/SL", from_entry="Short", limit=close * (1 - take_profit_perc), stop=close * (1 + stop_loss_perc))

// Plot EMA lines
plot(ema_short_line, color=color.blue, title="Short EMA")
plot(ema_long_line, color=color.orange, title="Long EMA")

// Create alerts
alertcondition(long_condition, title="Buy Alert", message="Buy Signal: EMA Crossover, RSI > 50, Volume > Avg, Bullish N-Bars")
alertcondition(short_condition, title="Sell Alert", message="Sell Signal: EMA Crossunder, RSI < 50, Volume > Avg, Bearish N-Bars")
- Multi-RSI-EMA Momentum Hedging Strategy with Position Scaling
- Multi-Timeframe RSI Oversold Reversal Strategy
- Dual EMA Crossover with RSI Momentum Enhanced Trading Strategy
- Adaptive Trend Following Strategy with Dynamic Drawdown Control System
- Multi-Indicator Dynamic Trading Strategy
- Multi-Trend Following and Structure Breakout Strategy
- Multi-EMA Crossover with Momentum Indicators Trading Strategy
- Enhanced Multi-Indicator Trend Reversal Intelligence Strategy
- KRK ADA 1H Stochastic Slow Strategy with More Entries and AI
- Multi-Indicator Crossover Momentum Trading Strategy with Optimized Take Profit and Stop Loss System
- Multi-EMA Dynamic Trend Capture Quantitative Trading Strategy
- Dynamic Moving Average and Bollinger Bands Cross Strategy with Fixed Stop-Loss Optimization Model
- RSI Trend Reversal Trading Strategy with ATR Stop Loss and Trading Zone Control
- Multi-EMA Cross with Oscillator and Dynamic Support/Resistance Trading Strategy
- Multi-SMA and Stochastic Combined Trend Following Trading Strategy
- Adaptive Dynamic Trading Strategy Based on Standardized Logarithmic Returns
- Multi-Indicator Cross-Trend Following Trading Strategy: Quantitative Analysis Based on Stochastic RSI and Moving Average System
- Multi-Indicator Trend Crossing Strategy: Bull Market Support Band Trading System
- Multi-Level Dynamic MACD Trend Following Strategy with 52-Week High/Low Extension Analysis System
- Dual EMA RSI Momentum Trend Reversal Trading System - A Momentum Breakthrough Strategy Based on EMA and RSI Crossover
- Dynamic Trendline Breakout Reversal Trading Strategy
- Multi-Indicator Dynamic Trend Following Strategy Based on EMA and SMA
- Enhanced Fibonacci Trend Following and Risk Management Strategy
- Adaptive Multi-State EMA-RSI Momentum Strategy with Choppiness Index Filter System
- Intelligent Exponential Moving Average Trading Strategy Optimization System
- AI-Powered Volatility Price System Divergence Trading Strategy
- Multi-EMA Trend-Following Swing Trading Strategy with ATR-Based Risk Management
- Enhanced Mean Reversion Strategy with Bollinger Bands and RSI Integration
- Multi-Period RSI Divergence with Support/Resistance Quantitative Trading Strategy
- Adaptive Trend Following Strategy with Dynamic Drawdown Control System