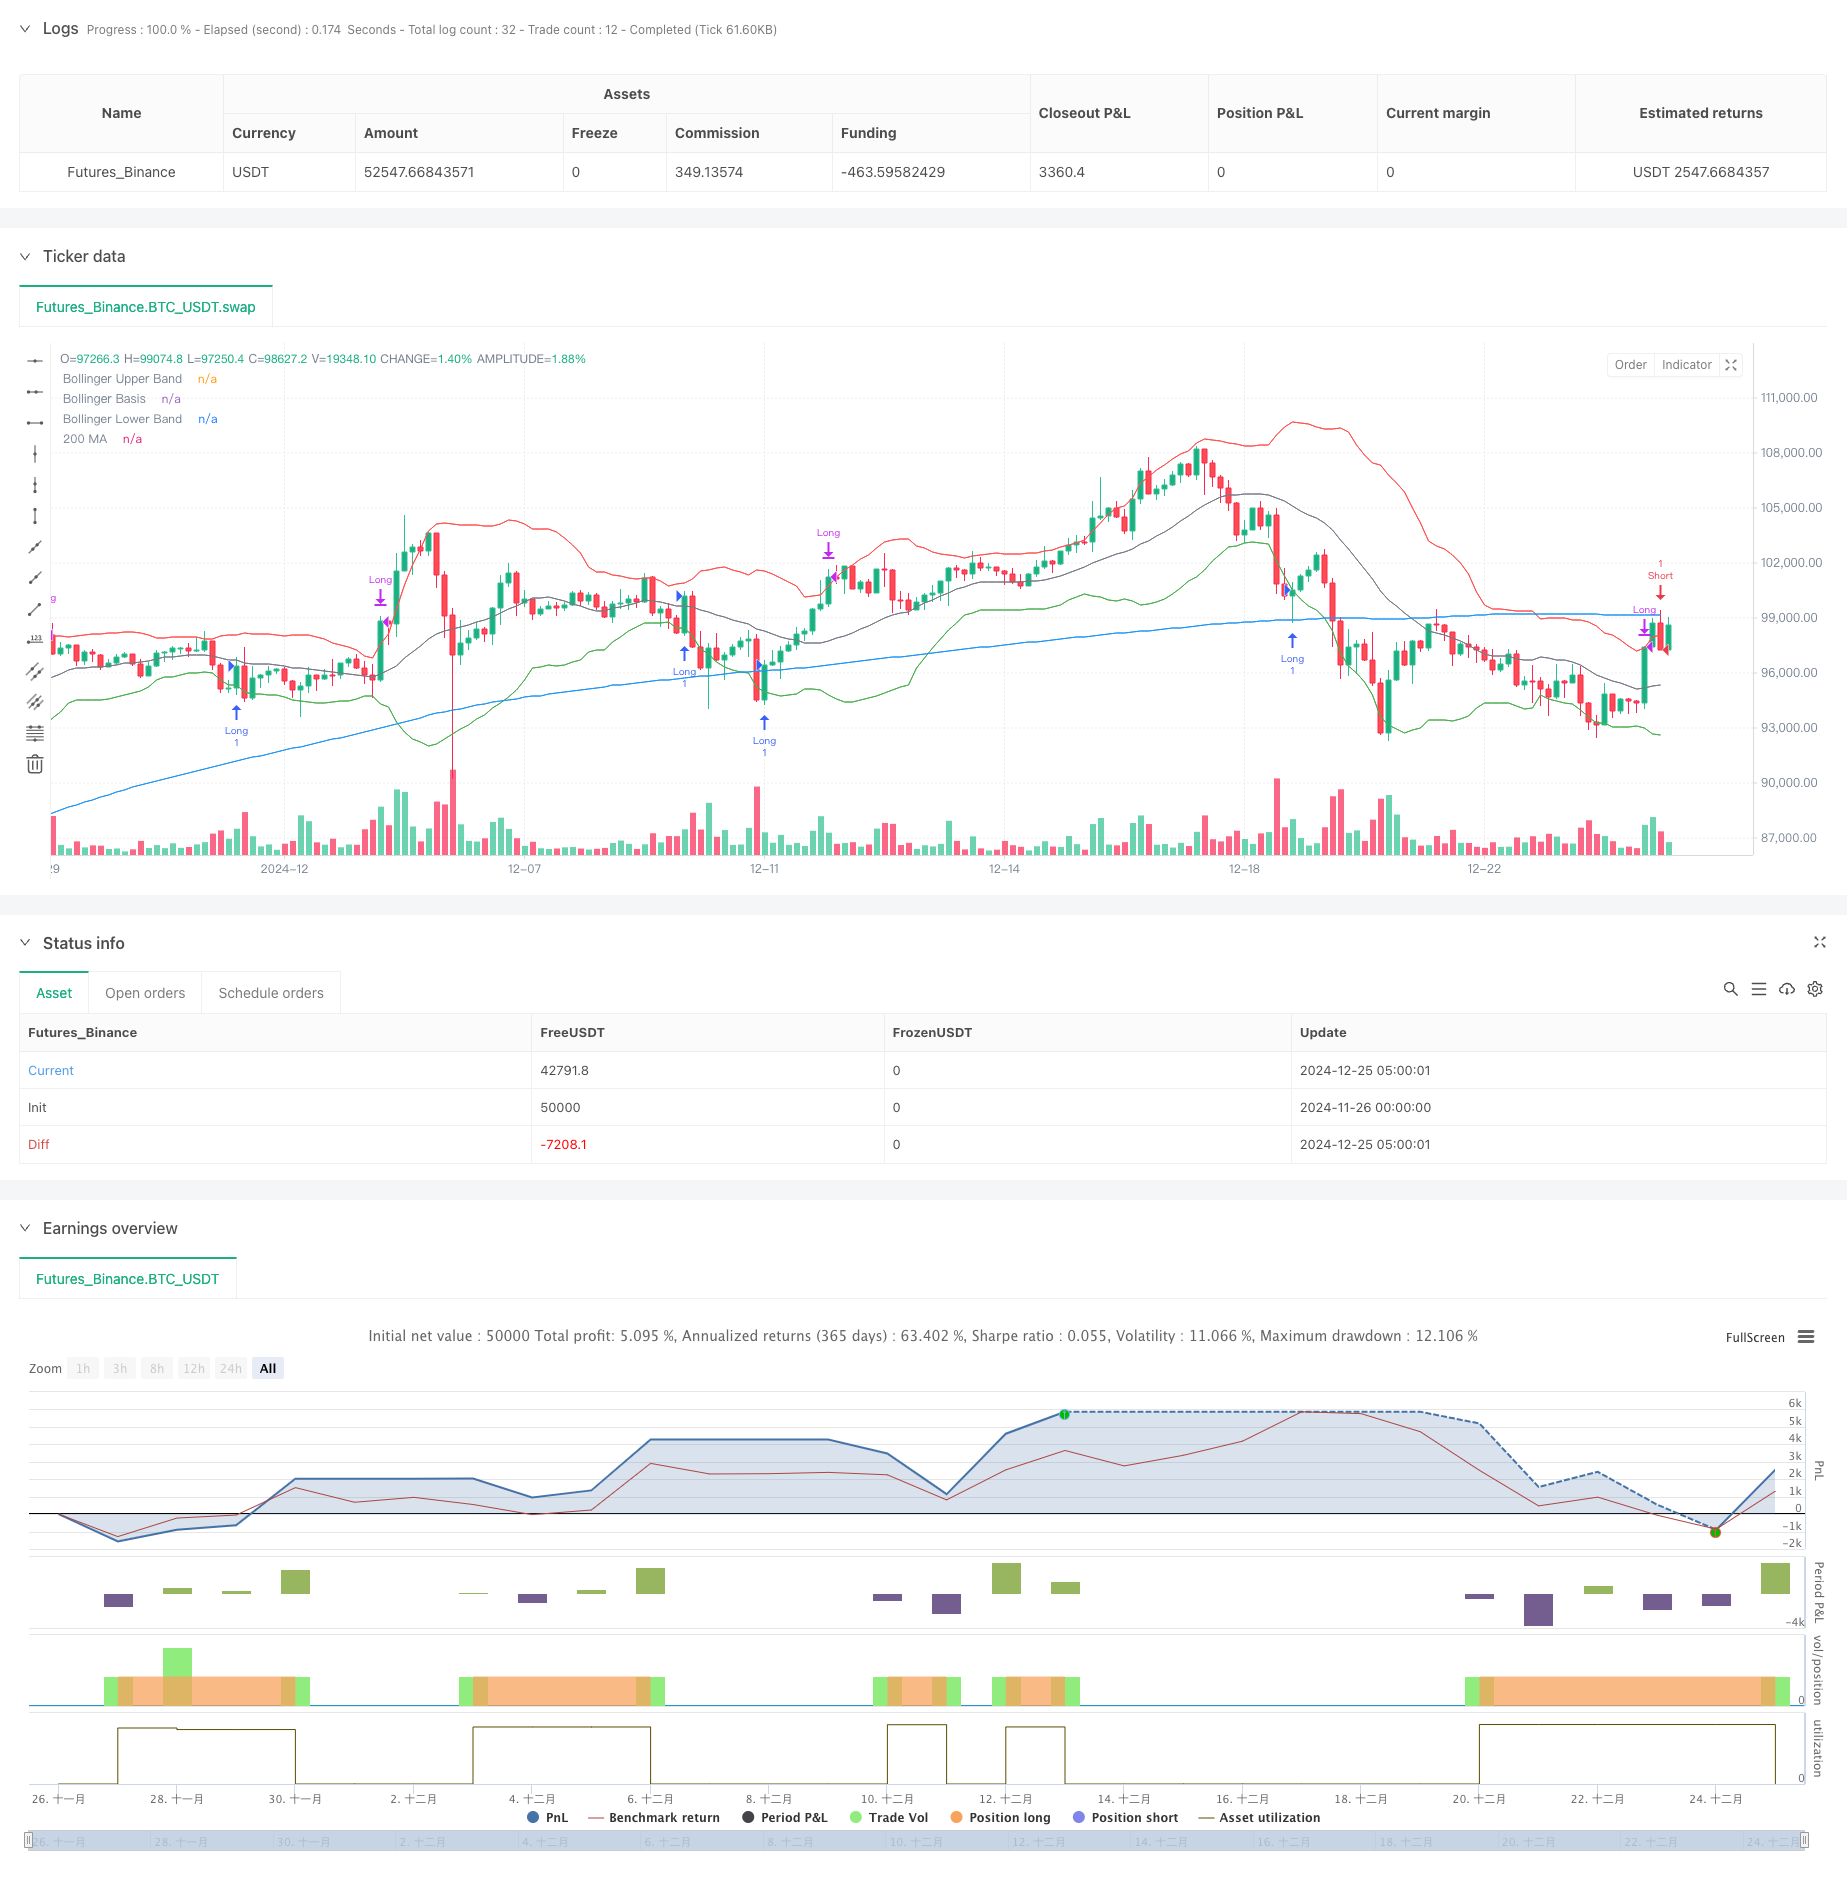
Dynamic Moving Average and Bollinger Bands Cross Strategy with Fixed Stop-Loss Optimization Model
Author: ChaoZhang, Date: 2024-12-27 14:57:38Tags: MABBSMAATRSLTP

Overview
This strategy is a trend-following trading system that combines Moving Average (MA) and Bollinger Bands indicators. It identifies market trends by analyzing price relationships with the 200-period moving average and Bollinger Bands position, while incorporating a fixed percentage stop-loss mechanism for risk control. The strategy employs a 2.86% position management, compatible with 35x leverage, demonstrating prudent fund management principles.
Strategy Principles
The core logic of the strategy is based on the following key elements:
- Uses 200-period moving average as the primary trend indicator
- Combines 20-period Bollinger Bands’ upper and lower channels for volatility range assessment
- Opens long positions when:
- Price is above the 200 MA
- Bollinger Bands middle band is above 200 MA
- Price crosses above the lower Bollinger Band
- Opens short positions when:
- Price is below the 200 MA
- Bollinger Bands middle band is below 200 MA
- Price crosses below the upper Bollinger Band
- Implements 3% fixed stop-loss percentage for risk control
- Closes long positions at upper Bollinger Band, shorts at lower band
Strategy Advantages
- Strong Trend Following Capability
- Effectively identifies long-term trends using 200 MA
- Bollinger Bands assist in detecting medium-short term trend changes
- Comprehensive Risk Control
- Fixed stop-loss mechanism effectively controls per-trade risk
- Dynamic take-profit design enhances profit opportunities
- Flexible Parameter Optimization
- MA period and Bollinger Bands parameters adjustable to market characteristics
- Stop-loss percentage adjustable to risk tolerance
- High Systematization
- Clear trading signals without subjective judgment
- Suitable for automated trading execution
Strategy Risks
- Sideways Market Risk
- False breakout signals may occur frequently in ranging markets
- Recommended to trade only in clear trending markets
- Slippage Risk
- Significant slippage possible during volatile periods
- Recommend setting reasonable slippage protection
- Systematic Risk
- Market events may cause stop-loss failure
- Recommend combining with other risk control measures
- Parameter Optimization Risk
- Over-optimization may lead to overfitting
- Recommend backtesting across different timeframes
Strategy Optimization Directions
- Dynamic Stop-Loss Optimization
- Introduce ATR indicator for dynamic stop-loss adjustment
- Adjust stop-loss percentage based on market volatility
- Entry Signal Optimization
- Add volume confirmation indicators
- Implement trend strength filters
- Position Management Optimization
- Implement dynamic position sizing
- Adjust leverage based on market volatility
- Trading Timing Optimization
- Add market sentiment indicators
- Implement time filters
Summary
This strategy builds a complete trading system by combining classic technical indicators, demonstrating good trend capture ability and risk control effects. The core advantages lie in its high systematization and parameter adjustability, while achieving effective risk control through fixed stop-loss mechanisms. Although performance may be suboptimal in ranging markets, implementing the suggested optimizations can further enhance strategy stability and profitability. Traders are advised to consider market conditions when implementing live trading and adjust parameters according to their risk tolerance.
/*backtest
start: 2024-11-26 00:00:00
end: 2024-12-25 08:00:00
period: 3h
basePeriod: 3h
exchanges: [{"eid":"Futures_Binance","currency":"BTC_USDT"}]
*/


//@version=5
strategy("MA 200 and Bollinger Bands Strategy", overlay=true) // 2.86% for 35x leverage

// inputs
ma_length = input(200, title="MA Length")
bb_length = input(20, title="Bollinger Bands Length")
bb_mult = input(2.0, title="Bollinger Bands Multiplier")

// calculations
ma_200 = ta.sma(close, ma_length)
bb_basis = ta.sma(close, bb_length)
bb_upper = bb_basis + (ta.stdev(close, bb_length) * bb_mult)
bb_lower = bb_basis - (ta.stdev(close, bb_length) * bb_mult)

// plot indicators
plot(ma_200, color=color.blue, title="200 MA")
plot(bb_upper, color=color.red, title="Bollinger Upper Band")
plot(bb_basis, color=color.gray, title="Bollinger Basis")
plot(bb_lower, color=color.green, title="Bollinger Lower Band")

// strategy logic
long_condition = close > ma_200 and bb_basis > ma_200 and ta.crossover(close, bb_lower)
short_condition = close < ma_200 and bb_basis < ma_200 and ta.crossunder(close, bb_upper)

// fixed stop loss percentage
fixed_stop_loss_percent = 3.0 / 100.0

if (long_condition)
    strategy.entry("Long", strategy.long)
    strategy.exit("Stop Long", "Long", stop=strategy.position_avg_price * (1 - fixed_stop_loss_percent))

if (short_condition)
    strategy.entry("Short", strategy.short)
    strategy.exit("Stop Short", "Short", stop=strategy.position_avg_price * (1 + fixed_stop_loss_percent))

// take profit conditions
close_long_condition = close >= bb_upper
close_short_condition = close <= bb_lower

if (close_long_condition)
    strategy.close("Long")

if (close_short_condition)
    strategy.close("Short")
- Multi-Indicator Filtered Trading Strategy with Bollinger Bands and Woodies CCI
- Dual Moving Average Crossover Strategy with Dynamic Risk Management
- Adaptive Moving Average Crossover with Trailing Stop-Loss Strategy
- High Win Rate Trend Mean Reversion Trading Strategy
- Multi-Step ATR Trading Strategy with Dynamic Profit Taking
- Enhanced Mean Reversion Strategy with MACD-ATR Implementation
- Adaptive Quantitative Trading Strategy with Dual Moving Average Crossover and Take Profit/Stop Loss
- Dynamic Moving Average Crossover Trend Following Strategy with Adaptive Risk Management
- Dynamic Trailing Stop Dual Target Moving Average Crossover Strategy
- Trend Breakout Trading System with Moving Average (TBMA Strategy)
- Cross-boundary Dynamic Range Quantitative Trading Strategy Based on Bollinger Bands
- Momentum-Based SMI Crossover Signal Adaptive Prediction Strategy
- Multiple Moving Average Crossover Signal Enhanced Trading Strategy
- Multi-Indicator Filtered Trading Strategy with Bollinger Bands and Woodies CCI
- Dynamic Moving Average Trend Following with RSI Confirmation Trading Strategy
- Dynamic Multi-Period Exponential Moving Average Cross Strategy with Pullback Optimization System
- Dynamic Moving Average Crossover Trend Following Strategy with Adaptive Risk Management
- Adaptive Trading Strategy Based on Stochastic RSI Dual-Line Crossover
- Multi-Level Institutional Order Flow Quantitative Strategy with Dynamic Position Scaling System
- Multi-EMA Dynamic Trend Capture Quantitative Trading Strategy
- RSI Trend Reversal Trading Strategy with ATR Stop Loss and Trading Zone Control
- Multi-EMA Cross with Oscillator and Dynamic Support/Resistance Trading Strategy
- Multi-SMA and Stochastic Combined Trend Following Trading Strategy
- Adaptive Dynamic Trading Strategy Based on Standardized Logarithmic Returns
- Multi-Indicator Cross-Trend Following Trading Strategy: Quantitative Analysis Based on Stochastic RSI and Moving Average System
- Multi-Indicator Trend Crossing Strategy: Bull Market Support Band Trading System
- Multi-Level Dynamic MACD Trend Following Strategy with 52-Week High/Low Extension Analysis System
- Dual EMA RSI Momentum Trend Reversal Trading System - A Momentum Breakthrough Strategy Based on EMA and RSI Crossover
- Multi-Indicator High-Frequency Range Trading Strategy
- Dynamic Trendline Breakout Reversal Trading Strategy