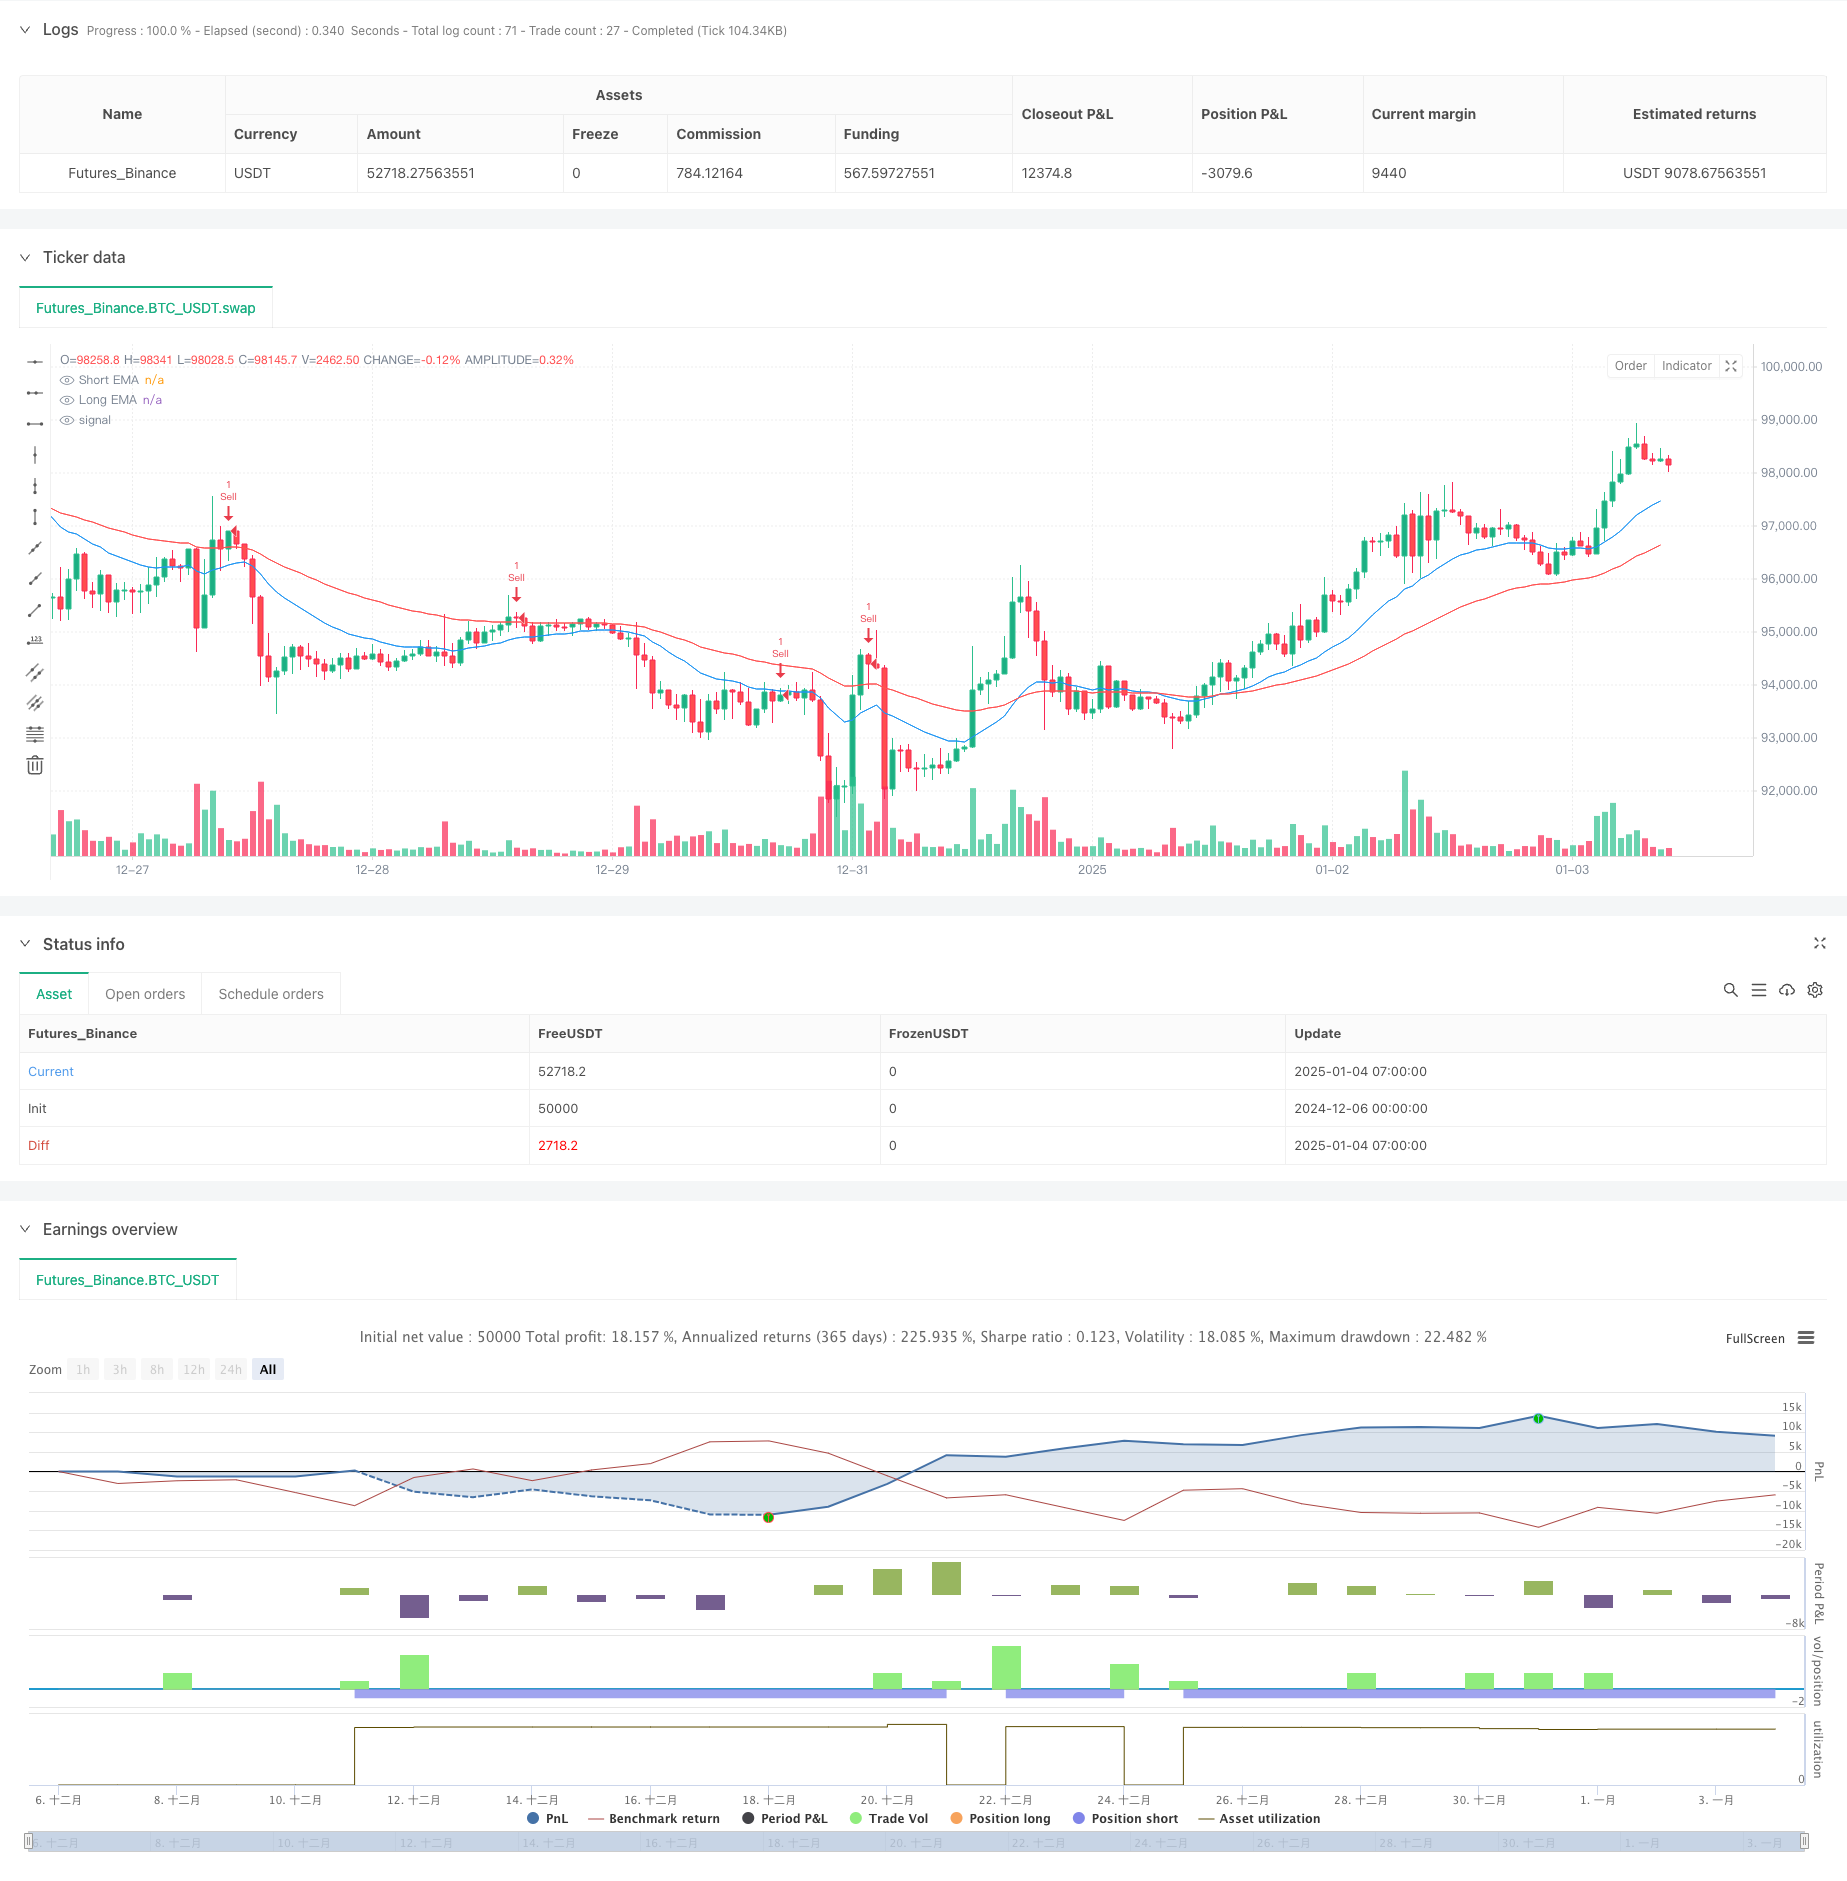
Dual EMA Stochastic Oscillator System: A Quantitative Trading Model Combining Trend Following and Momentum
Author: ChaoZhang, Date: 2025-01-06 11:48:55Tags: EMASTORSIMARRTPSL

Overview
This strategy is a quantitative trading system that combines dual Exponential Moving Averages (EMA) with the Stochastic Oscillator. It utilizes 20-period and 50-period EMAs to determine market trends while using the Stochastic Oscillator to identify trading opportunities in overbought and oversold zones, achieving a perfect blend of trend and momentum. The strategy implements strict risk management measures, including fixed stop-loss and profit targets.
Strategy Principles
The core logic consists of three components: trend identification, entry timing, and risk control. Trend identification primarily relies on the relative position of fast EMA (20-period) and slow EMA (50-period), where an uptrend is confirmed when the fast line is above the slow line, and vice versa. Entry signals are confirmed by Stochastic Oscillator crossovers, seeking high-probability trades in overbought and oversold zones. Risk control employs fixed percentage stop-losses and 2:1 profit targets, ensuring clear risk-reward ratios for each trade.
Strategy Advantages
- Combines trend following and momentum indicators for consistent profits in trending markets
- Implements scientific money management through fixed risk percentages
- Indicator parameters can be flexibly adjusted for different markets
- Clear and easy-to-understand strategy logic
- Applicable across multiple timeframes
Strategy Risks
- May generate frequent false signals in ranging markets
- EMA parameter selection significantly impacts strategy performance
- Stochastic overbought/oversold levels need market-specific adjustment
- Stop-loss levels may be too wide in volatile markets
- Trading costs need to be considered for strategy profitability
Optimization Directions
- Add volume indicators for additional confirmation
- Incorporate ATR for dynamic stop-loss adjustment
- Develop adaptive parameter adjustment based on market volatility
- Implement trend strength filters to reduce false signals
- Develop adaptive profit target calculation methods
Summary
This strategy establishes a complete trading system by combining trend and momentum indicators. Its core strengths lie in its clear logical framework and strict risk control, though practical application requires parameter optimization based on specific market conditions. Through continuous improvement and optimization, the strategy has the potential to maintain stable performance across various market environments.
/*backtest
start: 2024-12-06 00:00:00
end: 2025-01-04 08:00:00
period: 1h
basePeriod: 1h
exchanges: [{"eid":"Futures_Binance","currency":"BTC_USDT"}]
*/

//@version=6
strategy("EMA + Stochastic Strategy", overlay=true)

// Inputs for EMA
emaShortLength = input.int(20, title="Short EMA Length")
emaLongLength = input.int(50, title="Long EMA Length")

// Inputs for Stochastic
stochK = input.int(14, title="Stochastic %K Length")
stochD = input.int(3, title="Stochastic %D Smoothing")
stochOverbought = input.int(85, title="Stochastic Overbought Level")
stochOversold = input.int(15, title="Stochastic Oversold Level")

// Inputs for Risk Management
riskRewardRatio = input.float(2.0, title="Risk-Reward Ratio")
stopLossPercent = input.float(1.0, title="Stop Loss (%)")

// EMA Calculation
emaShort = ta.ema(close, emaShortLength)
emaLong = ta.ema(close, emaLongLength)

// Stochastic Calculation
k = ta.stoch(high, low, close, stochK)
d = ta.sma(k, stochD)

// Trend Condition
isUptrend = emaShort > emaLong
isDowntrend = emaShort < emaLong

// Stochastic Signals
stochBuyCrossover = ta.crossover(k, d)
stochBuySignal = k < stochOversold and stochBuyCrossover
stochSellCrossunder = ta.crossunder(k, d)
stochSellSignal = k > stochOverbought and stochSellCrossunder

// Entry Signals
buySignal = isUptrend and stochBuySignal
sellSignal = isDowntrend and stochSellSignal

// Strategy Execution
if buySignal
    strategy.entry("Buy", strategy.long)
    stopLoss = close * (1 - stopLossPercent / 100)
    takeProfit = close * (1 + stopLossPercent * riskRewardRatio / 100)
    strategy.exit("Take Profit/Stop Loss", from_entry="Buy", stop=stopLoss, limit=takeProfit)

if sellSignal
    strategy.entry("Sell", strategy.short)
    stopLoss = close * (1 + stopLossPercent / 100)
    takeProfit = close * (1 - stopLossPercent * riskRewardRatio / 100)
    strategy.exit("Take Profit/Stop Loss", from_entry="Sell", stop=stopLoss, limit=takeProfit)

// Plotting
plot(emaShort, color=color.blue, title="Short EMA")
plot(emaLong, color=color.red, title="Long EMA")
- Multi-Indicator Crossover Momentum Trading Strategy with Optimized Take Profit and Stop Loss System
- Multi-dimensional Gold Friday Anomaly Strategy Analysis System
- Dual Timeframe Stochastic Momentum Trading Strategy
- Advanced EMA Crossover Strategy: Adaptive Trading System with Dynamic Stop-Loss and Take-Profit Targets
- Automated Quantitative Trading System with Dual EMA Crossover and Risk Management
- Multi-RSI-EMA Momentum Hedging Strategy with Position Scaling
- Multi-Timeframe RSI Oversold Reversal Strategy
- Dual EMA Crossover with RSI Momentum Enhanced Trading Strategy
- Risk-Reward Ratio Optimized Strategy Based on Moving Average Crossover
- Dynamic Risk-Managed Exponential Moving Average Crossover Strategy
- RSI and Bollinger Bands Synergistic Swing Trading Strategy
- Momentum Trend Ichimoku Cloud Trading Strategy
- Multi-Moving Average Supertrend with Bollinger Breakout Trading Strategy
- Multi-Indicator Dynamic Moving Average Crossover Quantitative Strategy
- Dual-Period Moving Average with RSI Momentum and Volume Trend Following Strategy
- RSI Trend Breakthrough and Momentum Enhancement Trading Strategy
- Dual EMA Crossover Dynamic Trend Following Quantitative Trading Strategy
- Adaptive Trend Flow Multiple Filter Trading Strategy
- Dynamic Dual Technical Indicator Oversold-Overbought Confirmation Trading Strategy
- Multi-Indicator Dynamic Trailing Stop Trading Strategy
- Multi-Indicator Dynamic Volatility Trading Strategy
- Dynamic Trading Theory: Exponential Moving Average and Cumulative Volume Period Crossover Strategy
- Dynamic EMA Crossover Strategy with ADX Trend Strength Filtering System
- Multi-Period Trend Linear Engulfing Pattern Quantitative Trading Strategy
- Adaptive Channel Breakout Strategy with Dynamic Support and Resistance Trading System
- Dynamic Filtering EMA Cross Strategy for Daily Trend Analysis
- Multi-EMA Crossover with Camarilla Support/Resistance Trend Trading System
- Enhanced Trend Multi-Signal Dynamic Trading Strategy
- Adaptive Momentum Martingale Trading System
- Trend Following RSI and Moving Average Combined Quantitative Trading Strategy