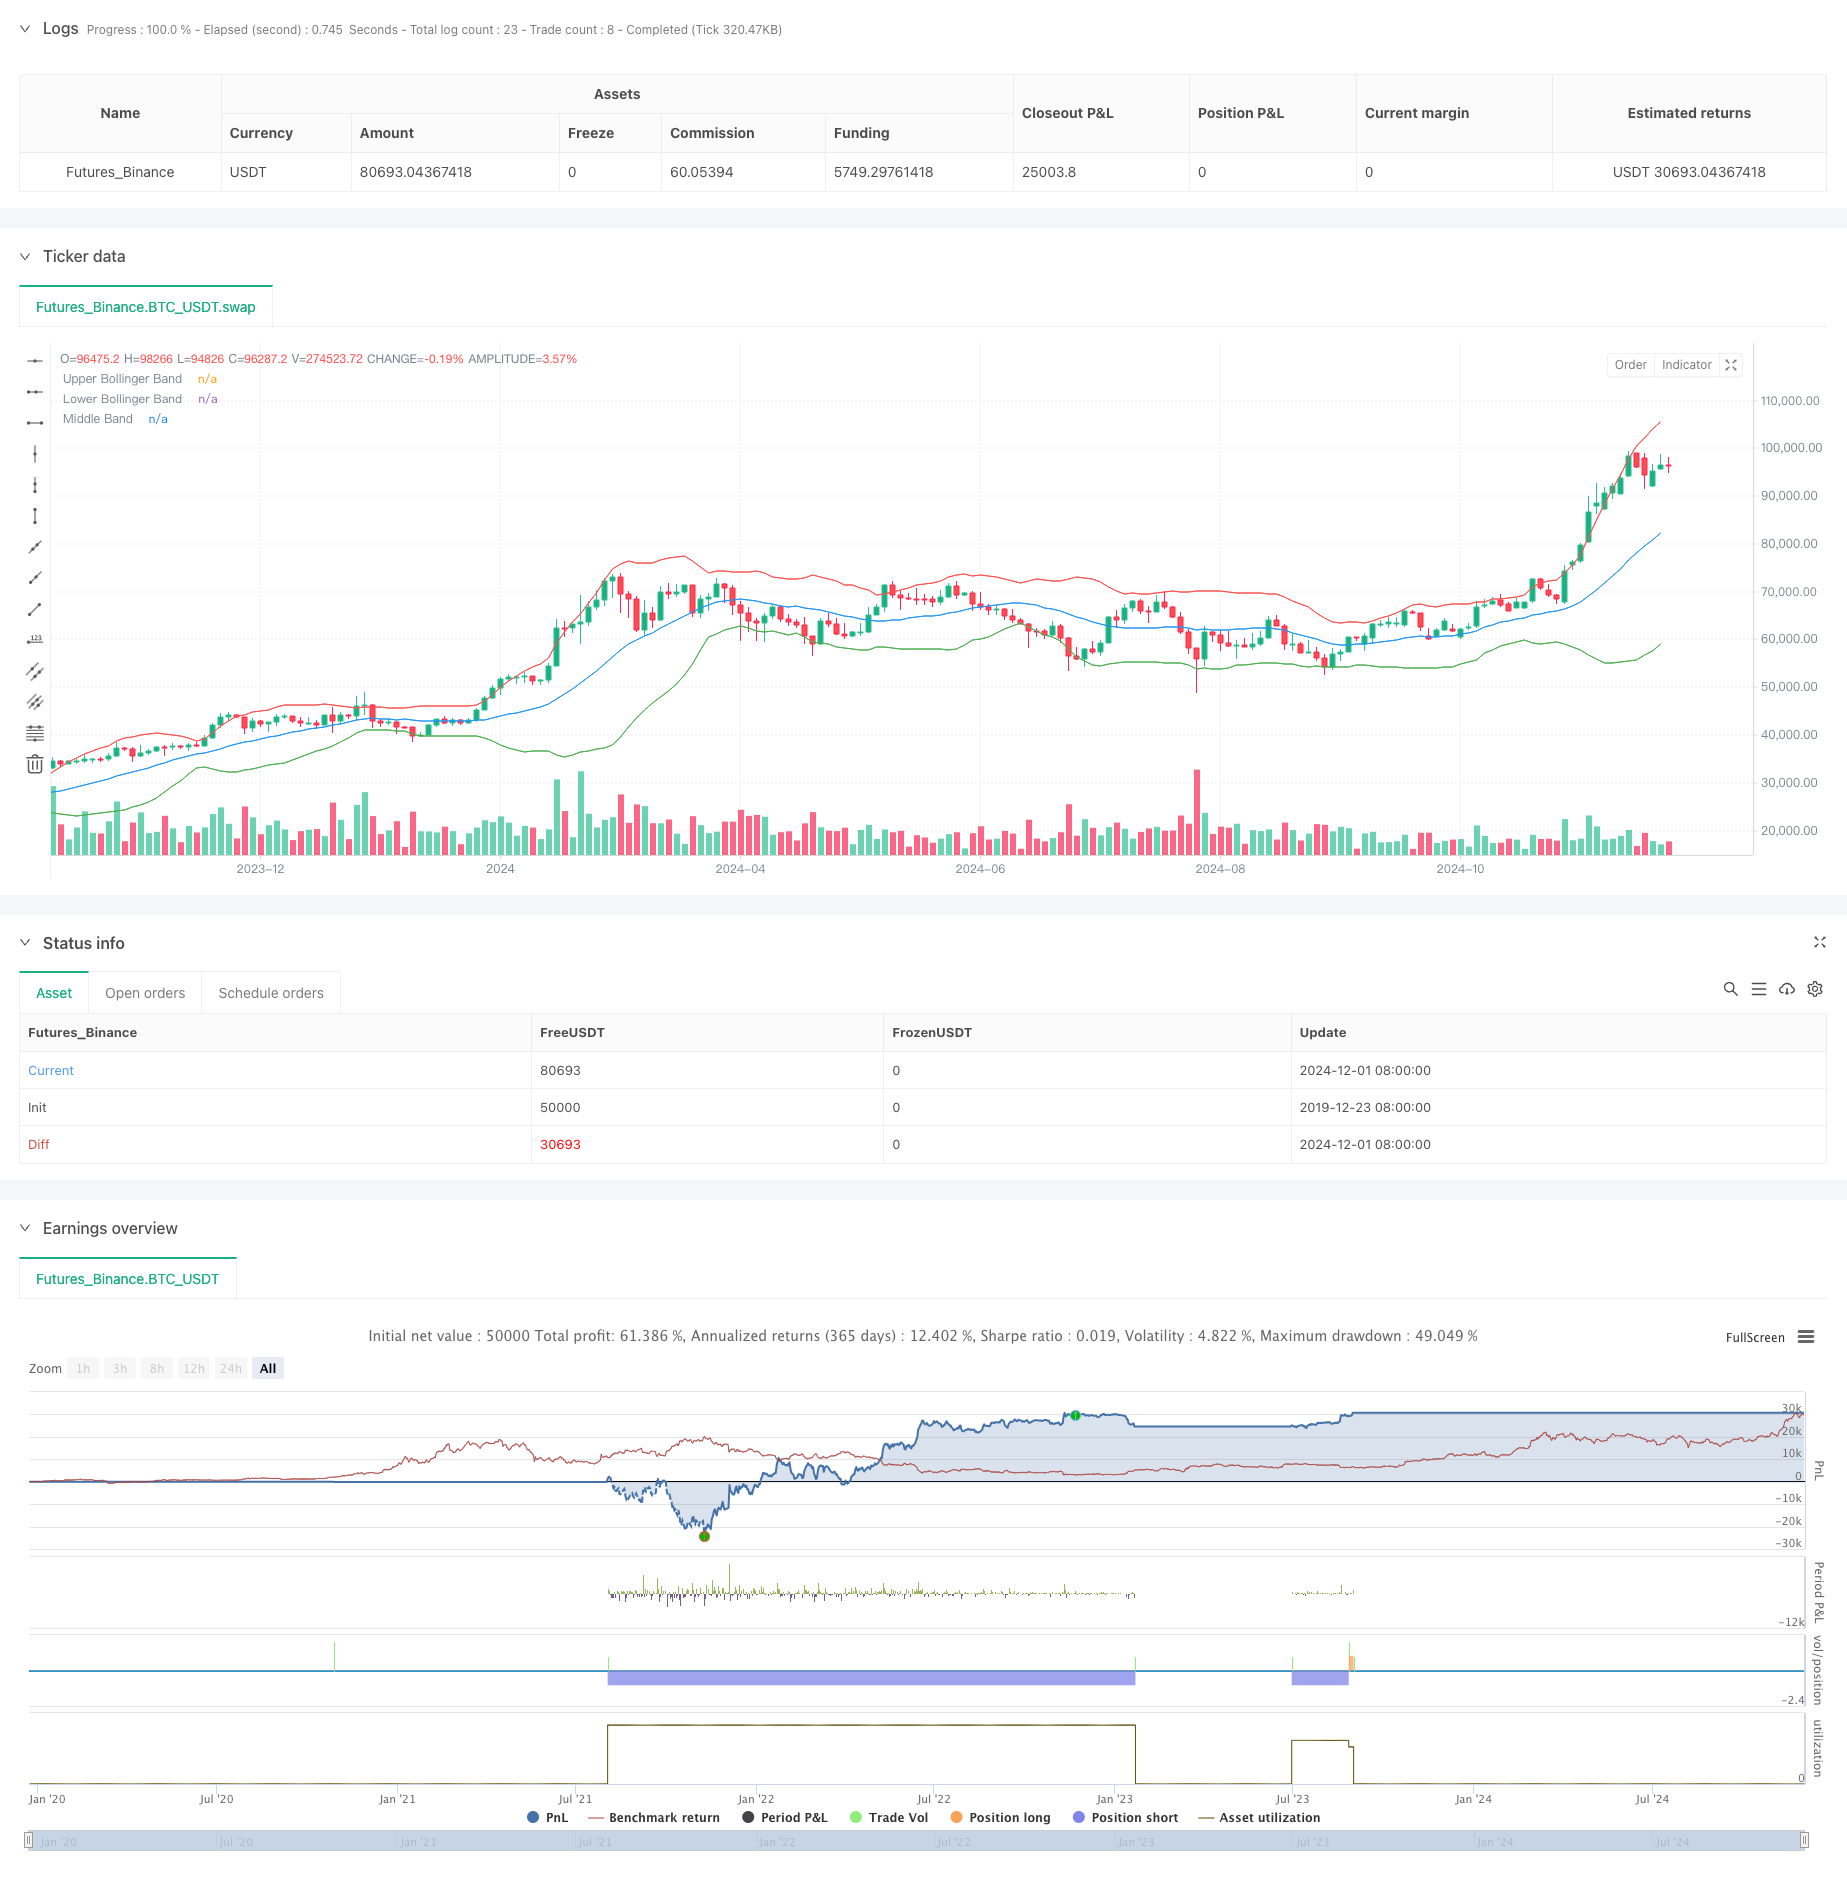
Descripción general
La estrategia es un sistema de trading de alta frecuencia que combina el indicador de la banda de Brin con la ruptura del precio. La estrategia utiliza la relación de la posición del precio con la banda de Brin, combinada con la señal de ruptura de los puntos altos y bajos previos, para invertir el comercio cuando el mercado está sobrecomprado.
Principio de estrategia
La lógica central de la estrategia se basa en dos condiciones de juicio principales: cuando el precio supera el punto más alto anterior y el punto más alto anterior está por debajo de la banda de Brin, se activa una señal de más; cuando el precio cae por debajo del punto más bajo anterior y el punto más bajo anterior está por encima de la banda de Brin, se activa una señal de vacío. El parámetro de Brin utiliza una media móvil de 20 períodos con una diferencia estándar de 2 veces para determinar el rango de fluctuación del mercado y el sistema de zonas de venta por encima de la venta por encima de la compra.
Ventajas estratégicas
- La combinación de las dos formas de negociación, breakout y regreso a la media, permite mantener la estabilidad en diferentes entornos de mercado
- La administración de posiciones con una relación de riesgo-beneficio fija favorece la estabilidad de los beneficios a largo plazo
- Mejora la operabilidad de la estrategia mediante la visualización de entradas, paradas y puntos objetivo
- El uso del indicador de la banda de Brin ayuda a identificar el estado de sobrecompra y sobreventa en el mercado, lo que mejora la precisión de las transacciones.
- La lógica de la estrategia es simple y clara, fácil de entender y ejecutar
Riesgo estratégico
- Las transacciones de alta frecuencia pueden tener costos de transacción más altos y deben tenerse en cuenta los efectos de las comisiones.
- Las señales falsas de ruptura frecuentes pueden producirse en mercados de oscilación horizontal
- El riesgo-beneficio fijo puede no ser suficiente para captar las grandes tendencias.
- La fijación de parámetros de la banda de Bryn puede no ser adecuada para todos los entornos de mercado
- Necesidad de monitorear el mercado en tiempo real para asegurar la ejecución oportuna de las señales
Dirección de optimización de la estrategia
- Introducción de indicadores de tráfico como señal de confirmación para mejorar la fiabilidad de las brechas
- Parámetros de las bandas de Bryn ajustados a la dinámica de la volatilidad del mercado
- Aumentar los filtros de tendencia para evitar el uso frecuente de mercados horizontales
- Considere agregar filtros de tiempo para evitar comerciar en horas de inactividad
- Desarrollo de mecanismos de ajuste de riesgo-beneficio
Resumir
Es un sistema de negociación completo que integra varios conceptos de análisis técnico. La estrategia es capaz de capturar oportunidades de reversión en zonas de sobreventa y sobrecompra en el mercado a través de la combinación de indicadores de la banda de Brin con brechas de precios. Aunque hay cierto espacio para la optimización, el marco básico del sistema tiene una buena escalabilidad y valor práctico.
/*backtest
start: 2019-12-23 08:00:00
end: 2024-12-03 00:00:00
period: 2d
basePeriod: 2d
exchanges: [{"eid":"Futures_Binance","currency":"BTC_USDT"}]
*/

//@version=5
strategy("Bollinger Band Scalping", overlay=true)

// Input for Bollinger Bands length and standard deviation
bbLength = input(20, title="Bollinger Bands Length")
stdDev = input(2.0, title="Bollinger Bands Std Dev")

// Calculate and plot the Bollinger Bands
basis = ta.sma(close, bbLength)
deviation = stdDev * ta.stdev(close, bbLength)
upperBB = basis + deviation
lowerBB = basis - deviation

// Get previous candle's values
prevHigh = high[1]   // Previous candle high
prevLow = low[1]     // Previous candle low

// Buy Signal Condition: Current high crossed above previous high and previous high is below the lower Bollinger Band
buyCondition = ta.crossover(high, prevHigh) and (prevHigh < lowerBB[1])

// Sell Signal Condition: Current low crossed below previous low and previous low is above the upper Bollinger Band
sellCondition = ta.crossunder(low, prevLow) and (prevLow > upperBB[1])

// Entry and exit for Buy signals
if (buyCondition)
    strategy.entry("Buy", strategy.long)
    // Calculate target and stop loss
    stopLossPrice = prevLow
    targetPrice = prevHigh + (prevHigh - stopLossPrice)  // 1:1 RR target

    // Set stop loss and target orders
    strategy.exit("Sell", "Buy", limit=targetPrice, stop=stopLossPrice)

    // // Plot entry line
    // line.new(x1=bar_index, y1=prevHigh, x2=bar_index + 12, y2=prevHigh, color=color.green, width=2, style=line.style_solid)
    // // Plot stop loss line
    // line.new(x1=bar_index, y1=stopLossPrice, x2=bar_index + 12, y2=stopLossPrice, color=color.red, width=1, style=line.style_dashed)
    // // Plot target line
    // line.new(x1=bar_index, y1=targetPrice, x2=bar_index + 12, y2=targetPrice, color=color.blue, width=2, style=line.style_solid)

// Entry and exit for Sell signals
if (sellCondition)
    strategy.entry("Sell", strategy.short)
    // Calculate target and stop loss
    stopLossPriceSell = prevHigh
    targetPriceSell = prevLow - (stopLossPriceSell - prevLow)  // 1:1 RR target

    // Set stop loss and target orders
    strategy.exit("Cover", "Sell", limit=targetPriceSell, stop=stopLossPriceSell)

    // // Plot entry line
    // line.new(x1=bar_index, y1=prevLow, x2=bar_index + 12, y2=prevLow, color=color.red, width=2, style=line.style_solid)
    // // Plot stop loss line
    // line.new(x1=bar_index, y1=stopLossPriceSell, x2=bar_index + 12, y2=stopLossPriceSell, color=color.green, width=1, style=line.style_dashed)
    // // Plot target line
    // line.new(x1=bar_index, y1=targetPriceSell, x2=bar_index + 12, y2=targetPriceSell, color=color.blue, width=2, style=line.style_solid)

// Plotting Bollinger Bands with 70% transparency
plot(upperBB, color=color.red, title="Upper Bollinger Band", transp=70)
plot(lowerBB, color=color.green, title="Lower Bollinger Band", transp=70)
plot(basis, color=color.blue, title="Middle Band", transp=70)