概述
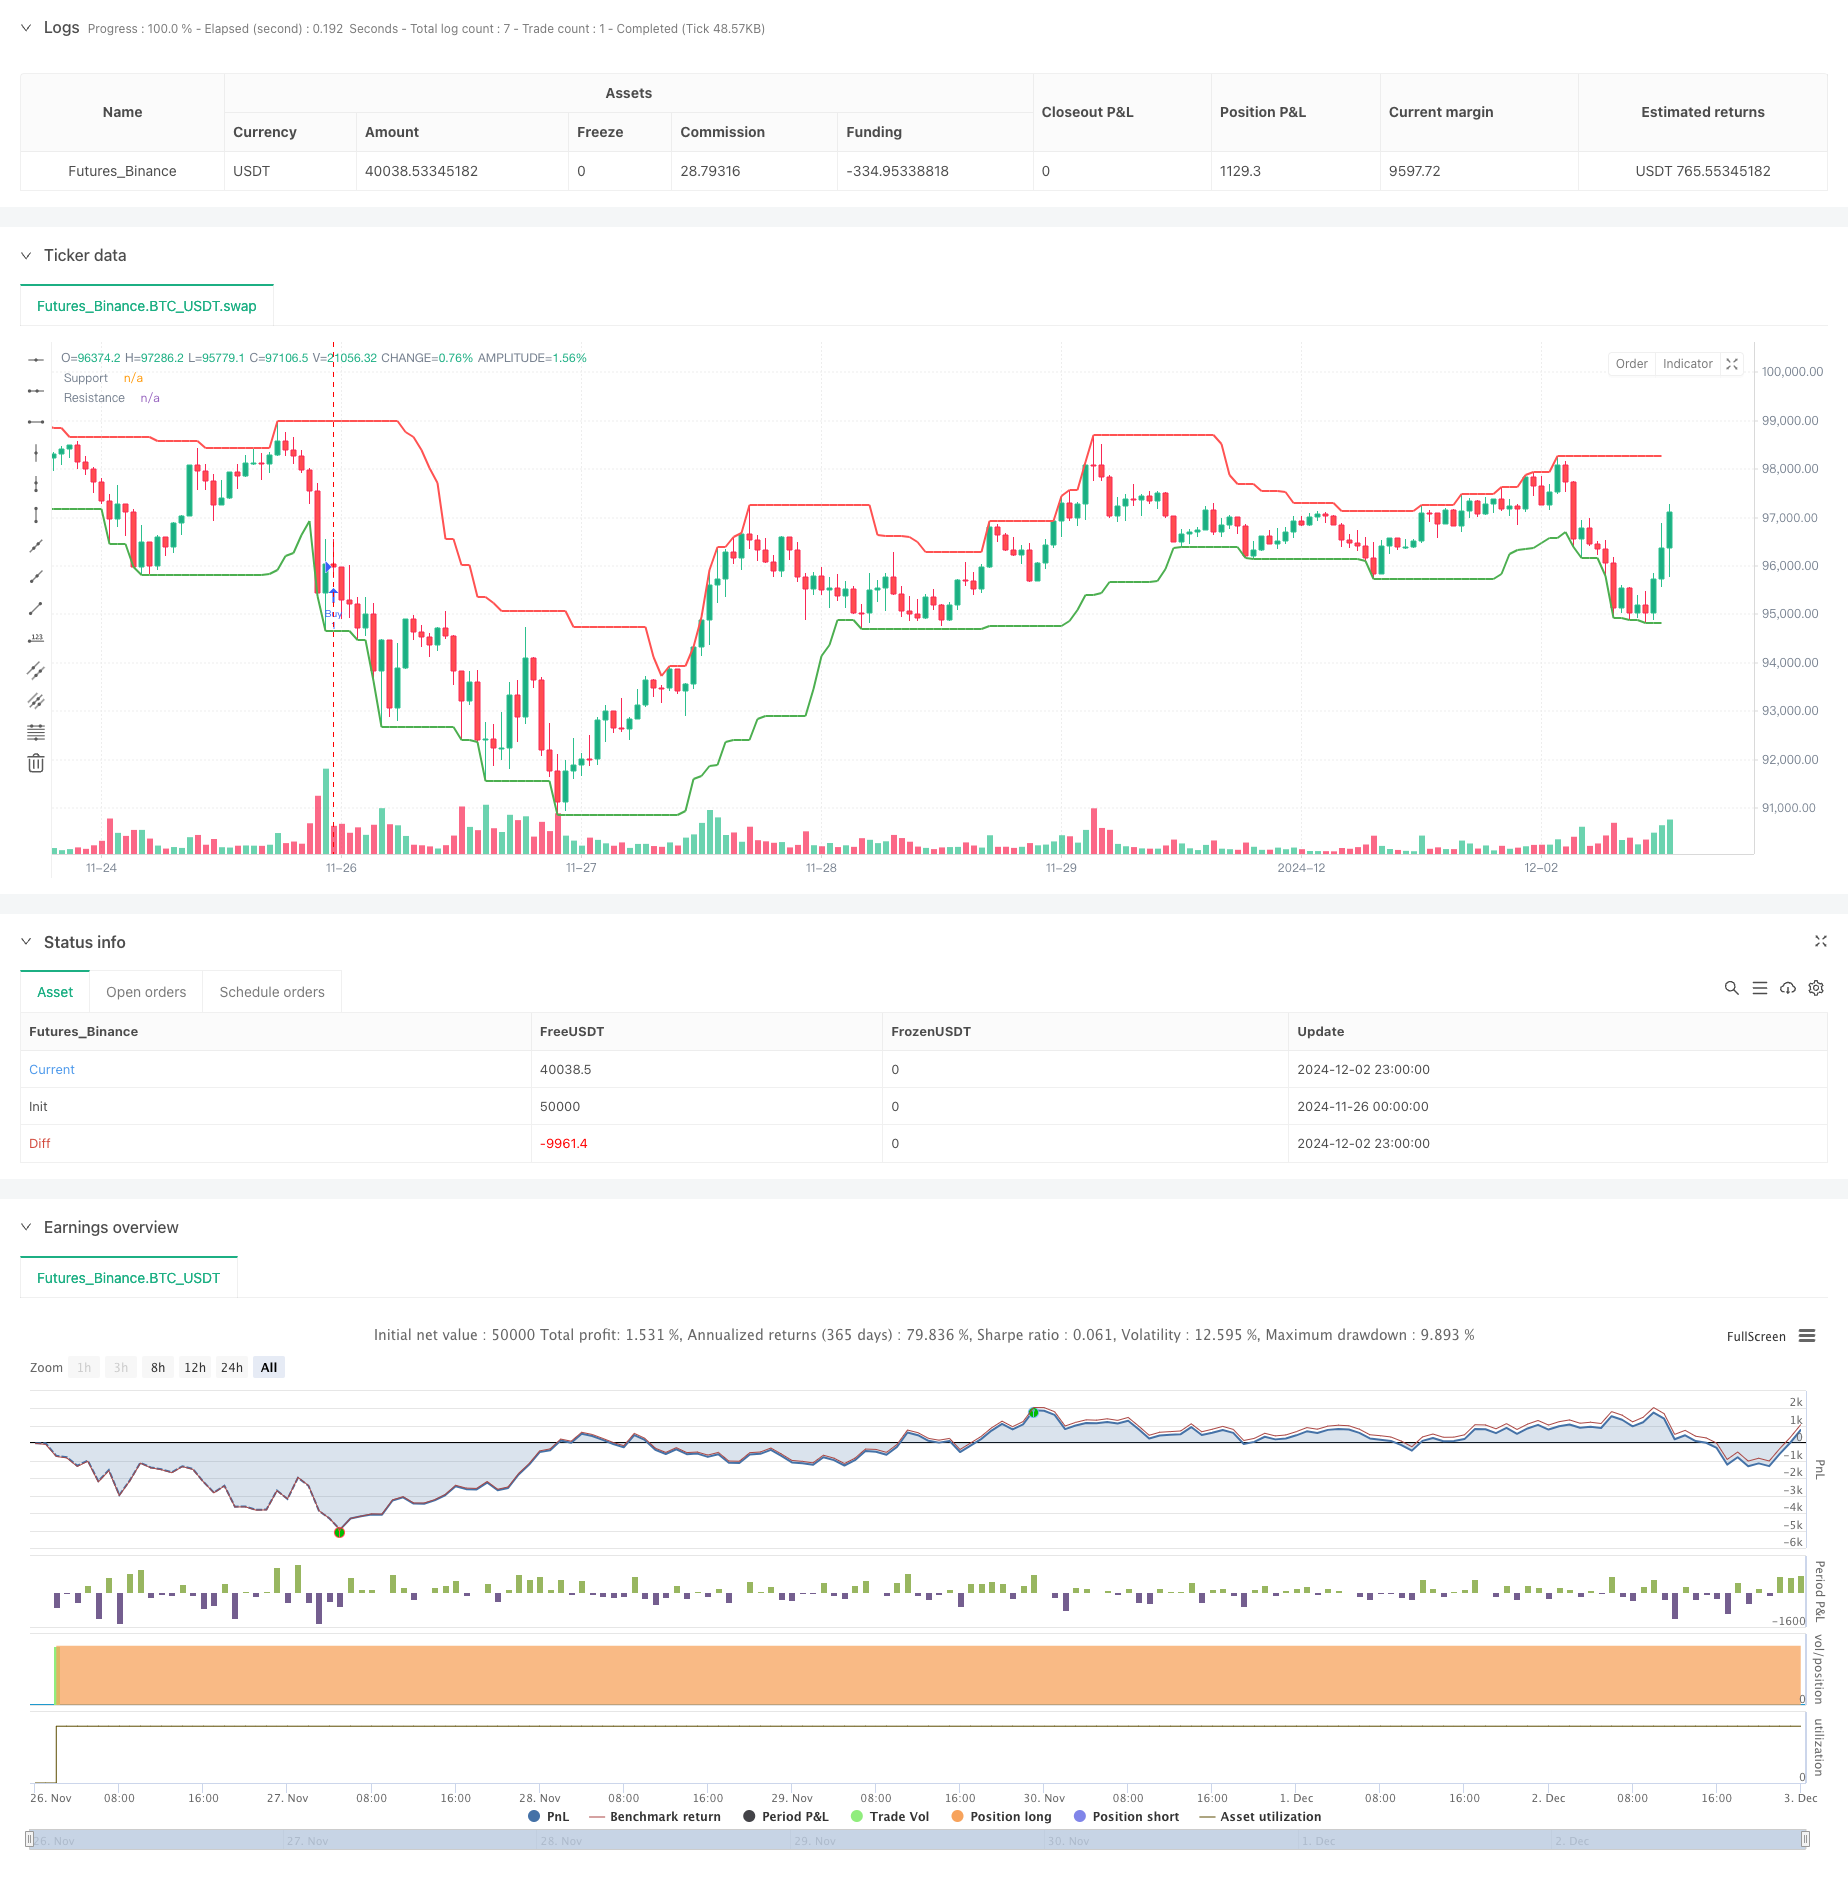
该策略是一个基于价格行为和动态支撑阻力位的交易系统,通过识别关键价格形态在支撑和阻力位附近进行交易。系统采用16周期的动态支撑阻力计算方法,结合四种经典的反转蜡烛图形态 - 锤子线、流星线、十字星和针形态来捕捉市场潜在的反转机会。策略采用固定百分比的止盈止损来管理风险,并使用敏感度参数来控制入场信号的严格程度。
策略原理
策略的核心是通过动态计算支撑位和阻力位,形成一个价格活动的上下边界。当价格接近这些关键水平时,系统会寻找特定的蜡烛图形态作为反转信号。入场条件需要价格在支撑阻力位的1.8%范围内(默认敏感度)出现反转形态。系统使用35%的资金管理规则,配合16%的止损和9.5%的止盈,有效控制每笔交易的风险在账户总额的5.6%左右。策略通过Pine Script实现,包含了完整的交易管理功能和可视化显示。
策略优势
- 策略结合了技术分析中最可靠的两个要素:价格形态和支撑阻力,提高了交易信号的可靠性
- 使用动态计算的支撑阻力位,能够适应市场条件的变化
- 采用严格的资金管理和风险控制措施,有效防止大幅回撤
- 策略逻辑清晰,参数可调整性强,便于根据不同市场情况优化
- 入场信号明确,无主观判断成分,适合自动化交易
策略风险
- 在高波动市场中,支撑阻力位的有效性可能降低
- 止损位置相对较远(16%),在剧烈行情中可能承受较大损失
- 敏感度参数的设置对交易频率和准确性有重要影响
- 仅依赖价格形态可能错过其他重要的市场信号
- 需要考虑交易成本对策略收益的影响
策略优化方向
- 引入成交量作为辅助确认指标,提高信号可靠性
- 开发自适应的敏感度参数,根据市场波动性动态调整
- 优化止损设置,考虑使用移动止损或分段止损方案
- 增加趋势过滤器,避免在强趋势中做反转交易
- 开发动态仓位管理系统,根据市场情况调整交易规模
总结
这个基于价格行为的交易策略通过结合动态支撑阻力位和经典反转形态,为交易者提供了一个系统化的交易方法。策略的优势在于逻辑清晰、风险可控,但仍需要根据实际交易效果进行持续优化。建议交易者在实盘使用前进行充分的回测和参数优化,并结合市场经验对策略进行个性化调整。
策略源码
/*backtest
start: 2024-11-26 00:00:00
end: 2024-12-03 00:00:00
period: 1h
basePeriod: 1h
exchanges: [{"eid":"Futures_Binance","currency":"BTC_USDT"}]
*/

// This Pine Script™ code is subject to the terms of the Mozilla Public License 2.0 at https://mozilla.org/MPL/2.0/
// © felipemiransan

//@version=5
strategy("Price Action Strategy", overlay=true)

// Settings
length = input.int(16, title="Support and Resistance Length")
sensitivity = input.float(0.018, title="Sensitivity")

// Stop Loss and Take Profit
stop_loss_pct = input.float(16, title="Stop Loss percentage", minval=0.1) / 100
take_profit_pct = input.float(9.5, title="Take Profit percentage", minval=0.1) / 100

// Function to identify a Hammer
isHammer() =>
    body = close - open
    price_range = high - low
    lower_shadow = open - low
    upper_shadow = high - close
    body > 0 and lower_shadow > body * 2 and upper_shadow < body * 0.5 and price_range > 0

// Function to identify a Shooting Star
isShootingStar() =>
    body = open - close
    price_range = high - low
    lower_shadow = close - low
    upper_shadow = high - open
    body > 0 and upper_shadow > body * 2 and lower_shadow < body * 0.5 and price_range > 0

// Function to identify a Doji
isDoji() =>
    body = close - open
    price_range = high - low
    math.abs(body) < (price_range * 0.1)  // Doji has a small body

// Function to identify a Pin Bar
isPinBar() =>
    body = close - open
    price_range = high - low
    lower_shadow = open - low
    upper_shadow = high - close
    (upper_shadow > body * 2 and lower_shadow < body * 0.5) or (lower_shadow > body * 2 and upper_shadow < body * 0.5)

// Support and resistance levels
support = ta.lowest(low, length)
resistance = ta.highest(high, length)

// Entry criteria
long_condition = (isHammer() or isDoji() or isPinBar()) and close <= support * (1 + sensitivity)
short_condition = (isShootingStar() or isDoji() or isPinBar()) and close >= resistance * (1 - sensitivity)

// Function to calculate stop loss and take profit (long)
calculate_levels(position_size, avg_price, stop_loss_pct, take_profit_pct) =>
    stop_loss_level = avg_price * (1 - stop_loss_pct)
    take_profit_level = avg_price * (1 + take_profit_pct)
    [stop_loss_level, take_profit_level]

// Function to calculate stop loss and take profit (short)
calculate_levels_short(position_size, avg_price, stop_loss_pct, take_profit_pct) =>
    stop_loss_level = avg_price * (1 + stop_loss_pct)
    take_profit_level = avg_price * (1 - take_profit_pct)
    [stop_loss_level, take_profit_level]

// Buy entry order with label
if (long_condition and strategy.opentrades == 0)
    strategy.entry("Buy", strategy.long)
    pattern = isHammer() ? "Hammer" : isDoji() ? "Doji" : isPinBar() ? "Pin Bar" : ""
    label.new(x=bar_index, y=low, text=pattern, color=color.green, textcolor=color.black, size=size.small)

// Sell entry order with label
if (short_condition and strategy.opentrades == 0)
    strategy.entry("Sell", strategy.short)
    pattern = isShootingStar() ? "Shooting Star" : isDoji() ? "Doji" : isPinBar() ? "Pin Bar" : ""
    label.new(x=bar_index, y=high, text=pattern, color=color.red, textcolor=color.black, size=size.small)

// Stop Loss and Take Profit management for open positions
if (strategy.opentrades > 0)
    if (strategy.position_size > 0)  // Long position
        avg_price_long = strategy.position_avg_price  // Average price of long position
        [long_stop_level, long_take_profit_level] = calculate_levels(strategy.position_size, avg_price_long, stop_loss_pct, take_profit_pct)
        strategy.exit("Exit Long", from_entry="Buy", stop=long_stop_level, limit=long_take_profit_level)
    if (strategy.position_size < 0)  // Short position
        avg_price_short = strategy.position_avg_price  // Average price of short position
        [short_stop_level, short_take_profit_level] = calculate_levels_short(strategy.position_size, avg_price_short, stop_loss_pct, take_profit_pct)
        strategy.exit("Exit Short", from_entry="Sell", stop=short_stop_level, limit=short_take_profit_level)

// Visualization of Support and Resistance Levels
plot(support, title="Support", color=color.green, linewidth=2)
plot(resistance, title="Resistance", color=color.red, linewidth=2)
相关推荐
- 动态成交量辅助唐奇安通道趋势突破策略
- Support-Resistance breakout
- 多重支撑阻力位叠加动量反转交易策略
- 多重均线交叉结合Camarilla支撑阻力趋势交易系统
- VWAP-ATR动态价格行为交易系统
- 自适应通道突破策略与动态支阻位交易系统
- 量化价格行为突破动态风险收益比交易策略
- 多周期均线趋势跟踪与支阻系统结合的混合交易策略
- MACD结合阿尔布鲁克斯价格行为的趋势跟踪策略
- 多重形态识别与SR分位交易策略
更多内容
- AO多层量化趋势增强型策略
- DPO-EMA趋势交叉量化策略研究
- EMA-MACD高频量化策略与智能风控系统
- 多均线趋势动量交易策略结合风险管理系统
- 历史价格突破型混合趋势交易系统(HBTS)
- 多重RSI-EMA动量对冲增仓策略
- 双均线交叉动态颜色量化策略
- 多重指数均线自动交易跟踪止盈系统
- 高频混合技术分析量化策略
- 双均线与相对强弱混合型自适应策略
- 布林带高频量化策略结合过高低点突破的多空策略
- MACD-RSI 动态交叉量化交易系统
- RSI与Supertrend趋势跟踪型自适应波动策略
- 双均线交叉结合RSI动量优化交易策略
- 多重技术指标趋势跟踪交易策略
- 多重指数均线交叉战略结合交易量ATR动态止损优化策略
- 双重链条混合动量均线跟踪交易系统
- 动态信号线趋势追踪与波动率过滤策略
- 多时段Bollinger动量突破策略结合Hull均线策略
- 多步波动率自适应动态超趋势策略