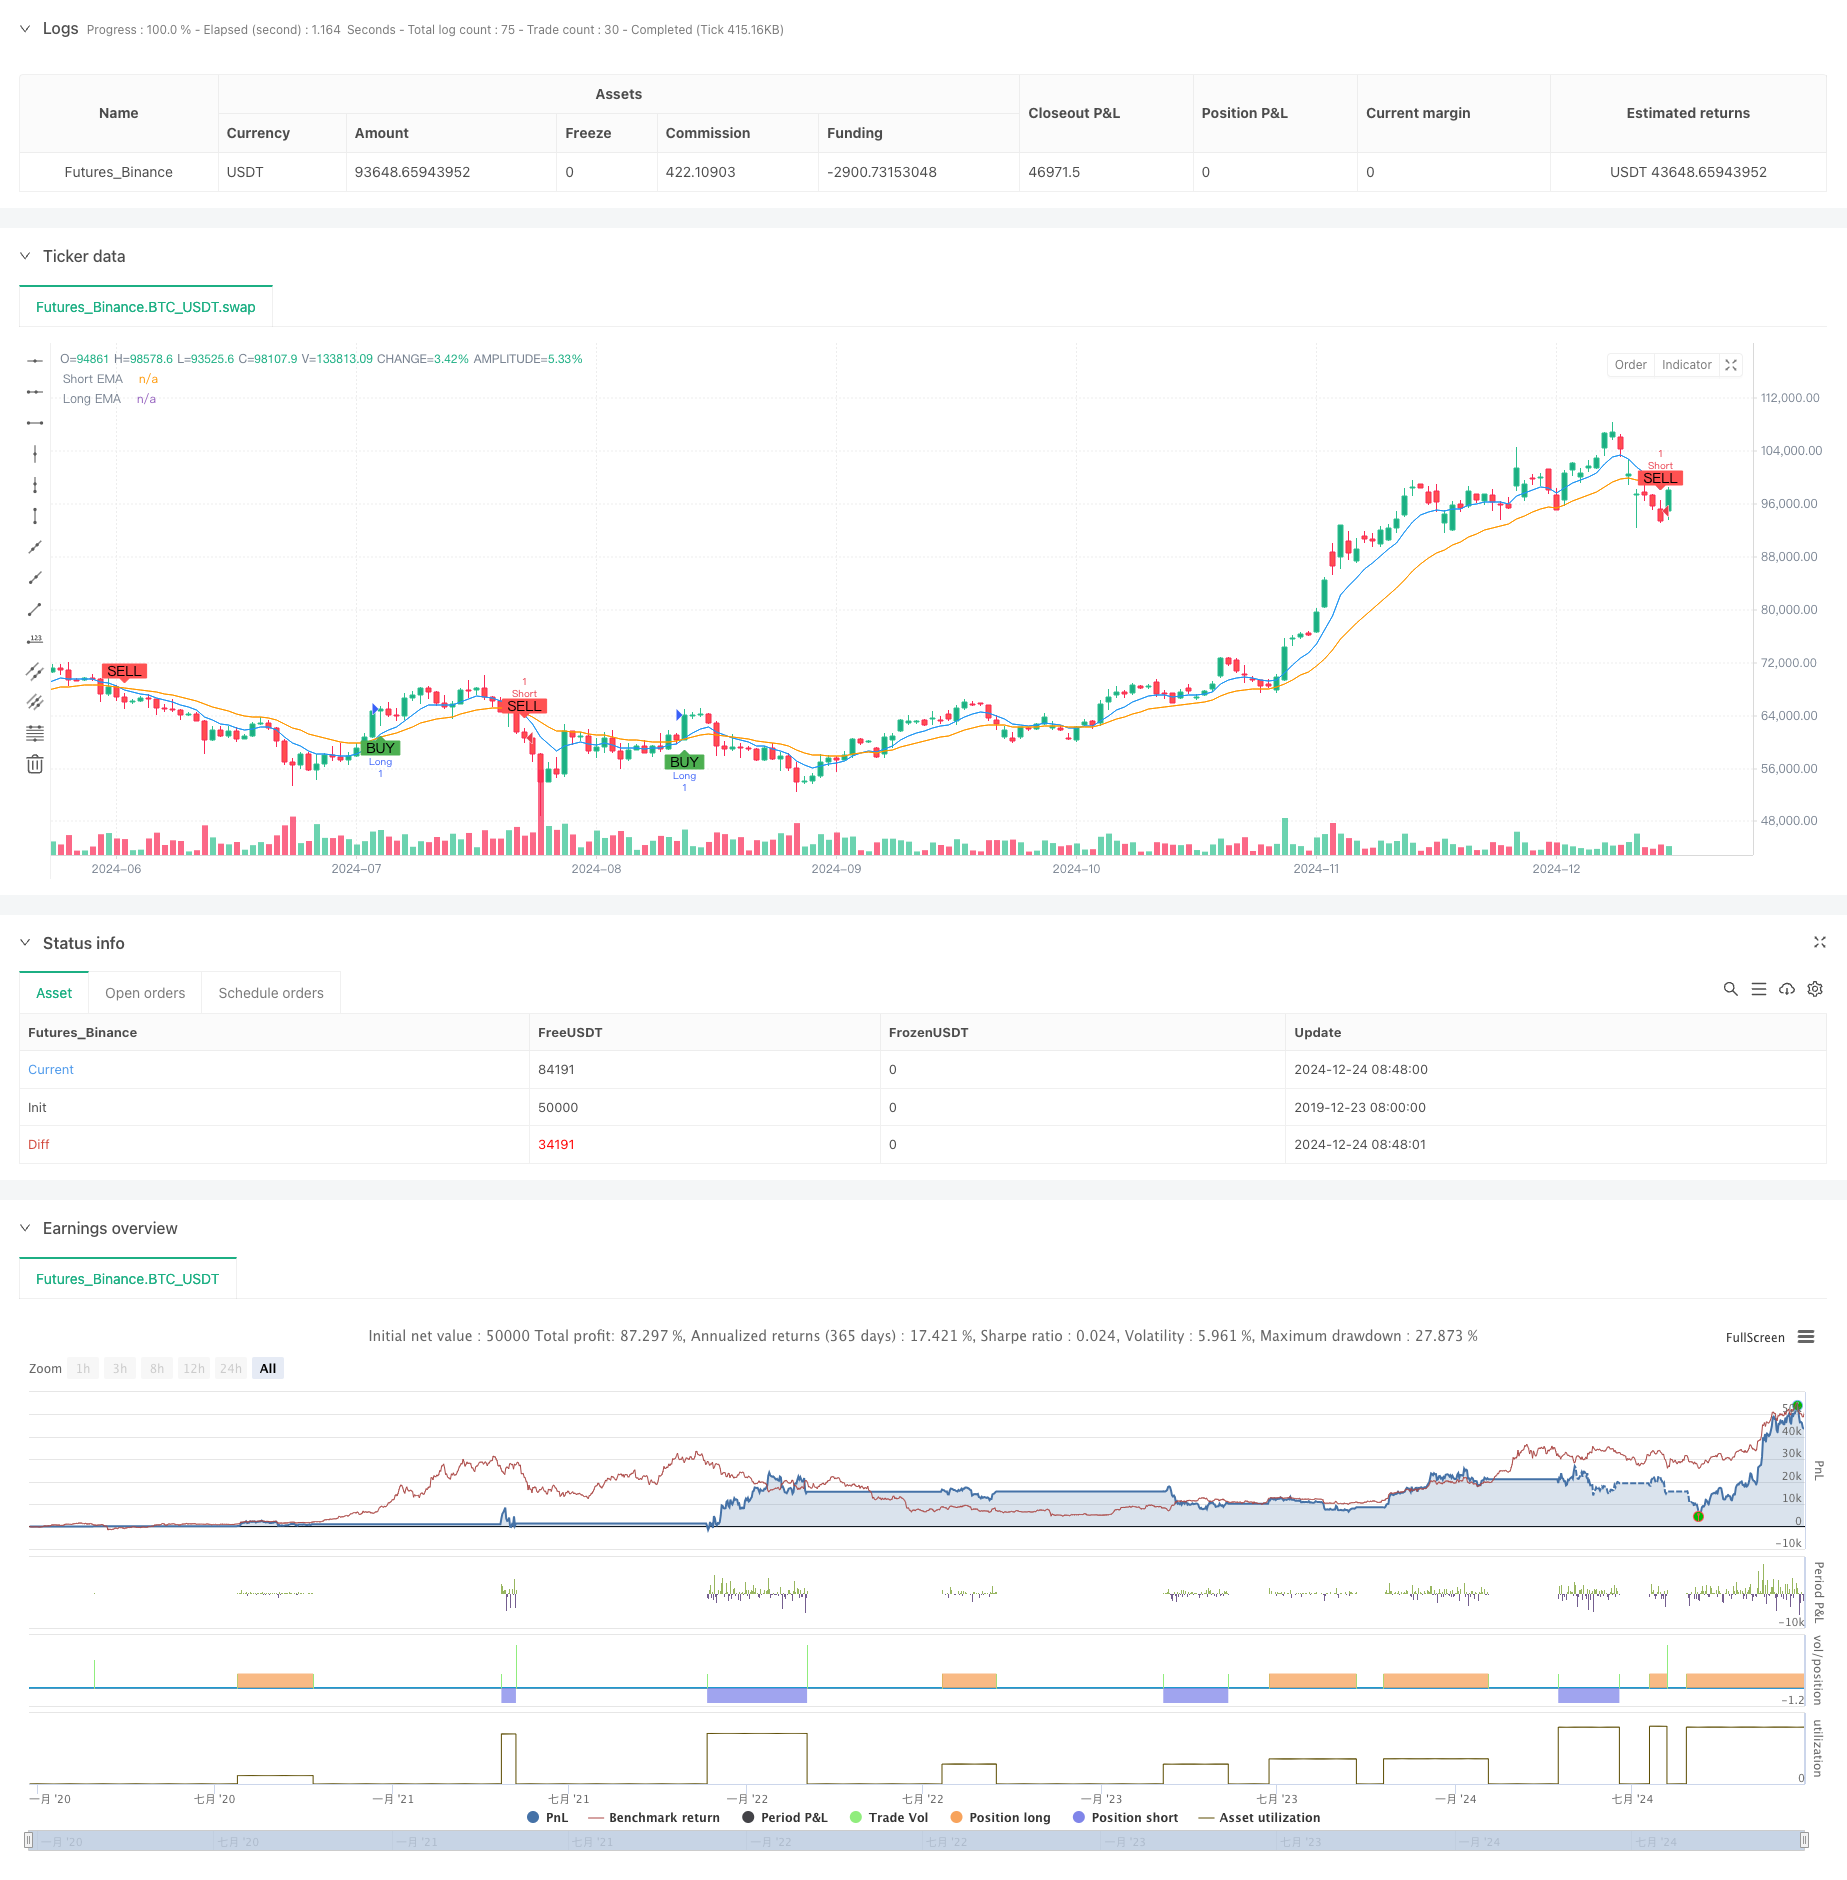
Descripción general
Se trata de una estrategia de comercio de banda de alta frecuencia basada en una combinación de indicadores técnicos múltiples. La estrategia busca el mejor momento de entrada en el comercio de corta línea mediante la combinación de señales de mercado de varias dimensiones, como el índice de movimiento medio (EMA), el índice de fuerza relativa (RSI), el análisis de volumen de transacción y la identificación de la configuración de precios de N ciclos. La estrategia adopta un estricto mecanismo de control de riesgo para proteger la seguridad de los fondos mediante el establecimiento de paradas de pérdidas.
Principio de estrategia
La lógica central de la estrategia es confirmar la dirección de las transacciones mediante la combinación de señales multidimensionales:
- Utiliza el cruce de EMA de 8 y 21 ciclos para determinar la dirección de la tendencia a corto plazo
- El RSI de 14 ciclos confirma la dinámica del mercado, el RSI>50 confirma la dinámica de varios mandos, el RSI<50 confirma la dinámica de la cabeza vacía
- Comparar el volumen de transacciones actuales con el promedio de transacciones de 20 períodos para asegurar la vitalidad del mercado
- Identificación de la forma potencial de reversión mediante la comparación de los máximos y mínimos de las 5 líneas K más recientes con las 10 líneas K anteriores La estrategia solo emite una señal de negociación cuando se satisfacen las señales anteriores al mismo tiempo. Cuando aparezcan señales de múltiples cabezas, se abrirá a precio de mercado, y cuando aparezcan señales de cabezas vacías, se abrirá a precio de mercado. Al mismo tiempo, se establecerá un stop loss del 1.5% y un stop loss del 0.7% para controlar el riesgo.
Ventajas estratégicas
- La verificación cruzada de señales multidimensionales reduce considerablemente el impacto de las falsas señales
- La combinación de las ventajas del seguimiento de tendencias y el comercio de volúmenes mejora la adaptabilidad de las estrategias
- Confirme el volumen de transacciones y evite las transacciones en períodos claros del mercado
- Reconocimiento de patrones de N ciclos para detectar señales de reversión en el mercado
- Establezca un Stop Loss Ratio razonable para controlar el riesgo de manera efectiva
- La lógica de la estrategia es clara, lo que facilita la optimización continua y el ajuste de los parámetros
Riesgo estratégico
- Se puede activar el stop loss con frecuencia en mercados muy volátiles
- La mayor sensibilidad al retraso en las ofertas de los vendedores
- La probabilidad de satisfacer varios indicadores al mismo tiempo es relativamente baja
- Se espera que se produzcan pérdidas continuas en un mercado convulso Contramedidas:
- El Stop Loss Ratio se puede ajustar a la fluctuación del mercado
- Se recomienda operar en momentos de mayor liquidez
- Se puede equilibrar la cantidad y la calidad de la señal mediante la optimización de parámetros
- Se recomienda el uso de trailing stop para aumentar la rentabilidad
Dirección de optimización de la estrategia
- Introducción de un mecanismo de ajuste de parámetros adaptativo que permite a las estrategias optimizar automáticamente los parámetros en función de las condiciones del mercado
- Aumentar los filtros de volatilidad del mercado y suspender las operaciones en un entorno de mercado excesivamente volátil.
- Desarrollo de algoritmos de reconocimiento de formas de ciclo N más complejos para mejorar la precisión de la señal de inversión
- Introducción de un módulo de gestión de fondos para ajustar el tamaño de las posiciones en función de la dinámica del valor neto de las cuentas
- Aumentar el tiempo de verificación y aumentar la fiabilidad de la señal
Resumir
La estrategia busca oportunidades de comercio de calidad en el comercio de alta frecuencia a través de la combinación de indicadores técnicos multidimensionales. La estrategia está diseñada teniendo en cuenta las características del mercado, como la tendencia, la dinámica y el volumen de transacciones, y garantiza la estabilidad mediante un estricto control de riesgos. Aunque hay cierto espacio para la optimización, en general, es una estrategia de comercio lógica y práctica.
/*backtest
start: 2019-12-23 08:00:00
end: 2024-12-25 08:00:00
period: 1d
basePeriod: 1d
exchanges: [{"eid":"Futures_Binance","currency":"BTC_USDT"}]
*/

//@version=5
strategy("XRP/USD Scalping Strategy with Alerts", overlay=true)

// Input parameters
ema_short = input.int(8, title="Short EMA Period")
ema_long = input.int(21, title="Long EMA Period")
rsiperiod = input.int(14, title="RSI Period")
vol_lookback = input.int(20, title="Volume Lookback Period")
n_bars = input.int(5, title="N-Bars Detection")

take_profit_perc = input.float(1.5, title="Take Profit (%)") / 100
stop_loss_perc = input.float(0.7, title="Stop Loss (%)") / 100

// Indicators
ema_short_line = ta.ema(close, ema_short)
ema_long_line = ta.ema(close, ema_long)
rsi = ta.rsi(close, rsiperiod)
avg_volume = ta.sma(volume, vol_lookback)

// N-bar detection function
bullish_nbars = ta.lowest(low, n_bars) > ta.lowest(low, n_bars * 2)
bearish_nbars = ta.highest(high, n_bars) < ta.highest(high, n_bars * 2)

// Entry conditions
long_condition = ta.crossover(ema_short_line, ema_long_line) and rsi > 50 and volume > avg_volume and bullish_nbars
short_condition = ta.crossunder(ema_short_line, ema_long_line) and rsi < 50 and volume > avg_volume and bearish_nbars

// Plot signals
plotshape(long_condition, title="Buy Signal", location=location.belowbar, color=color.green, style=shape.labelup, text="BUY")
plotshape(short_condition, title="Sell Signal", location=location.abovebar, color=color.red, style=shape.labeldown, text="SELL")

// Strategy execution
if (long_condition)
    strategy.entry("Long", strategy.long)
    strategy.exit("TP/SL", from_entry="Long", limit=close * (1 + take_profit_perc), stop=close * (1 - stop_loss_perc))

if (short_condition)
    strategy.entry("Short", strategy.short)
    strategy.exit("TP/SL", from_entry="Short", limit=close * (1 - take_profit_perc), stop=close * (1 + stop_loss_perc))

// Plot EMA lines
plot(ema_short_line, color=color.blue, title="Short EMA")
plot(ema_long_line, color=color.orange, title="Long EMA")

// Create alerts
alertcondition(long_condition, title="Buy Alert", message="Buy Signal: EMA Crossover, RSI > 50, Volume > Avg, Bullish N-Bars")
alertcondition(short_condition, title="Sell Alert", message="Sell Signal: EMA Crossunder, RSI < 50, Volume > Avg, Bearish N-Bars")