Aperçu
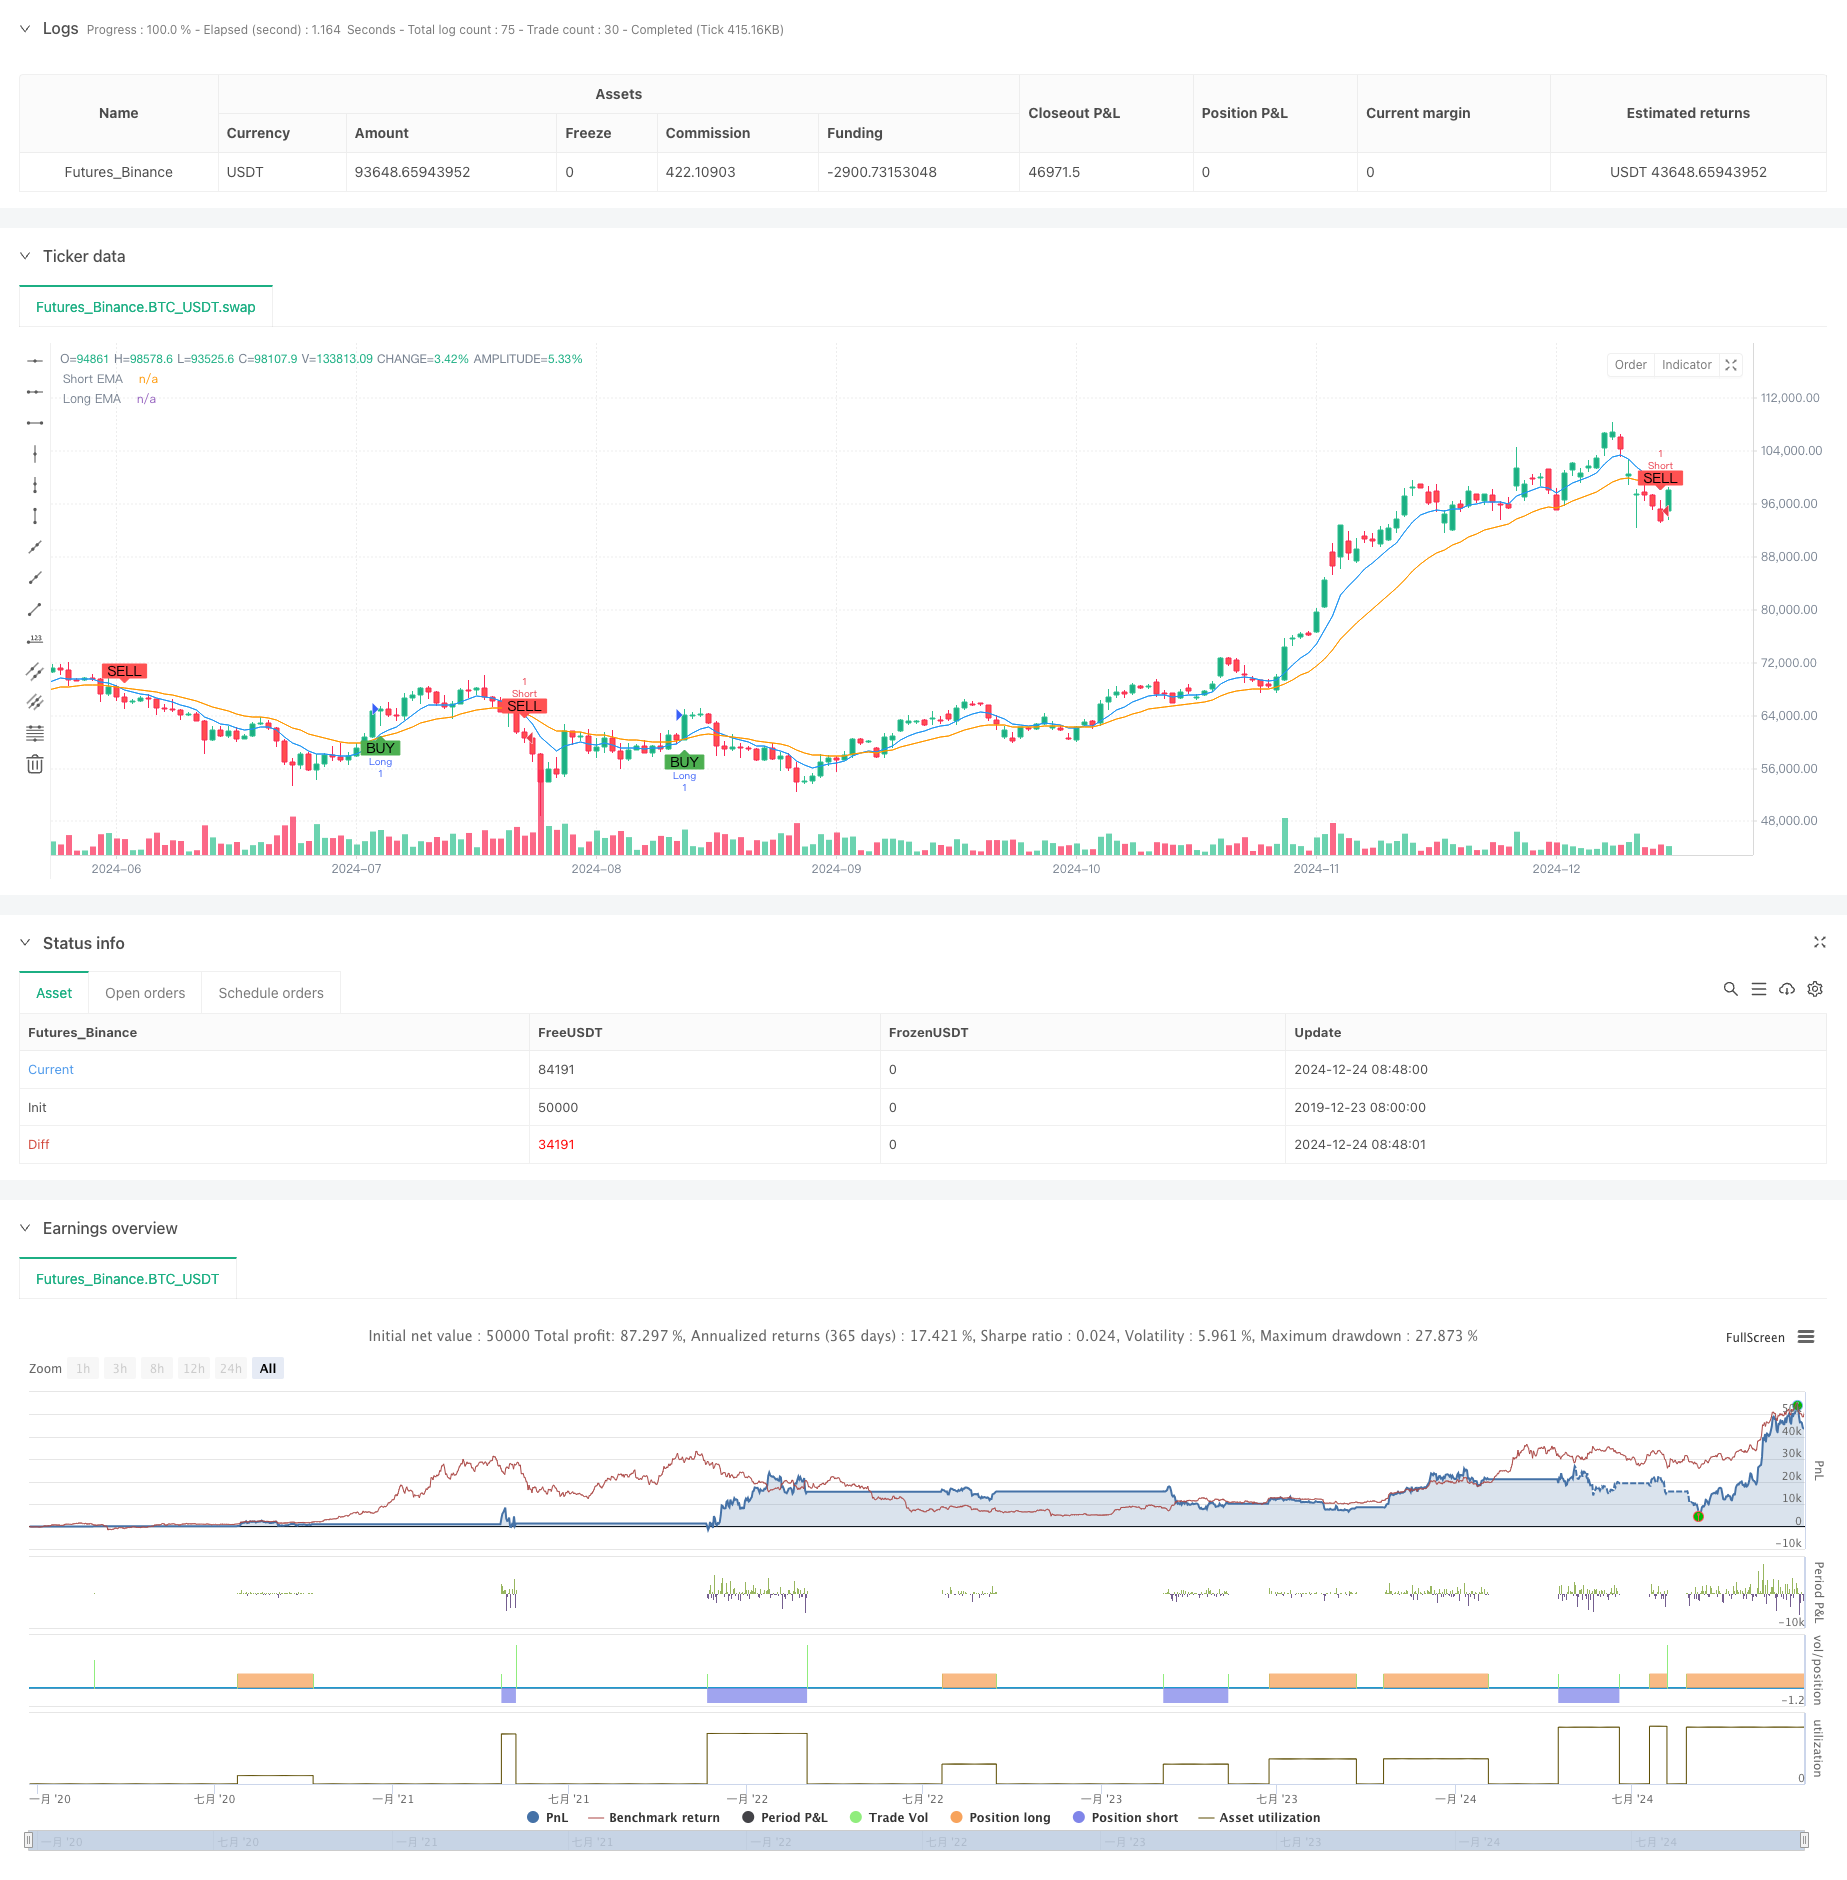
Il s’agit d’une stratégie de négociation de bandes de fréquence élevées basée sur un ensemble d’indicateurs techniques multiples. La stratégie vise à trouver les meilleurs moments d’entrée dans les transactions de courte durée en combinant des signaux de marché à plusieurs dimensions tels que les moyennes mobiles indicielles (EMA), les indices de force relative (RSI), l’analyse du volume de transaction et l’identification des modèles de prix à N cycles. La stratégie utilise un mécanisme de contrôle des risques rigoureux pour protéger la sécurité des fonds en définissant des arrêts de perte.
Principe de stratégie
La logique centrale de la stratégie est de confirmer la direction de la transaction par une combinaison synchrone de signaux multidimensionnels:
- Utilisez un croisement des EMA de 8 cycles et de 21 cycles pour juger de la direction de la tendance à court terme
- La dynamique du marché est vérifiée par le RSI à 14 cycles, le RSI > 50 confirme la dynamique des multiples, le RSI < 50 confirme la dynamique des nuls
- Comparer le volume des transactions en cours avec la moyenne des transactions sur 20 cycles pour s’assurer que le marché est actif
- Identifier les formes potentielles d’inversion en comparant les 5 dernières lignes K avec les plus hauts et les plus bas des 10 lignes K précédentes La stratégie n’émettra un signal de transaction que si les signaux ci-dessus sont satisfaits simultanément. L’ouverture au cours du marché est ouverte au cours du marché lorsque le signal de multiples têtes apparaît, et la fermeture au cours du marché lorsque le signal de tête vide apparaît. Le risque est contrôlé par la mise en place d’un stop loss de 1,5% et d’un stop loss de 0,7%
Avantages stratégiques
- La validation croisée des signaux multidimensionnels réduit considérablement l’impact des faux signaux
- La combinaison des avantages du suivi des tendances et du trading dynamique améliore l’adaptabilité de la stratégie
- Confirmer le volume des transactions pour éviter les échanges pendant les périodes de faibles volumes
- La reconnaissance de formes en N cycles permet de détecter les signaux de retournement de marché en temps opportun
- Régler un ratio de stop-loss raisonnable et contrôler efficacement les risques
- Une logique de stratégie claire pour une optimisation continue et des paramètres de réglage
Risque stratégique
- Les stop loss peuvent être déclenchés fréquemment dans des marchés très volatils
- Les commerçants sont plus sensibles aux retards de soumission
- Les chances de répondre à plusieurs indicateurs simultanément sont relativement faibles
- Des arrêts de pertes en série dans un marché en crise Contre-mesures :
- Le ratio de stop loss peut être ajusté en fonction des fluctuations du marché.
- Il est recommandé de négocier pendant les périodes de meilleure liquidité.
- La quantité et la qualité du signal peuvent être équilibrées par l’optimisation des paramètres
- Il est recommandé d’utiliser des trailing stops pour augmenter la rentabilité.
Orientation de l’optimisation de la stratégie
- Introduction d’un mécanisme d’ajustement de paramètres adaptatif permettant à la stratégie d’optimiser automatiquement les paramètres en fonction de l’état du marché
- Augmentation des filtres de volatilité du marché et suspension des transactions dans des conditions de marché extrêmement volatiles
- Développement d’algorithmes de reconnaissance de forme N-cycle plus sophistiqués pour améliorer la précision des signaux de retournement
- Introduction d’un module de gestion des fonds, permettant de modifier la taille des positions en fonction de la dynamique de la valeur nette des comptes
- Augmentation des cycles de validation et de la fiabilité des signaux
Résumer
La stratégie est conçue en tenant compte des caractéristiques du marché telles que la tendance, la dynamique et le volume de transactions, et assure la stabilité grâce à une stricte maîtrise des risques. Bien qu’il existe une certaine marge d’optimisation, l’ensemble est une stratégie de négociation logiquement claire et pratique.
/*backtest
start: 2019-12-23 08:00:00
end: 2024-12-25 08:00:00
period: 1d
basePeriod: 1d
exchanges: [{"eid":"Futures_Binance","currency":"BTC_USDT"}]
*/

//@version=5
strategy("XRP/USD Scalping Strategy with Alerts", overlay=true)

// Input parameters
ema_short = input.int(8, title="Short EMA Period")
ema_long = input.int(21, title="Long EMA Period")
rsiperiod = input.int(14, title="RSI Period")
vol_lookback = input.int(20, title="Volume Lookback Period")
n_bars = input.int(5, title="N-Bars Detection")

take_profit_perc = input.float(1.5, title="Take Profit (%)") / 100
stop_loss_perc = input.float(0.7, title="Stop Loss (%)") / 100

// Indicators
ema_short_line = ta.ema(close, ema_short)
ema_long_line = ta.ema(close, ema_long)
rsi = ta.rsi(close, rsiperiod)
avg_volume = ta.sma(volume, vol_lookback)

// N-bar detection function
bullish_nbars = ta.lowest(low, n_bars) > ta.lowest(low, n_bars * 2)
bearish_nbars = ta.highest(high, n_bars) < ta.highest(high, n_bars * 2)

// Entry conditions
long_condition = ta.crossover(ema_short_line, ema_long_line) and rsi > 50 and volume > avg_volume and bullish_nbars
short_condition = ta.crossunder(ema_short_line, ema_long_line) and rsi < 50 and volume > avg_volume and bearish_nbars

// Plot signals
plotshape(long_condition, title="Buy Signal", location=location.belowbar, color=color.green, style=shape.labelup, text="BUY")
plotshape(short_condition, title="Sell Signal", location=location.abovebar, color=color.red, style=shape.labeldown, text="SELL")

// Strategy execution
if (long_condition)
    strategy.entry("Long", strategy.long)
    strategy.exit("TP/SL", from_entry="Long", limit=close * (1 + take_profit_perc), stop=close * (1 - stop_loss_perc))

if (short_condition)
    strategy.entry("Short", strategy.short)
    strategy.exit("TP/SL", from_entry="Short", limit=close * (1 - take_profit_perc), stop=close * (1 + stop_loss_perc))

// Plot EMA lines
plot(ema_short_line, color=color.blue, title="Short EMA")
plot(ema_long_line, color=color.orange, title="Long EMA")

// Create alerts
alertcondition(long_condition, title="Buy Alert", message="Buy Signal: EMA Crossover, RSI > 50, Volume > Avg, Bullish N-Bars")
alertcondition(short_condition, title="Sell Alert", message="Sell Signal: EMA Crossunder, RSI < 50, Volume > Avg, Bearish N-Bars")