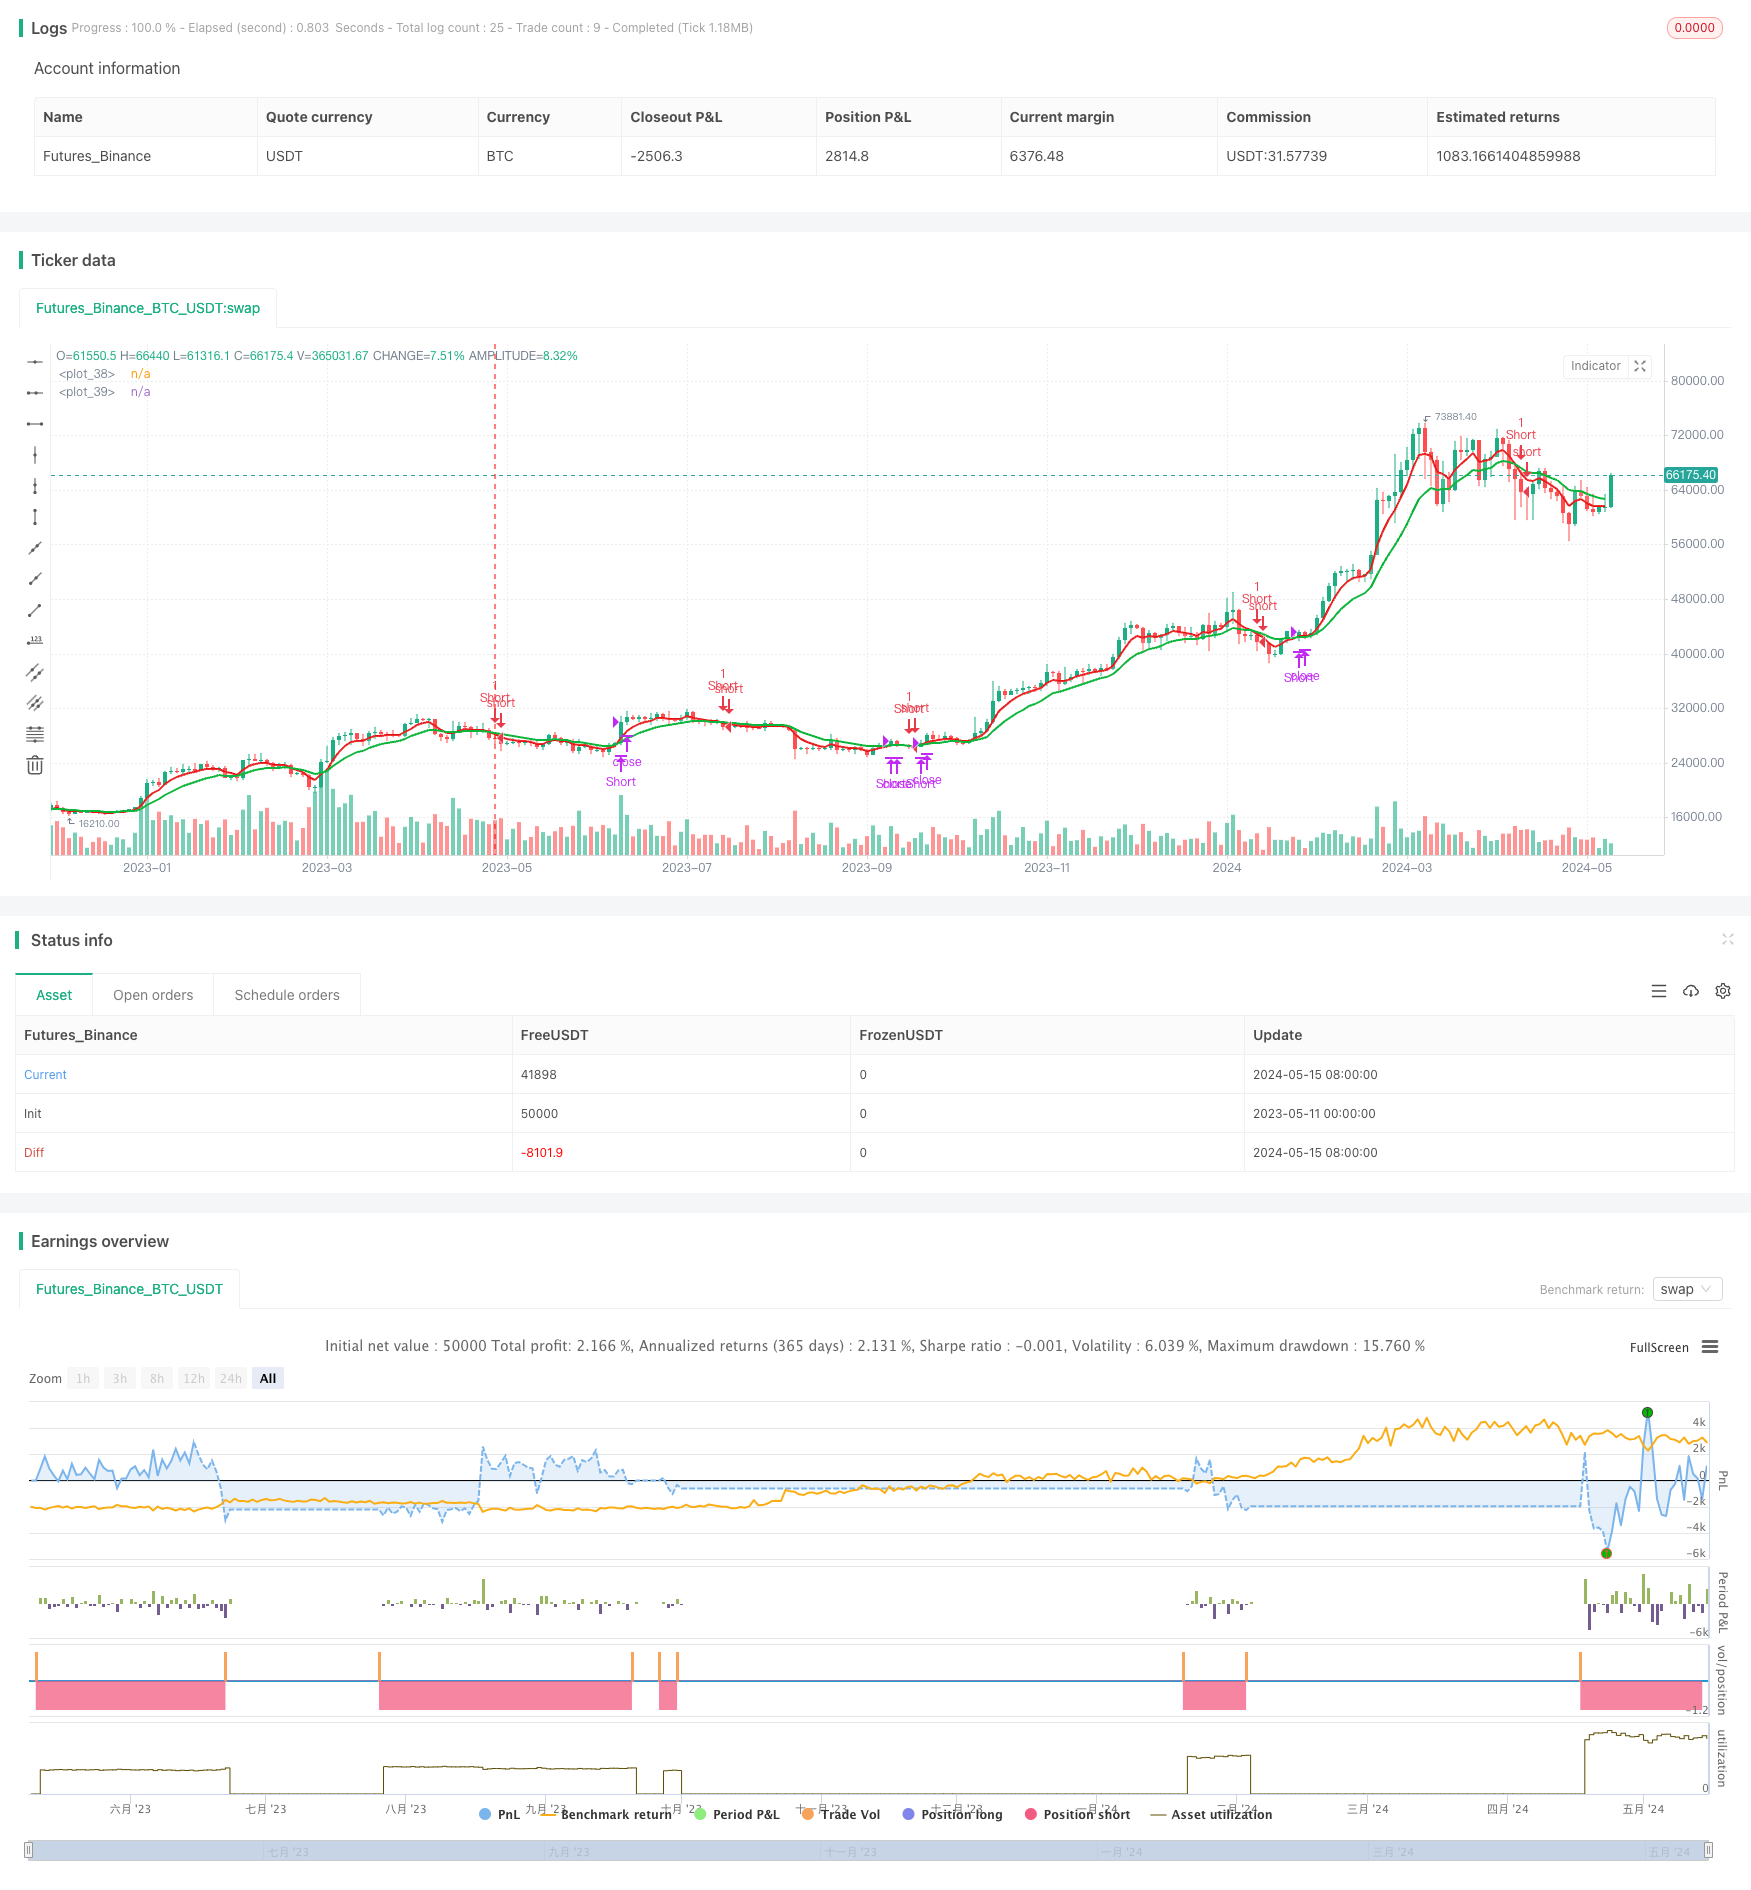
अवलोकन
यह रणनीति ट्रेडिंग सिग्नल उत्पन्न करने के लिए 5-दिवसीय इंडेक्स मूविंग एवरेज ((EMA5) और 13-दिवसीय इंडेक्स मूविंग एवरेज ((EMA13) के क्रॉस का उपयोग करती है। जब ईएमए 5 पर ईएमए 13 का क्रॉस होता है, तो एक मल्टी सिग्नल उत्पन्न होता है; जब ईएमए 5 के नीचे ईएमए 13 का क्रॉस होता है, तो एक रिक्त सिग्नल उत्पन्न होता है। यह रणनीति अल्पकालिक रुझान में परिवर्तन को पकड़ने के लिए बनाई गई है और दो चलती औसत के क्रॉस का उपयोग करके प्रवेश और निकास बिंदुओं को निर्धारित करने के लिए किया गया है।
रणनीति सिद्धांत
इस रणनीति का मूल व्यापार संकेत उत्पन्न करने के लिए दो अलग-अलग चक्रों के सूचकांक चलती औसत (ईएमए) के क्रॉसिंग का उपयोग करना है। ईएमए एक आम तौर पर इस्तेमाल किया जाने वाला तकनीकी संकेतक है, जो हाल के मूल्य डेटा को अधिक वजन देता है, इसलिए यह सरल चलती औसत (एसएमए) की तुलना में कीमतों में बदलाव को अधिक समय पर दर्शाता है। जब एक अल्पकालिक ईएमए (जैसे ईएमए 5) पर एक लंबी अवधि के ईएमए (जैसे ईएमए 13) के माध्यम से कीमतों में वृद्धि होती है, तो यह संकेत देता है कि यह अधिक संकेत देता है; इसके विपरीत, जब एक अल्पकालिक ईएमए नीचे एक लंबी अवधि के ईएमए के माध्यम से जाता है, तो यह संकेत देता है कि कीमतों में गिरावट बढ़ सकती है, एक खाली संकेत देता है।
रणनीतिक लाभ
- सरल और समझने में आसानः यह रणनीति केवल दो ईएमए संकेतकों का उपयोग करती है, सिद्धांत सरल है, इसे समझना और लागू करना आसान है।
- अनुकूलनशीलता: ईएमए के आवधिक मापदंडों को समायोजित करके, विभिन्न बाजार स्थितियों और ट्रेडिंग किस्मों के अनुकूल बनाया जा सकता है।
- उच्च समयबद्धताः ईएमए एसएमए की तुलना में कीमतों में बदलाव के लिए अधिक समय पर प्रतिक्रिया देता है, जिससे रुझान में बदलाव को जल्दी से पकड़ने में मदद मिलती है।
- स्केलेबिलिटीः इस रणनीति के आधार पर, अन्य तकनीकी संकेतकों या मौलिक कारकों के साथ गठबंधन किया जा सकता है ताकि रणनीति के प्रदर्शन को और अनुकूलित किया जा सके।
रणनीतिक जोखिम
- झूठे सिग्नलः जब बाजार में उतार-चढ़ाव होता है या प्रवृत्ति स्पष्ट नहीं होती है, तो ईएमए क्रॉसिंग अधिक झूठे सिग्नल उत्पन्न कर सकता है, जिससे अक्सर व्यापार होता है और धन की हानि होती है।
- विलंबता: हालांकि ईएमए एसएमए की तुलना में कम विलंबता है, फिर भी कुछ विलंबता है, जो सबसे अच्छा प्रवेश समय से चूक सकती है।
- स्टॉप लॉस की कमीः इस रणनीति में स्पष्ट स्टॉप लॉस शर्तें नहीं हैं, जो बाजार के उलट होने पर अधिक नुकसान का सामना कर सकती हैं।
- पैरामीटर अनुकूलनः ईएमए चक्र पैरामीटर की पसंद को विभिन्न बाजारों और किस्मों के अनुसार अनुकूलित करने की आवश्यकता होती है, अन्यथा यह रणनीति के प्रदर्शन को प्रभावित कर सकता है।
रणनीति अनुकूलन दिशा
- प्रवृत्ति फ़िल्टरिंग जोड़ेंः ईएमए क्रॉस सिग्नल के आधार पर, लंबे समय तक प्रवृत्ति संकेतक (जैसे ईएमए 50) के साथ संयोजन में प्रवृत्ति फ़िल्टरिंग, झूठे संकेतों को कम करने के लिए।
- स्टॉप-लॉस सेट करेंः एटीआर जैसे संकेतकों के आधार पर गतिशील स्टॉप-लॉस सेट करें, या एक निश्चित प्रतिशत स्टॉप-लॉस का उपयोग करें ताकि एक एकल लेनदेन के लिए अधिकतम नुकसान को नियंत्रित किया जा सके।
- ऑप्टिमाइज़ेशन पैरामीटरः ईएमए चक्र पैरामीटर को ऐतिहासिक डेटा पर वापस जाकर ऑप्टिमाइज़ करें ताकि वर्तमान बाजार और किस्मों के लिए सबसे उपयुक्त पैरामीटर का संयोजन मिल सके।
- अन्य संकेतकों के साथ संयोजनः संकेत की पुष्टि और विश्वसनीयता बढ़ाने के लिए अन्य तकनीकी संकेतकों (जैसे आरएसआई, एमएसीडी आदि) के साथ संयोजन में उपयोग किया जाता है।
संक्षेप
ईएमए 5 और ईएमए 13 क्रॉसिंग रणनीति एक सरल और आसान ट्रेंड ट्रैकिंग रणनीति है जो दो अलग-अलग चक्र ईएमए के क्रॉसिंग के माध्यम से मूल्य प्रवृत्ति में परिवर्तन को पकड़ती है। इस रणनीति का लाभ सरल, अनुकूलनशील और समय पर है, लेकिन साथ ही साथ झूठे संकेत, मंदी और स्टॉप की कमी जैसे जोखिम भी हैं। रणनीति के प्रदर्शन को और अनुकूलित करने के लिए, ट्रेंड फ़िल्टर को जोड़ने, स्टॉप, ऑप्टिमाइज़ेशन पैरामीटर सेट करने और अन्य तकनीकी संकेतक विधियों के साथ संयोजन करने पर विचार किया जा सकता है।
/*backtest
start: 2023-05-11 00:00:00
end: 2024-05-16 00:00:00
period: 2d
basePeriod: 1d
exchanges: [{"eid":"Futures_Binance","currency":"BTC_USDT"}]
*/

// This source code is subject to the terms of the Mozilla Public License 2.0 at https://mozilla.org/MPL/2.0/
// © Milankacha

//@version=5
strategy('5-13 EMA by Naimesh ver04', overlay=true)

qty = input(1, 'Buy quantity')

testStartYear = input(2021, 'Backtest Start Year')
testStartMonth = input(1, 'Backtest Start Month')
testStartDay = input(1, 'Backtest Start Day')
testStartHour = input(0, 'Backtest Start Hour')
testStartMin = input(0, 'Backtest Start Minute')
testPeriodStart = timestamp(testStartYear, testStartMonth, testStartDay, testStartHour, testStartMin)
testStopYear = input(2099, 'Backtest Stop Year')
testStopMonth = input(1, 'Backtest Stop Month')
testStopDay = input(30, 'Backtest Stop Day')
testPeriodStop = timestamp(testStopYear, testStopMonth, testStopDay, 0, 0)
testPeriodBackground = input(title='Color Background?', defval=true)
testPeriodBackgroundColor = testPeriodBackground and time >= testPeriodStart and time <= testPeriodStop ? #00FF00 : na
testPeriod() => true


ema1 = input(5, title='Select EMA 1')
ema2 = input(13, title='Select EMA 2')
//ema3 = input(50, title='Select EMA 3')
//SL = input(70, title='Stoploss')
//TR = input(250, title='Target')

expo = ta.ema(close, ema1)
ma = ta.ema(close, ema2)
//EMA_50 = ta.ema(close, ema3)

//avg_1 = avg (expo, ma)
//s2 = ta.cross(expo, ma) ? avg_1 : na
//plot(s2, style=plot.style_line, linewidth=3, color=color.red, transp=0)

p1 = plot(expo, color=color.rgb(231, 15, 15), linewidth=2)
p2 = plot(ma, color=#0db63a, linewidth=2)
fill(p1, p2, color=color.new(color.white, 80))

longCondition = ta.crossover(expo, ma)

shortCondition = ta.crossunder(expo, ma)


if testPeriod()
    //strategy.entry('Long', strategy.long, when=longCondition)
    strategy.entry('Short', strategy.short, when=expo<ma)

//strategy.close("Long", expo<ma, comment= 'SL hit')
strategy.close("Short", expo>ma, comment= 'SL hit')


//plotshape(longCondition and close>EMA_50, title='Buy Signal', text='B', textcolor=color.new(#FFFFFF, 0), style=shape.labelup, size=size.normal, location=location.belowbar, color=color.new(#1B8112, 0))
//plotshape(shortCondition and close<EMA_50, title='Sell Signal', text='S', textcolor=color.new(#FFFFFF, 0), style=shape.labeldown, size=size.normal, location=location.abovebar, color=color.new(#FF5733, 0))