चलती औसत, समर्थन/प्रतिरोध और वॉल्यूम पर आधारित उन्नत प्रवेश रणनीति
लेखक:चाओझांग, दिनांकः 2024-06-14 15:40:46टैगः

अवलोकन
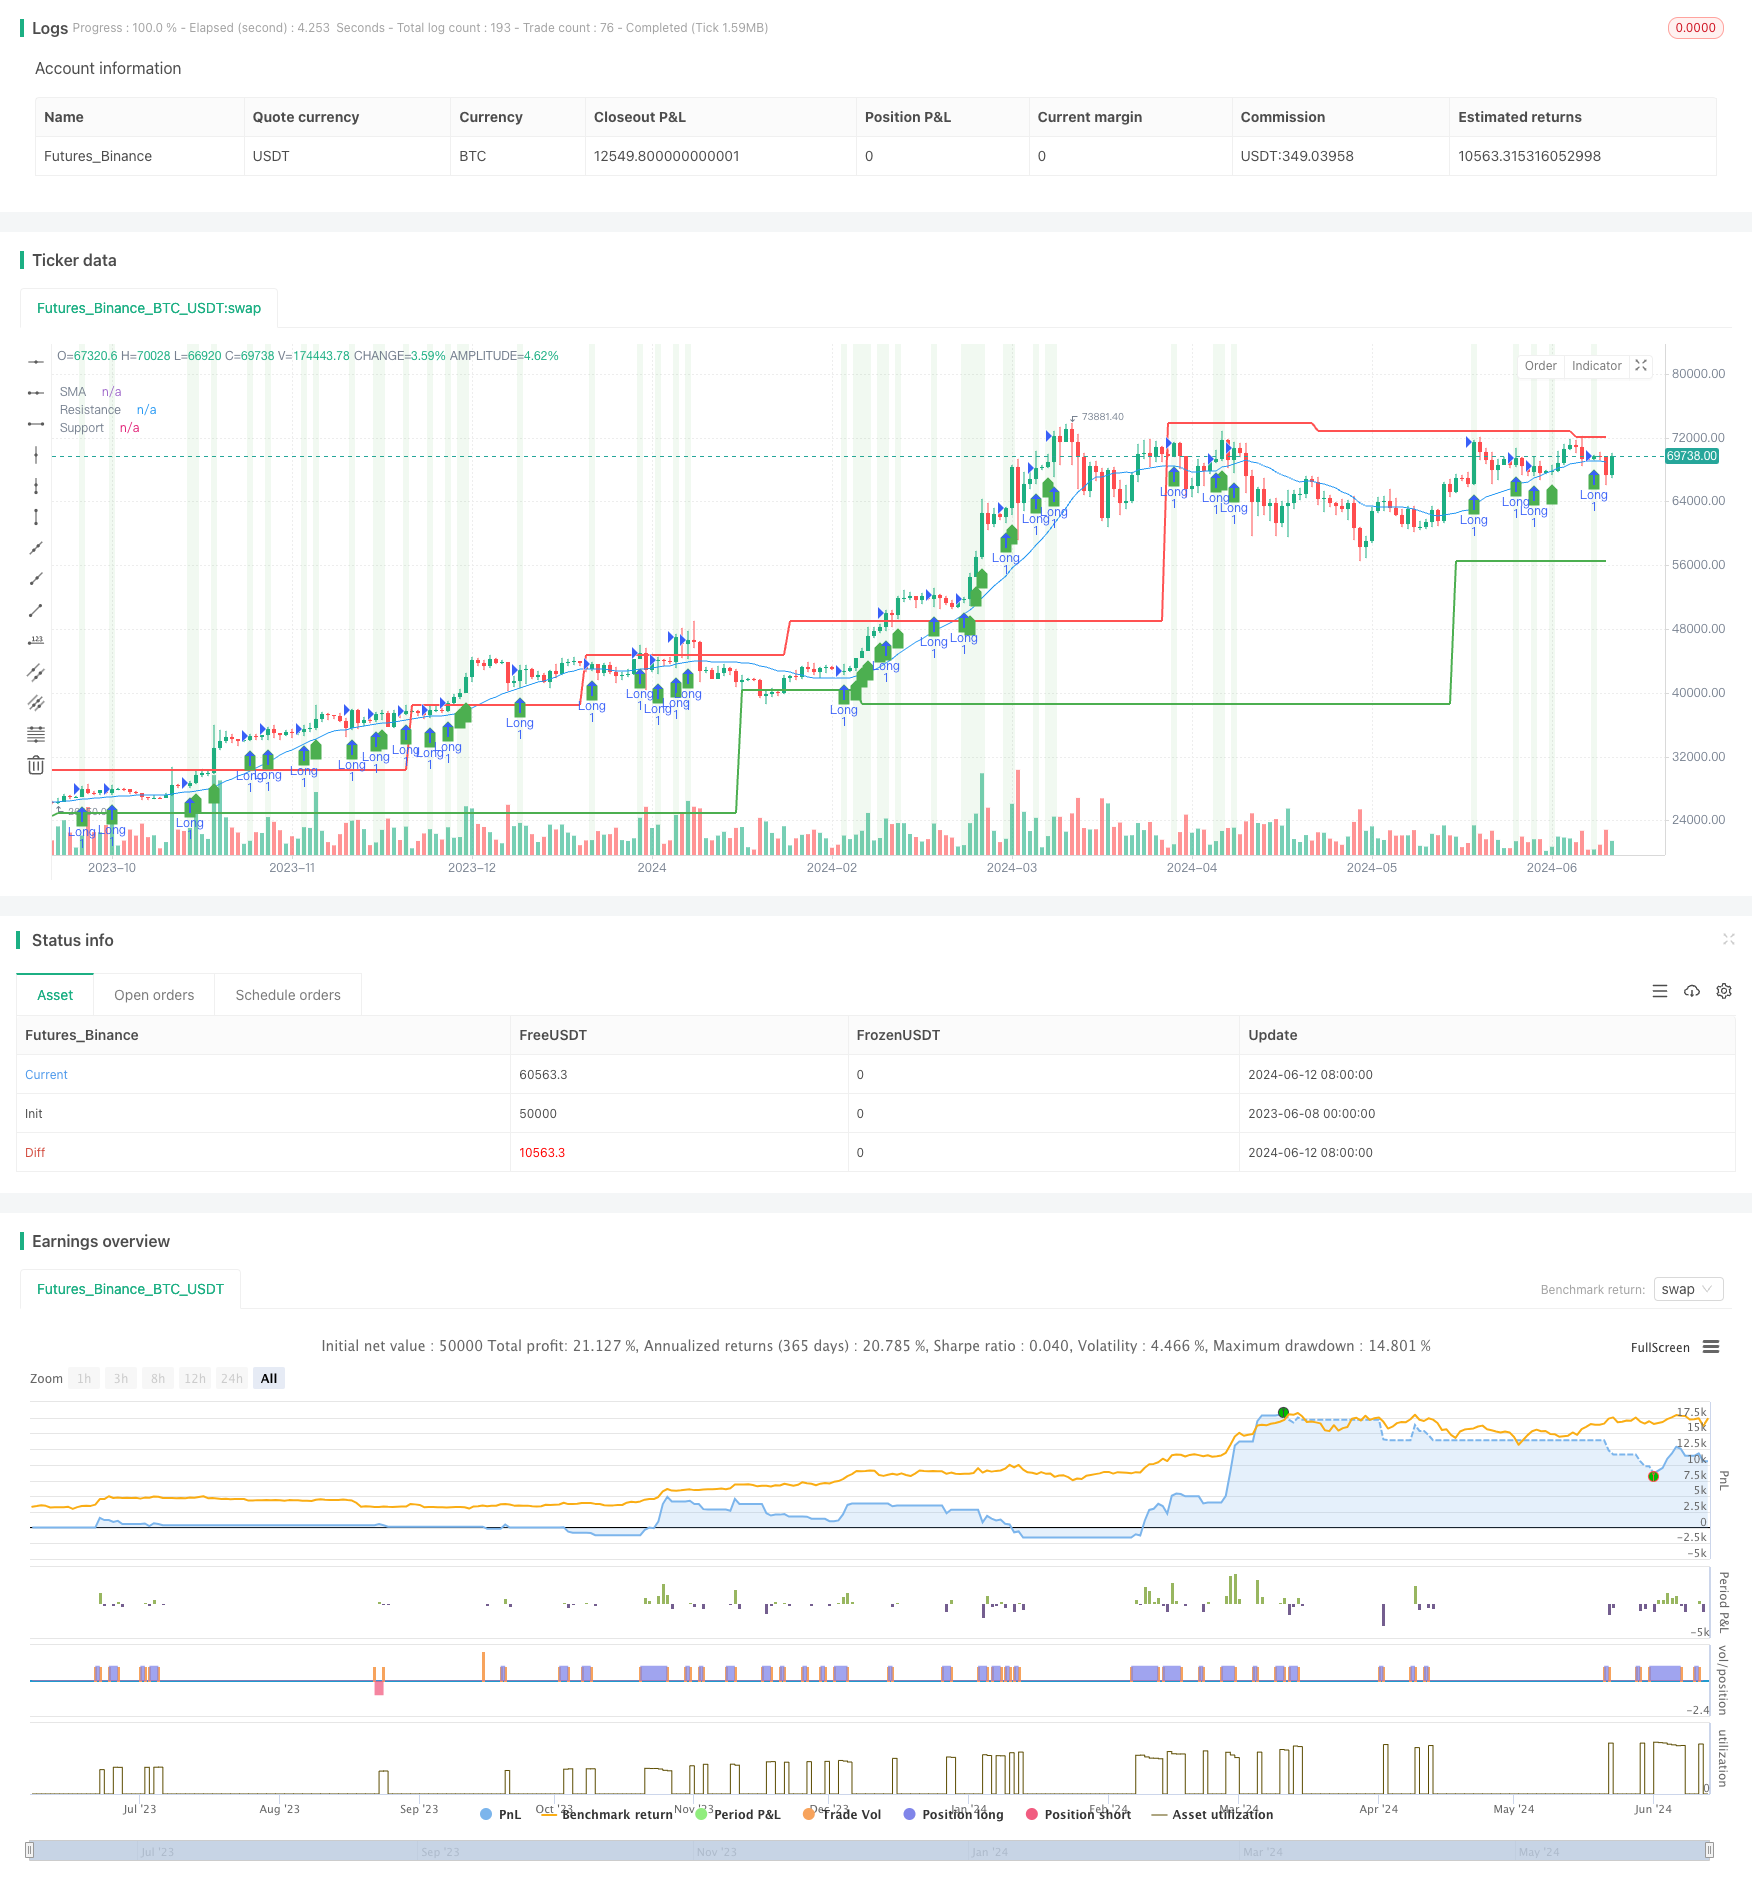
यह रणनीति तीन तकनीकी संकेतकों को जोड़ती हैः सरल चलती औसत (एसएमए), समर्थन और प्रतिरोध स्तर, और एक व्यापक ट्रेडिंग रणनीति का निर्माण करने के लिए व्यापारिक मात्रा में वृद्धि। रणनीति का मुख्य विचार तब ट्रेडों में प्रवेश करना है जब कीमत एसएमए, समर्थन / प्रतिरोध स्तरों को तोड़ती है, और जोखिम को नियंत्रित करने के लिए स्टॉप-लॉस शर्तें निर्धारित करते हुए, व्यापारिक मात्रा में वृद्धि के साथ होता है।
रणनीतिक सिद्धांत
- एक निर्दिष्ट अवधि के लिए एसएमए, समर्थन और प्रतिरोध स्तरों की गणना करें।
- यह निर्धारित करें कि क्या पिछले अवधि की तुलना में वर्तमान व्यापारिक मात्रा में वृद्धि हुई है।
- लंबी प्रविष्टि की स्थितिः वर्तमान समापन मूल्य पिछली अवधि की समापन मूल्य से अधिक है, एसएमए और समर्थन स्तर से अधिक है, और मूल्य प्रतिरोध स्तर से एक निश्चित दूरी पर है, व्यापार की मात्रा में वृद्धि के साथ।
- शॉर्ट एंट्री कंडीशनः वर्तमान समापन मूल्य पिछली अवधि की समापन मूल्य से कम है, एसएमए और समर्थन स्तर से कम है, और मूल्य प्रतिरोध स्तर से एक निश्चित दूरी पर है, व्यापार की मात्रा में वृद्धि के साथ।
- स्टॉप-लॉस की शर्तः लॉन्ग स्टॉप-लॉस की कीमत प्रवेश मूल्य गुणा (1 - स्टॉप-लॉस प्रतिशत) और शॉर्ट स्टॉप-लॉस की कीमत प्रवेश मूल्य गुणा (1 + स्टॉप-लॉस प्रतिशत) है।
लाभ विश्लेषण
- कई तकनीकी संकेतकों के संयोजन से रणनीति की विश्वसनीयता और स्थिरता में सुधार होता है।
- एसएमए के मूल्य ब्रेकआउट और समर्थन/प्रतिरोध स्तर दोनों को ध्यान में रखते हुए प्रवृत्ति के अवसरों को बेहतर ढंग से पकड़ने की अनुमति मिलती है।
- ट्रेडिंग वॉल्यूम सूचक की शुरूआत से यह सुनिश्चित होता है कि मूल्य ब्रेकआउट के साथ पर्याप्त बाजार भागीदारी हो, जिससे संकेतों की प्रभावशीलता बढ़े।
- स्टॉप-लॉस की शर्तें निर्धारित करने से ट्रेडिंग जोखिम को प्रभावी ढंग से नियंत्रित किया जा सकता है।
जोखिम विश्लेषण
- समर्थन और प्रतिरोध स्तरों की गणना ऐतिहासिक आंकड़ों पर आधारित होती है और महत्वपूर्ण बाजार उतार-चढ़ाव के दौरान प्रभावशीलता खो सकती है।
- ट्रेडिंग वॉल्यूम सूचक में असामान्य उतार-चढ़ाव हो सकता है जिससे झूठे संकेत मिल सकते हैं।
- स्टॉप-लॉस की शर्त पूरी तरह से चरम बाजार स्थितियों में घाटे से बच नहीं सकती है।
अनुकूलन दिशा
- व्यापार संकेतों की विश्वसनीयता को और अधिक सत्यापित करने के लिए अन्य तकनीकी संकेतकों, जैसे कि सापेक्ष शक्ति सूचकांक (आरएसआई) या चलती औसत अभिसरण विचलन (एमएसीडी) को पेश करने पर विचार करें।
- समर्थन और प्रतिरोध स्तरों के लिए गणना विधि को अनुकूलित करना, जैसे कि विभिन्न बाजार स्थितियों के अनुकूल एक अधिक गतिशील दृष्टिकोण को अपनाना।
- रणनीति पर असामान्य उतार-चढ़ाव के प्रभाव को कम करने के लिए ट्रेडिंग वॉल्यूम सूचक को सुचारू करें।
- स्टॉप-लॉस की शर्तों को अनुकूलित करना, जैसे कि स्टॉप-लॉस का उपयोग करना या बाजार की अस्थिरता के आधार पर स्टॉप-लॉस प्रतिशत को गतिशील रूप से समायोजित करना।
सारांश
यह रणनीति एक व्यापक ट्रेडिंग रणनीति बनाने के लिए एसएमए, समर्थन और प्रतिरोध स्तर, और ट्रेडिंग वॉल्यूम संकेतकों को जोड़ती है। रणनीति का लाभ ट्रेडिंग जोखिम को नियंत्रित करते हुए रुझान के अवसरों को पकड़ने की क्षमता में निहित है। हालांकि, रणनीति में कुछ सीमाएं भी हैं, जैसे कि चरम बाजार स्थितियों में इसकी अनुकूलन क्षमता में सुधार की आवश्यकता है। भविष्य में, रणनीति को अन्य तकनीकी संकेतकों को पेश करके, समर्थन और प्रतिरोध स्तरों के लिए गणना विधि को अनुकूलित करके, ट्रेडिंग वॉल्यूम संकेतक को चिकना करके, और इसकी स्थिरता और लाभप्रदता को बढ़ाने के लिए स्टॉप-लॉस स्थितियों को अनुकूलित करके सुधार किया जा सकता है।
/*backtest
start: 2023-06-08 00:00:00
end: 2024-06-13 00:00:00
period: 1d
basePeriod: 1h
exchanges: [{"eid":"Futures_Binance","currency":"BTC_USDT"}]
*/

//@version=4
strategy("Advanced Entry Conditions with Support/Resistance, SMA, and Volume", overlay=true)

// Inputs
length = input(20, title="SMA Length")
stopLossPerc = input(1, title="Stop Loss Percentage", type=input.float) / 100
leftBars = input(15, title="Left Bars")
rightBars = input(15, title="Right Bars")
distanceThresh = input(1, title="Distance Threshold from Support/Resistance", type=input.float) / 100

// Calculations
smaValue = sma(close, length)
highUsePivot = fixnan(pivothigh(leftBars, rightBars)[1])
lowUsePivot = fixnan(pivotlow(leftBars, rightBars)[1])

// Volume Calculation
volumeIncrease = volume > volume[1]

// Entry Conditions
longEntryCondition = close[0] > close[1] and close[1] > smaValue and close[0] > smaValue and close[0] > lowUsePivot and close[1] > lowUsePivot and abs(close[0] - highUsePivot) > distanceThresh and volumeIncrease
shortEntryCondition = close[0] < close[1] and close[1] < smaValue and close[0] < smaValue and close[0] < lowUsePivot and close[1] < lowUsePivot and abs(close[0] - highUsePivot) > distanceThresh and volumeIncrease

// Calculate stop loss levels
longStopLoss = close * (1 - stopLossPerc)
shortStopLoss = close * (1 + stopLossPerc)

// Strategy Logic
strategy.entry("Long", strategy.long, when=longEntryCondition)
strategy.exit("Exit Long", "Long", stop=longStopLoss)

strategy.entry("Short", strategy.short, when=shortEntryCondition)
strategy.exit("Exit Short", "Short", stop=shortStopLoss)

// Plotting
plot(smaValue, color=color.blue, title="SMA")
plot(highUsePivot, color=color.red, linewidth=2, title="Resistance")
plot(lowUsePivot, color=color.green, linewidth=2, title="Support")

plotshape(series=longEntryCondition, location=location.belowbar, color=color.green, style=shape.labelup, title="Long Entry")
plotshape(series=shortEntryCondition, location=location.abovebar, color=color.red, style=shape.labeldown, title="Short Entry")

// Background Color
bgcolor(longEntryCondition ? color.new(color.green, 90) : shortEntryCondition ? color.new(color.red, 90) : na)
- दोहरी चलती औसत क्रॉसओवर, आरएसआई और स्टोकास्टिक संकेतकों पर आधारित अल्पकालिक मात्रात्मक व्यापार रणनीति
- आरएसआई निम्न बिंदु रिवर्स रणनीति
- फिशर ट्रांसफॉर्म डायनेमिक थ्रेशोल्ड ट्रेंड रणनीति का पालन करना
- औसत प्रतिवर्तन रणनीति
- EMA100 और NUPL सापेक्ष अव्यवस्थित लाभ मात्रात्मक ट्रेडिंग रणनीति
- स्टोकास्टिक ऑसिलेटर पर आधारित अस्थिरता रेंज ट्रेडिंग रणनीति
- सरल संयुक्त रणनीतिः पिवोट पॉइंट सुपरट्रेंड और डीईएमए
- ईएमए ट्रेंड फिल्टर रणनीति
- चलती औसत क्रॉसओवर रणनीति
- 3-मिनट की मोमबत्ती उच्च निम्न बिंदुओं के आधार पर इंट्राडे ब्रेकआउट रणनीति
- ईएमए आरएसआई एमएसीडी डायनेमिक टेक प्रॉफिट और स्टॉप लॉस ट्रेडिंग रणनीति
- जी-ट्रेंड ईएमए एटीआर बुद्धिमान ट्रेडिंग रणनीति
- 200-दिवसीय मूविंग एवरेज और स्टोकैस्टिक ऑसिलेटर पर आधारित रणनीति का अनुसरण करने वाली प्रवृत्ति
- आरएसआई रुझान रणनीति
- ईएमए क्रॉसओवर मोमेंटम स्केल्पिंग रणनीति
- बीबी ब्रेकआउट रणनीति
- वीडब्ल्यूएपी और आरएसआई डायनेमिक बोलिंगर बैंड्स लाभ और स्टॉप लॉस रणनीति लेते हैं
- चांडे-क्रॉल स्टॉप डायनेमिक एटीआर ट्रेंड रणनीति का पालन करना
- यह रणनीति चाइकिन मनी फ्लो (सीएमएफ) के आधार पर ट्रेडिंग सिग्नल उत्पन्न करती है
- ट्रेंड फ़िल्टर्ड पिन बार रिवर्स रणनीति