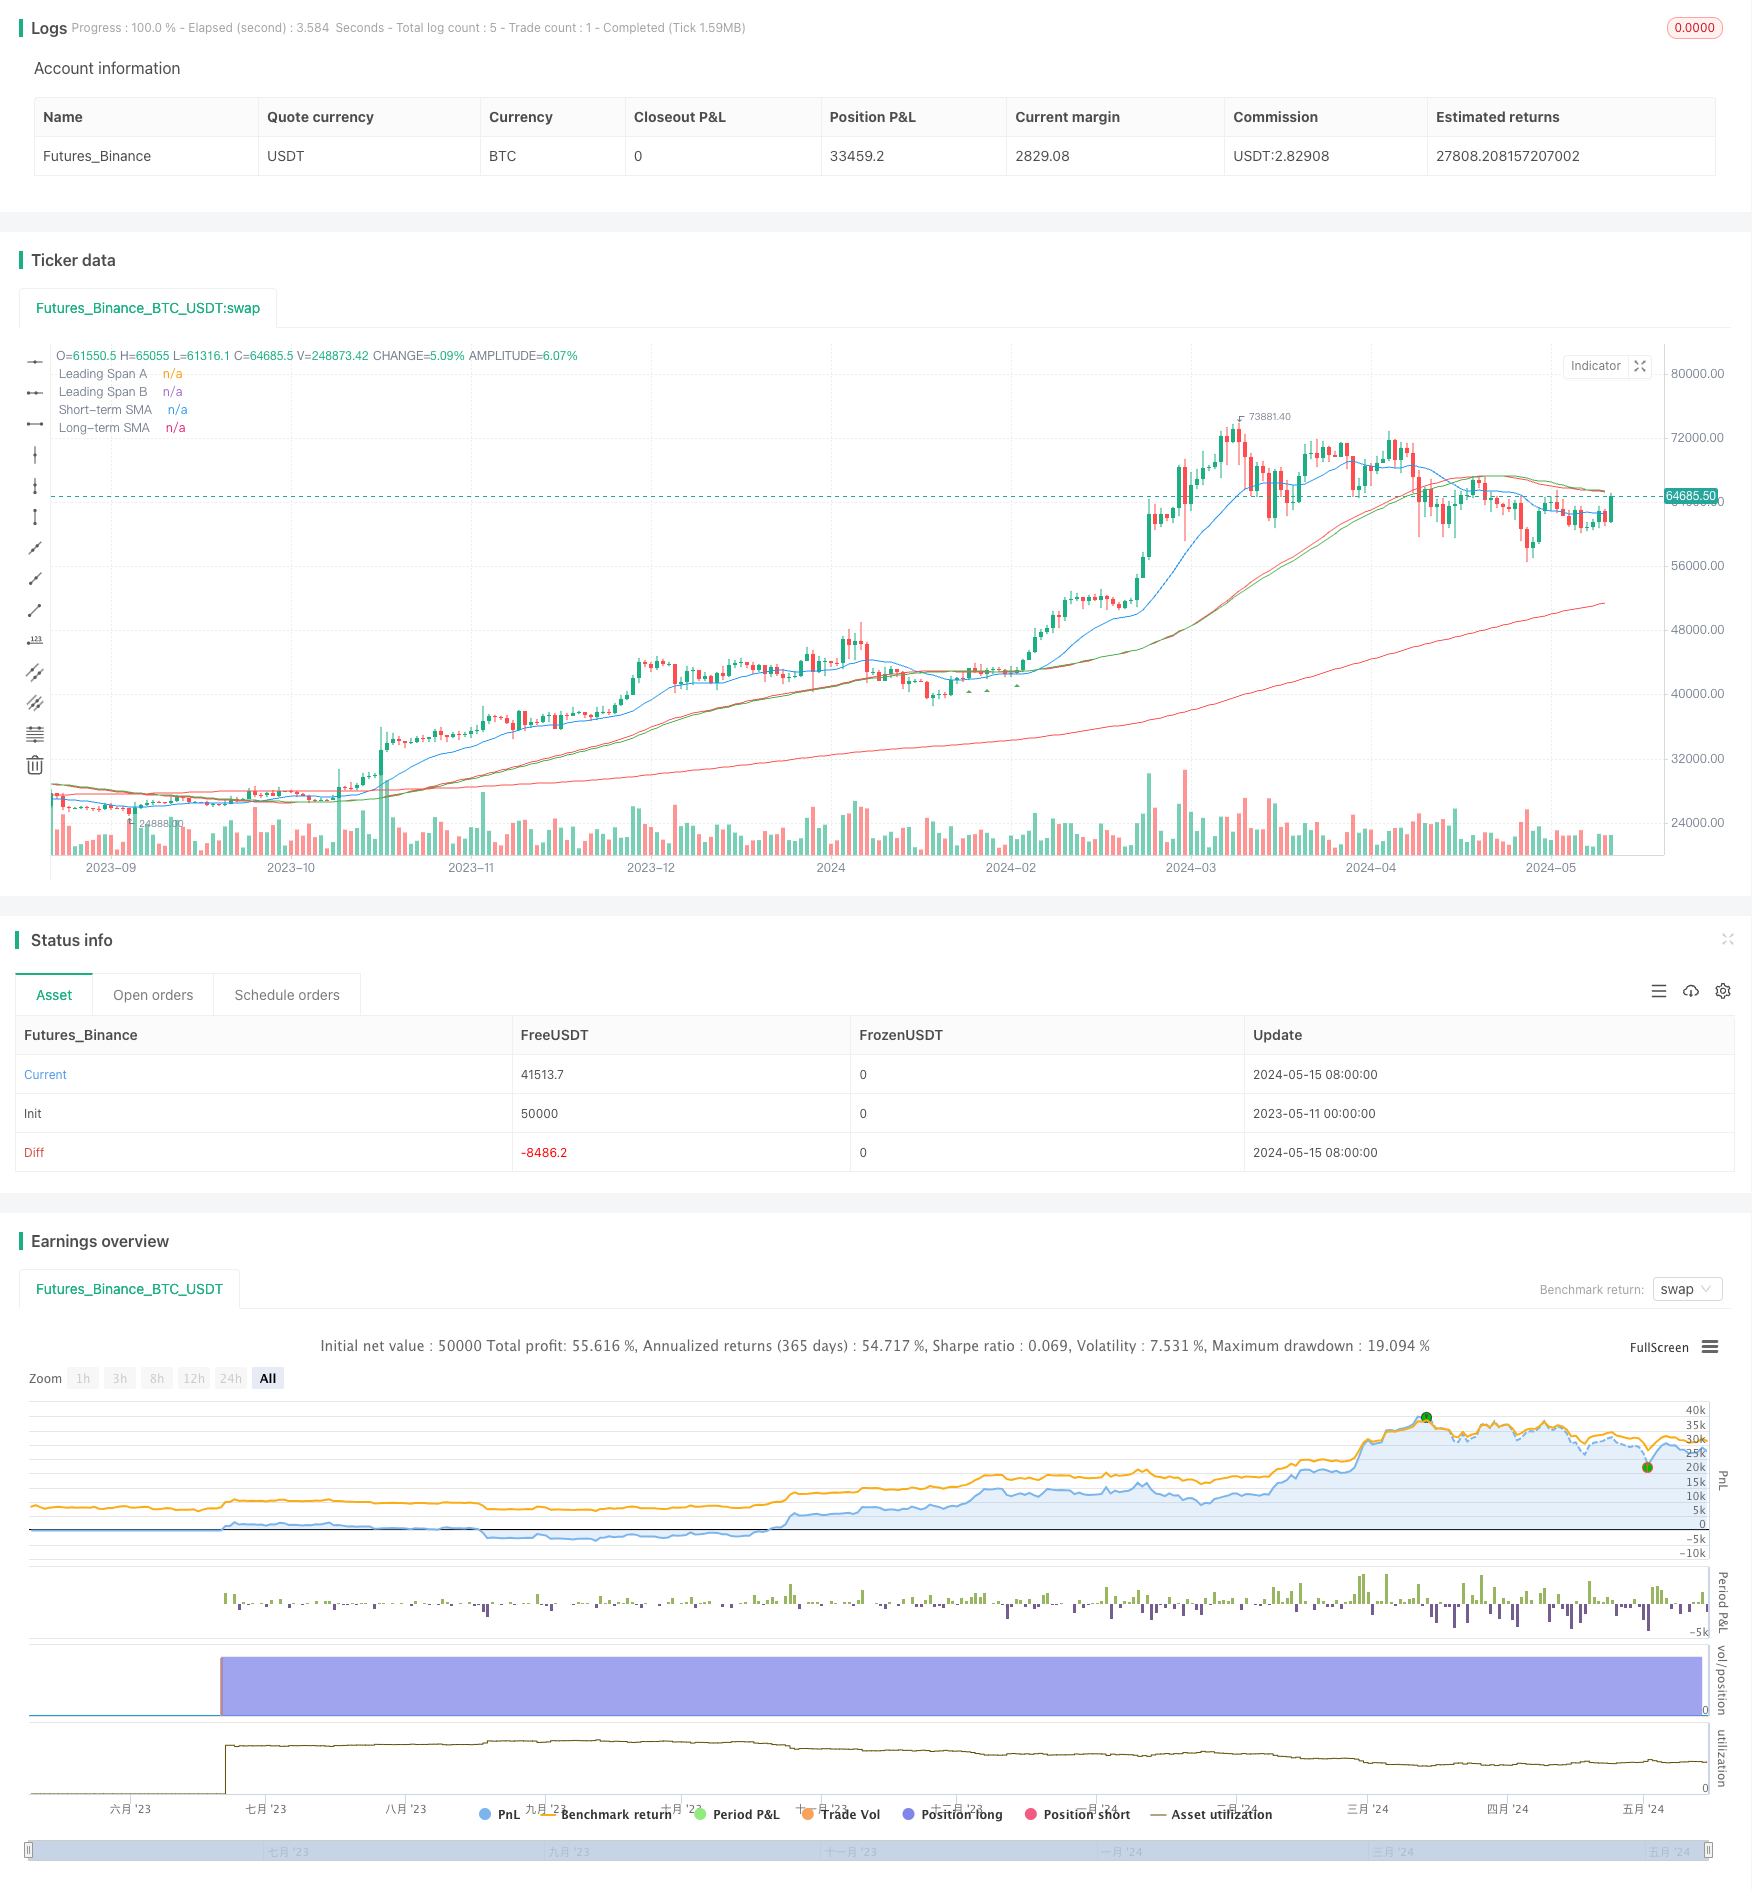
Ichimoku Cloud dan Moving Average Strategy
Penulis:ChaoZhang, Tanggal: 2024-05-17 10:55:29Tag:MASMAICHIMOKU

Gambaran umum
Strategi ini menggabungkan Ichimoku Cloud, jangka pendek (55) dan jangka panjang (200) Simple Moving Averages (SMA) untuk mengidentifikasi sinyal beli dan jual potensial. Sinyal beli mengharuskan harga berada di atas awan dan SMA jangka panjang, dan untuk menguji ulang SMA jangka pendek setelah melintasi di atasnya. Sinyal jual mengharuskan harga berada di bawah awan dan SMA jangka panjang, dan untuk menguji ulang SMA jangka pendek setelah melintasi di bawahnya. Strategi ini menghindari menghasilkan sinyal selama pasar berkisar atau acara berita tinggi, karena periode ini cenderung memiliki lebih banyak fake-out.
Prinsip Strategi
Strategi ini didasarkan pada prinsip-prinsip berikut:
- Ketika harga berada di atas awan dan SMA jangka panjang, pasar berada dalam tren naik.
- Ketika harga di bawah awan dan SMA jangka panjang, pasar berada dalam tren penurunan.
- Crossover SMA jangka pendek mengkonfirmasi tren, dan pengujian ulang SMA jangka pendek memberikan peluang masuk berisiko rendah.
- Berbagai pasar dan acara berita utama memiliki lebih banyak pemalsuan dan harus dihindari.
Kode ini terlebih dahulu menghitung komponen Ichimoku Cloud yang diperlukan (Lini Konversi, Garis Dasar, Leading Span A dan B), serta SMA jangka pendek dan jangka panjang.
Keuntungan Strategi
- Menggabungkan beberapa indikator untuk mengkonfirmasi tren, meningkatkan keandalan sinyal. Ichimoku Cloud menyaring kebisingan, sementara SMA crossover mengkonfirmasi tren.
- Mencari peluang masuk berisiko rendah pada uji ulang rata-rata bergerak dalam tren yang dikonfirmasi.
- Lebih lanjut mengurangi risiko pemalsuan dengan menghindari perdagangan selama pasar yang berbeda dan acara berita utama.
- Cocok untuk perdagangan jangka menengah hingga panjang pada jangka waktu 1 jam dan 2 jam, menangkap tren besar dengan potensi keuntungan yang besar.
Risiko Strategi
- Meskipun crossover rata-rata bergerak dan cloud breakout menegaskan tren, mereka masih tertinggal.
- Kondisi saat ini berfokus pada waktu masuk tetapi tidak mendefinisikan titik keluar tertentu.
- Pilihan parameter bersifat subjektif dan tidak pasti. Pilihan yang berbeda dari parameter awan, panjang rata-rata bergerak, dll akan mempengaruhi kinerja strategi.
Arah Optimasi Strategi
- Memperkenalkan tingkat stop loss yang jelas, seperti pelanggaran tinggi/rendah sebelumnya, kelipatan ATR, dll., untuk mengurangi risiko perdagangan tunggal.
- Referensi silang dengan indikator konfirmasi tren lainnya, seperti MACD, DMI, dll, untuk membentuk kombinasi sinyal yang lebih kuat.
- Mengoptimalkan parameter untuk menemukan kombinasi terbaik yang meningkatkan kemampuan strategi untuk beradaptasi dengan berbagai kondisi pasar.
- Membedakan antara pasar tren dan rentang, secara aktif masukkan posisi dalam tren sambil mengurangi frekuensi perdagangan dalam rentang.
Ringkasan
/*backtest
start: 2023-05-11 00:00:00
end: 2024-05-16 00:00:00
period: 1d
basePeriod: 1h
exchanges: [{"eid":"Futures_Binance","currency":"BTC_USDT"}]
*/

//@version=5
strategy("Ichimoku Cloud and Moving Average Strategy", shorttitle="ICMA", overlay=true)

// Input parameters
shortMA = input.int(55, title="Short-term Moving Average Length")
longMA = input.int(200, title="Long-term Moving Average Length")

// Calculate moving averages
shortSMA = ta.sma(close, shortMA)
longSMA = ta.sma(close, longMA)

// Ichimoku Cloud settings
conversionPeriod = input.int(9, title="Conversion Line Period")
basePeriod = input.int(26, title="Base Line Period")
spanBPeriod = input.int(52, title="Span B Period")
displacement = input.int(26, title="Displacement")

// Calculate Ichimoku Cloud components
conversionLine = ta.sma(high + low, conversionPeriod) / 2
baseLine = ta.sma(high + low, basePeriod) / 2
leadSpanA = (conversionLine + baseLine) / 2
leadSpanB = ta.sma(high + low, spanBPeriod) / 2

// Plot Ichimoku Cloud components
plot(leadSpanA, color=color.blue, title="Leading Span A")
plot(leadSpanB, color=color.red, title="Leading Span B")

// Entry conditions
aboveCloud = close > leadSpanA and close > leadSpanB
belowCloud = close < leadSpanA and close < leadSpanB
aboveShortMA = close > shortSMA
aboveLongMA = close > longSMA
belowShortMA = close < shortSMA
belowLongMA = close < longSMA

// Buy condition (Price retests 55 moving average after being above it)
buyCondition = aboveCloud and aboveLongMA and close[1] < shortSMA and close > shortSMA

// Sell condition (Price retests 55 moving average after being below it)
sellCondition = belowCloud and belowLongMA and close[1] > shortSMA and close < shortSMA

// Strategy entry and exit
strategy.entry("Buy", strategy.long, when = buyCondition)
strategy.entry("Sell", strategy.short, when = sellCondition)

// Plot moving averages
plot(shortSMA, color=color.green, title="Short-term SMA")
plot(longSMA, color=color.red, title="Long-term SMA")

// Plot buy and sell signals
plotshape(series=buyCondition, style=shape.triangleup, location=location.belowbar, color=color.green, size=size.small, title="Buy Signal")
plotshape(series=sellCondition, style=shape.triangledown, location=location.abovebar, color=color.red, size=size.small, title="Sell Signal")
- MA, SMA, MA Slope, Trailing Stop Loss, Re-Entry
- Strategi perdagangan SMA Dual Moving Average
- Cloud Momentum Crossover Strategy dengan Moving Averages dan Volume Konfirmasi
- Strategi Manajemen Risiko Adaptif Berdasarkan Rata-rata Bergerak Gelas Emas Ganda
- Strategi crossover rata-rata bergerak berdasarkan rata-rata bergerak ganda
- Strategi lintas MA
- MA,SMA Dual Moving Average Crossover Strategi
- Moving Average Crossover dengan Strategi Multiple Take Profits
- Strategi Crossover Rata-rata Bergerak Ganda
- Strategi Crossover Rata-rata Bergerak
- Strategi Penembusan Volatilitas Reverse
- Nifty 50 3 Menit Pembukaan Rentang Breakout Strategi
- Strategi Stop Loss dan Take Profit Bollinger Bands yang Dinamis
- Strategi Swing High/Low Breakout yang Ditingkatkan dengan Pola Bullish dan Bearish Engulfing
- Laguerre RSI dengan Strategi Sinyal Perdagangan Difilter ADX
- Harga dan Volume Breakout Strategi Beli
- K Lilin Berturut-turut Bull Bear Strategi
- Strategi Crossover Super Moving Average dan Upperband
- Tren multi-faktor Mengikuti Strategi Perdagangan Kuantitatif Berdasarkan RSI, ADX, dan Ichimoku Cloud
- Strategi RSI dan MACD yang Dikombinasikan
- William Alligator Moving Average Trend Catcher Strategi
- Dinamis MACD dan Ichimoku Cloud Trading Strategy
- Strategi Penolakan MA dengan Filter ADX
- Strategi Bollinger Bands: Perdagangan presisi untuk keuntungan maksimum
- Strategi Breakout Rata-rata ATR
- Strategi Pembelajaran Mesin KNN: Sistem Perdagangan Prediksi Tren Berdasarkan Algoritma Tetangga terdekat K
- Strategi perdagangan dua arah CCI+RSI+KC Trend Filter
- BMSB Breakout Strategi
- SR Strategi Breakout
- Bollinger Bands Dinamis Breakout Strategi