移动平均线交叉多层获利策略
Author: ChaoZhang, Date: 2024-04-26 15:16:12Tags: SMAMA
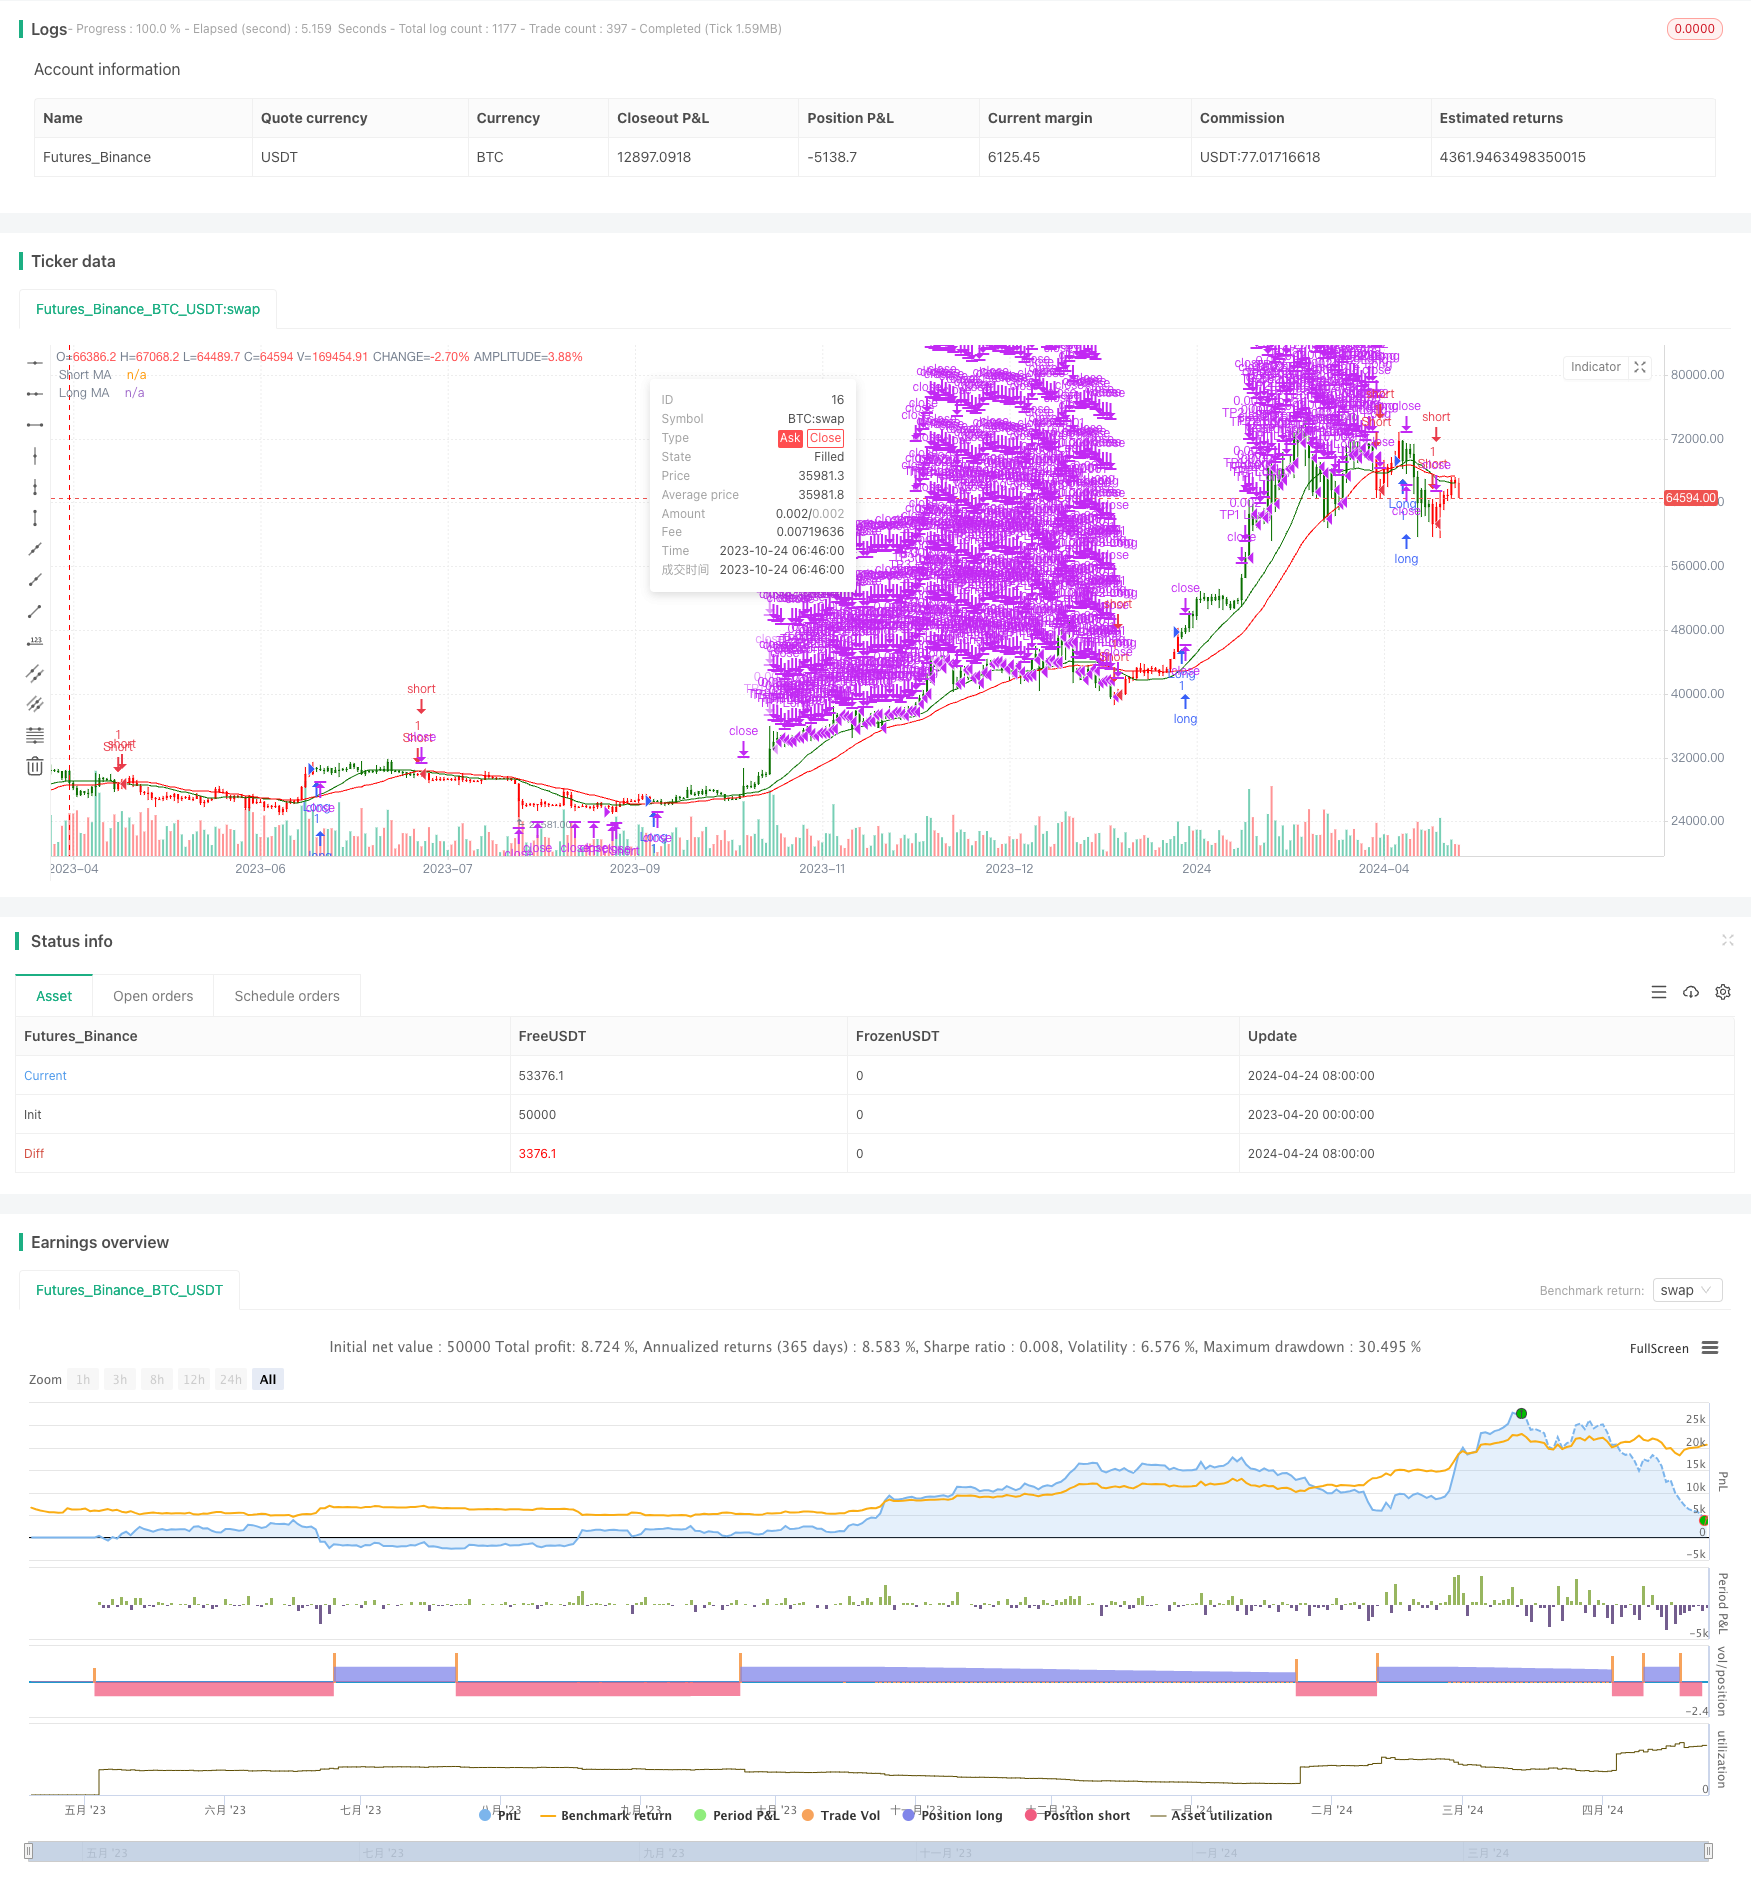
概述
该策略利用两条移动平均线的交叉来判断市场趋势,当短期移动平均线上穿长期移动平均线时开多仓,反之开空仓。同时,该策略采用了多级获利了结的方式,在价格达到预设的获利水平时,分批次平仓,从而最大化收益和控制风险。
策略原理
该策略的核心是利用不同周期的移动平均线来捕捉市场趋势。当短期移动平均线上穿长期移动平均线时,意味着市场可能进入上升趋势,此时开多仓;当短期移动平均线下穿长期移动平均线时,意味着市场可能进入下降趋势,此时开空仓。同时,该策略设置了多个获利水平,当价格达到这些水平时,会按预设的仓位比例平仓,这样可以在趋势持续时获得更多收益,同时也控制了风险。
策略优势
- 简单有效:该策略基于经典的移动平均线交叉原理,简单易懂,同时在实践中也证明了其有效性。
- 多级获利了结:通过设置多个获利水平,并在价格达到这些水平时分批次平仓,可以最大化收益,同时也控制了风险。
- 参数灵活:该策略的参数设置非常灵活,用户可以根据自己的需求和市场特点,调整移动平均线周期和获利水平,以达到最佳效果。
策略风险
- 市场波动风险:当市场出现剧烈波动时,频繁的交叉信号可能导致策略频繁交易,增加了交易成本和回撤风险。
- 参数设置风险:不恰当的参数设置可能导致策略表现不佳,比如移动平均线周期选择不当,或者获利水平设置不合理等。
- 趋势识别风险:该策略主要依赖于趋势,在震荡市或者趋势不明朗时,可能会出现较多的假信号,导致亏损。
策略优化方向
- 结合其他指标:可以考虑结合其他技术指标,如RSI、MACD等,以提高趋势识别的准确性和可靠性。
- 优化参数:可以通过回测和优化,寻找最佳的移动平均线周期和获利水平参数,以适应不同的市场状况。
- 加入止损:可以考虑加入止损机制,以进一步控制风险,例如根据ATR设置动态止损等。
- 改进入场和出场:可以探索更多的入场和出场条件,如考虑交易量、支撑阻力等因素,以提高策略的稳健性。
总结
移动平均线交叉多层获利策略是一个简单有效的趋势跟踪策略,通过多级获利了结的方式,可以在趋势中获得更多收益,同时控制风险。但是,该策略也存在一些局限性和风险,需要根据具体市场状况和用户需求进行优化和改进。总的来说,该策略可以作为一个有效的交易工具,但不能完全依赖,需要与其他分析方法和风险管理措施相结合,以达到最佳效果。
/*backtest
start: 2023-04-20 00:00:00
end: 2024-04-25 00:00:00
period: 1d
basePeriod: 1h
exchanges: [{"eid":"Futures_Binance","currency":"BTC_USDT"}]
*/

// This Pine Script™ code is subject to the terms of the Mozilla Public License 2.0 at https://mozilla.org/MPL/2.0/
// © ValdesTradingBots

//Follow Us for More Insights and Updates!

//Join our community and be the first to know about our new releases and trading tips

//Facebook Group: Join our vibrant community at https://www.facebook.com/groups/707469081464839/
//Twitter: Follow us for quick updates and insights at https://twitter.com/ValdesBots

//We're excited to have you with us!

//@version=5
strategy("Valdes Trading Bots MA Cross with Multiple Take Profits", overlay=true)

shortPeriod = input(18, title="Short MA Period")
longPeriod = input(32, title="Long MA Period")

// Take Profit Settings
tp1Enabled = input(true, title="Enable Take Profit 1")
tp1Perc = input(15, title="Take Profit 1 (%)") / 100
tp1QtyPerc = input(25, title="Take Profit 1 Qty (%)") / 100

tp2Enabled = input(true, title="Enable Take Profit 2")
tp2Perc = input(30, title="Take Profit 2 (%)") / 100
tp2QtyPerc = input(25, title="Take Profit 2 Qty (%)") / 100

tp3Enabled = input(true, title="Enable Take Profit 3")
tp3Perc = input(45, title="Take Profit 3 (%)") / 100
tp3QtyPerc = input(25, title="Take Profit 3 Qty (%)") / 100

tp4Enabled = input(true, title="Enable Take Profit 4")
tp4Perc = input(60, title="Take Profit 4 (%)") / 100
tp4QtyPerc = input(25, title="Take Profit 4 Qty (%)") / 100

shortMA = ta.sma(close, shortPeriod)
longMA = ta.sma(close, longPeriod)

// Determine the trend
uptrend = shortMA > longMA
downtrend = shortMA < longMA

// Assign candle colors based on the trend
candleColor = uptrend ? color.rgb(9, 112, 0) : downtrend ? color.rgb(255, 0, 0) : color.new(color.blue, 0)

plot(shortMA, title="Short MA", color=color.rgb(9, 112, 0))
plot(longMA, title="Long MA", color=color.rgb(255, 0, 0))

// Create a cross signal
longCross = ta.crossover(shortMA, longMA)
shortCross = ta.crossunder(shortMA, longMA)

// Strategy entry
if (longCross)
    strategy.entry("Long", strategy.long)
if (shortCross)
    strategy.entry("Short", strategy.short)

// Strategy take profit
if (tp1Enabled and strategy.position_size > 0)
    strategy.exit("TP1 Long", "Long", qty_percent=tp1QtyPerc, limit=strategy.position_avg_price * (1 + tp1Perc))
if (tp1Enabled and strategy.position_size < 0)
    strategy.exit("TP1 Short", "Short", qty_percent=tp1QtyPerc, limit=strategy.position_avg_price * (1 - tp1Perc))

if (tp2Enabled and strategy.position_size > 0)
    strategy.exit("TP2 Long", "Long", qty_percent=tp2QtyPerc, limit=strategy.position_avg_price * (1 + tp2Perc))
if (tp2Enabled and strategy.position_size < 0)
    strategy.exit("TP2 Short", "Short", qty_percent=tp2QtyPerc, limit=strategy.position_avg_price * (1 - tp2Perc))

if (tp3Enabled and strategy.position_size > 0)
    strategy.exit("TP3 Long", "Long", qty_percent=tp3QtyPerc, limit=strategy.position_avg_price * (1 + tp3Perc))
if (tp3Enabled and strategy.position_size < 0)
    strategy.exit("TP3 Short", "Short", qty_percent=tp3QtyPerc, limit=strategy.position_avg_price * (1 - tp3Perc))

if (tp4Enabled and strategy.position_size > 0)
    strategy.exit("TP4 Long", "Long", qty_percent=tp4QtyPerc, limit=strategy.position_avg_price * (1 + tp4Perc))
if (tp4Enabled and strategy.position_size < 0)
    strategy.exit("TP4 Short", "Short", qty_percent=tp4QtyPerc, limit=strategy.position_avg_price * (1 - tp4Perc))

// Plotting the signals on the chart
plotshape(series=longCross, title="Long Cross", location=location.belowbar, color=color.rgb(9, 112, 0), style=shape.triangleup, size=size.small)
plotshape(series=shortCross, title="Short Cross", location=location.abovebar, color=color.rgb(255, 0, 0), style=shape.triangledown, size=size.small)

// Apply candle color
barcolor(candleColor)
相关内容
- 均线,简单移动平均线,均线斜率,追踪止损,重新进场
- 双均线交叉动态持仓策略
- 移动平均交叉策略
- SMA双均线交易策略
- 移动平均线交叉策略
- 基于多均线的趋势交易策略
- 趋势捕捉策略
- 双均线交叉自适应参数择时交易策略
- 基于双均线交叉的移动平均线策略
- 双均线动量交易策略:基于时间优化的趋势跟踪系统
- 多重移动平均与随机震荡交叉量化策略
更多内容
- RSI趋势反转策略
- 随机交叉指标动量交易策略
- RSI与双EMA交叉信号量化策略
- 艾略特波浪理论4-9脉冲波自动检测交易策略
- 随机震荡指标与均线交叉策略结合止损与随机震荡过滤器
- 日内可扩展波动率交易策略
- KRK aDa 随机慢速均值回归策略与人工智能增强
- 基于支点和斜率的实时趋势线交易
- EMA23/EMA50双均线交叉量化交易策略
- 横线突破捕捉趋势策略
- MACD金叉死叉策略
- MACD-V和斐波那契多时间框架动态止盈策略
- 趋势捕捉策略
- 滑动平均线和布林带量化交易策略
- 布林带突破策略
- 双时间尺度动量策略
- MACD BB 波段突破策略
- Wavetrend 大幅指标超跌反弹网格交易策略
- MACD 交叉策略
- 基于MACD信号线交叉与ATR风险管理的优化趋势跟踪策略