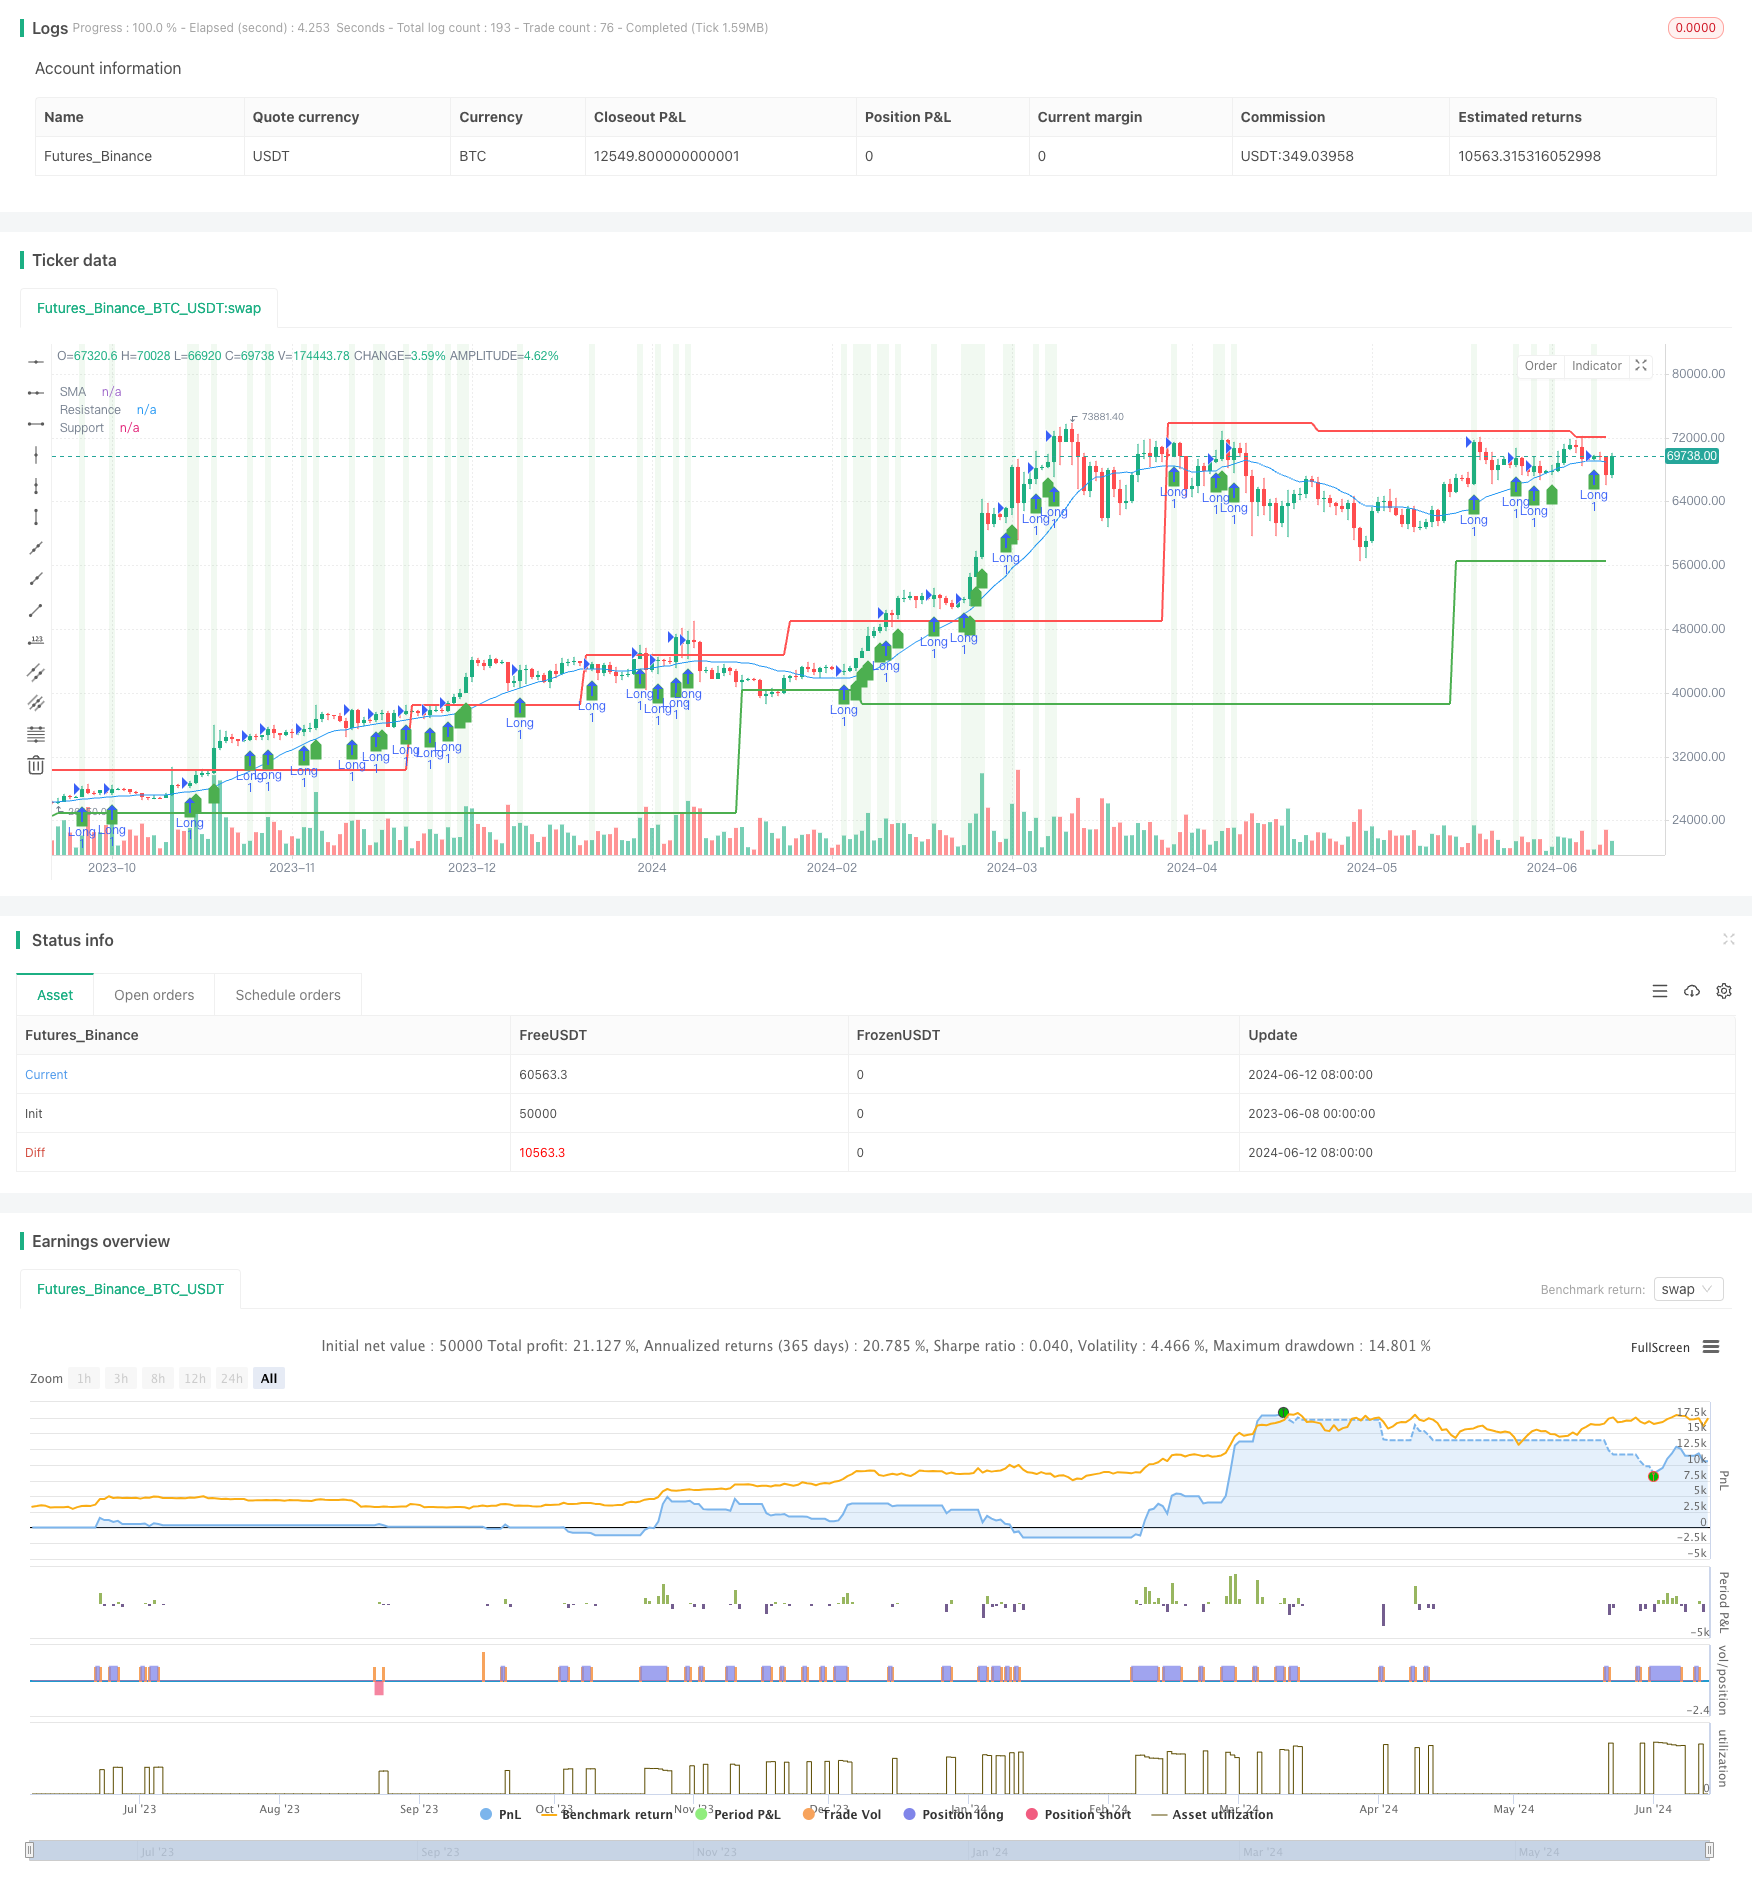
移動平均値,サポート/レジスタンス,およびボリュームに基づいたアドバンストエントリー戦略
作者: リン・ハーンチャオチャン開催日:2024年6月14日 15:40:46タグ:

概要
この戦略は,3つの技術指標を組み合わせます:シンプル・ムービング・平均値 (SMA),サポート・レジスタンスレベル,および取引量の増加.この戦略の主な考え方は,価格がSMA,サポート/レジスタンスレベルを突破したときに取引を開始し,リスク管理のためにストップ・ロスの条件を設定しながら,取引量の増加に伴います.
戦略原則
- 指定された期間の SMA,サポート,レジスタンスレベルを計算します.
- 現在の取引量が前期と比較して増加したかどうかを確認します.
- ロングエントリー条件:現在の閉場価格が前期の閉場価格,SMAおよびサポートレベルより高く,価格がレジスタンスレベルから一定の距離にあり,取引量が増加する.
- 短期入場条件:現在の閉場価格は前期の閉場価格,SMAおよびサポートレベルより低く,価格はレジスタンスレベルから一定の距離にあり,取引量が増加する.
- ストップ・ロスの条件: ロング・ストップ・ロスの価格は入場価格 × (1 - ストップ・ロスの割合) で,ショート・ストップ・ロスの価格は入場価格 × (1 + ストップ・ロスの割合) で表されます.
利点分析
- 複数の技術指標を組み合わせることで,戦略の信頼性と安定性が向上します.
- SMAの価格ブレイクとサポート/レジスタンスレベルの両方を考慮すると,トレンドの機会をよりうまく把握できます.
- 取引量指標の導入は,価格ブレイクが十分な市場参加に伴い,シグナルの有効性を高めるようにします.
- ストップ・ロスの条件を設定することで,取引リスクが効果的に制御されます.
リスク分析
- サポートレベルとレジスタンスレベルの計算は,過去のデータに基づいているため,市場が大きく変動する際に有効性が低下する可能性があります.
- 取引量指標は異常な変動が起こり,誤った信号が発信される可能性があります.
- ストップ・ロスの条件設定は,極端な市場状況で損失を完全に回避できない可能性があります.
最適化方向
- 取引シグナルの信頼性をさらに検証するために,相対強度指数 (RSI) や移動平均収束差異 (MACD) などの他の技術指標を導入することを検討する.
- サポートとレジスタンスレベルを計算する方法を最適化し,異なる市場状況に適応するためによりダイナミックなアプローチを採用する.
- 取引量指標を平らにする. 戦略に対する異常変動の影響を減らす.
- ストップ・ロスの条件の設定を最適化します.例えば,ストップ・ロスの後続的な設定を使用するか,市場の変動に基づいてストップ・ロスの割合を動的に調整します.
概要
この戦略は,SMA,サポートおよびレジスタンスレベル,および取引量指標を組み合わせて包括的な取引戦略を構築する.この戦略の利点は,取引リスクを制御しながらトレンド機会を把握する能力にあります.しかし,この戦略には,極端な市場状況への適応性など,改善が必要である特定の制限もあります.将来,戦略は,他の技術指標を導入し,サポートおよびレジスタンスレベルの計算方法を最適化し,取引量指標をスムーズにし,安定性と収益性を高めるためにストップロスの条件を最適化することで改善することができます.
/*backtest
start: 2023-06-08 00:00:00
end: 2024-06-13 00:00:00
period: 1d
basePeriod: 1h
exchanges: [{"eid":"Futures_Binance","currency":"BTC_USDT"}]
*/

//@version=4
strategy("Advanced Entry Conditions with Support/Resistance, SMA, and Volume", overlay=true)

// Inputs
length = input(20, title="SMA Length")
stopLossPerc = input(1, title="Stop Loss Percentage", type=input.float) / 100
leftBars = input(15, title="Left Bars")
rightBars = input(15, title="Right Bars")
distanceThresh = input(1, title="Distance Threshold from Support/Resistance", type=input.float) / 100

// Calculations
smaValue = sma(close, length)
highUsePivot = fixnan(pivothigh(leftBars, rightBars)[1])
lowUsePivot = fixnan(pivotlow(leftBars, rightBars)[1])

// Volume Calculation
volumeIncrease = volume > volume[1]

// Entry Conditions
longEntryCondition = close[0] > close[1] and close[1] > smaValue and close[0] > smaValue and close[0] > lowUsePivot and close[1] > lowUsePivot and abs(close[0] - highUsePivot) > distanceThresh and volumeIncrease
shortEntryCondition = close[0] < close[1] and close[1] < smaValue and close[0] < smaValue and close[0] < lowUsePivot and close[1] < lowUsePivot and abs(close[0] - highUsePivot) > distanceThresh and volumeIncrease

// Calculate stop loss levels
longStopLoss = close * (1 - stopLossPerc)
shortStopLoss = close * (1 + stopLossPerc)

// Strategy Logic
strategy.entry("Long", strategy.long, when=longEntryCondition)
strategy.exit("Exit Long", "Long", stop=longStopLoss)

strategy.entry("Short", strategy.short, when=shortEntryCondition)
strategy.exit("Exit Short", "Short", stop=shortStopLoss)

// Plotting
plot(smaValue, color=color.blue, title="SMA")
plot(highUsePivot, color=color.red, linewidth=2, title="Resistance")
plot(lowUsePivot, color=color.green, linewidth=2, title="Support")

plotshape(series=longEntryCondition, location=location.belowbar, color=color.green, style=shape.labelup, title="Long Entry")
plotshape(series=shortEntryCondition, location=location.abovebar, color=color.red, style=shape.labeldown, title="Short Entry")

// Background Color
bgcolor(longEntryCondition ? color.new(color.green, 90) : shortEntryCondition ? color.new(color.red, 90) : na)
もっと
- 短期的定量的な取引戦略 双動平均クロスオーバー,RSI,ストカスティック指標に基づく
- RSIの低点逆転戦略
- フィッシャー・トランスフォーム ダイナミック・スリージングル トレンド 戦略をフォローする
- 平均逆転戦略
- EMA100とNUPL 相対的未実現利益量的な取引戦略
- ストカスティックオシレーターに基づく波動範囲取引戦略
- シンプルな組み合わせ戦略:ピボットポイント スーパートレンドとDEMA
- EMAのトレンドフィルター戦略
- 移動平均のクロスオーバー戦略
- 3分間のキャンドル・ハイ・ロー・ポイントに基づいた日中のブレイクアウト戦略
- EMA RSI MACD ダイナミック・テイク・プロフィート・ストップ・ロスト・トレード・戦略
- G-Trend EMA ATR インテリジェント・トレーディング・ストラテジー
- トレンドフォロー戦略 200日移動平均値とストカスティックオシレーターに基づく
- RSI トレンド戦略
- EMAのクロスオーバー・モメンタム・スカルピング戦略
- BBの脱出戦略
- VWAP と RSI ダイナミック・ボリンガー・バンドは,利益とストップ・ロスの戦略をとる
- チェンデ・クロール ストップ ダイナミックATRトレンド 戦略をフォローする
- この戦略はチャイキンマネーフロー (CMF) をベースに取引信号を生成します
- トレンドフィルタピンのバー逆転戦略