概要
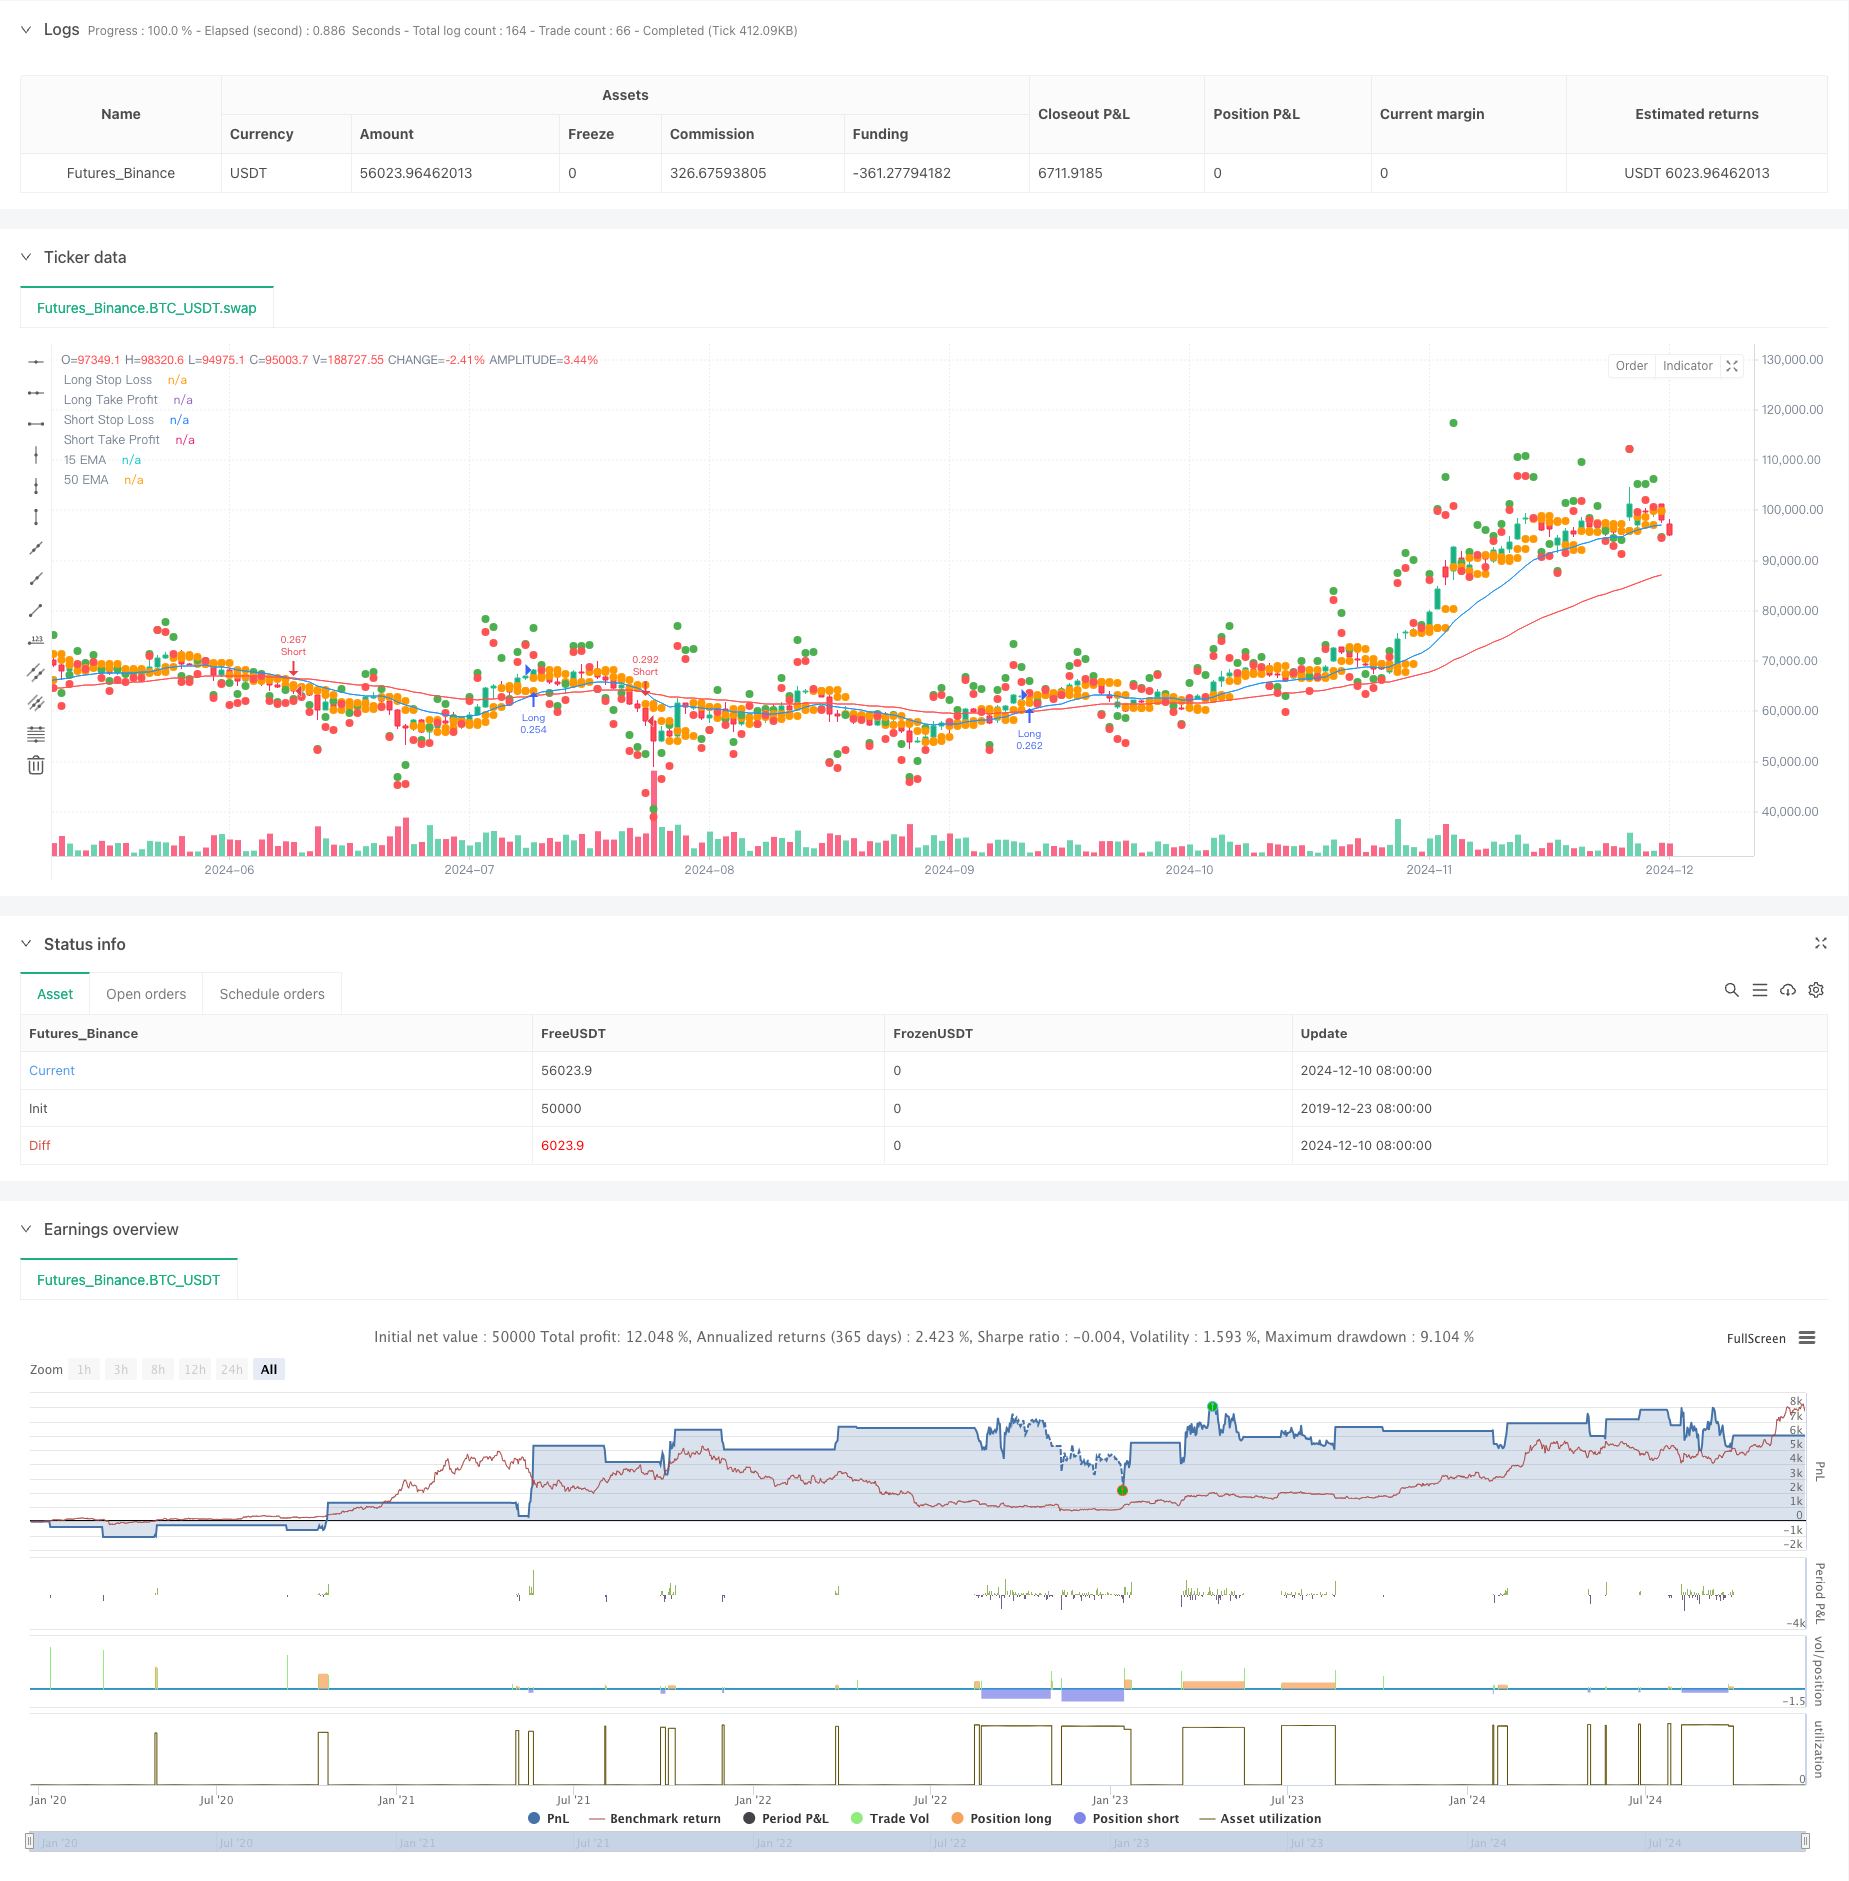
これは,15サイクルと50サイクルインデックス移動平均 (EMA) の交差に基づく取引戦略である.戦略は,スマートな設定による止損と利益の獲得により,リスクと利益の比率の最適制御を実現している.この戦略は,トレンド反転の信号を捕捉するだけでなく,市場の変動に応じて取引パラメータを自動的に調整する能力を持ち,その結果,戦略の安定性と収益性を高めることができる.
戦略原則
戦略の核心論理は,高速EMA ((15周期) と慢速EMA ((50周期) の交叉信号に基づいている.高速線が遅い線を横切るとき,システムは多行信号を生成し;高速線が遅い線を横切るとき,システムは空白信号を生成する.リスク管理を最適化するために,戦略は,動的ストップ損失設定方法を採用している.すなわち,以前の2K線の最低開場価格が多頭ストップで,最高開場価格が空頭ストップで利益を得ている.利潤目標は,リスクの2倍によって設定され,良質なリスク収益を確保している.戦略は,口座の30%の資金取引をデフォルトで使用している.この資金管理方法は,リスクを制御するのに役立ちます.
戦略的優位性
- ダイナミックなリスク管理: ストップ・ポジションをリアルタイムで計算することで,戦略は市場の波動に応じてリスクパラメータを自動的に調整することができる.
- 最適化されたリスク/報酬比率: 利益目標の2倍のストップ・ローズ・ディスタンス設定により,取引ごとに合理的な利益の余地があることを保証します.
- 健全な資金管理: 口座の30%の資金で取引し,収益の可能性を保証し,過度のリスクを回避します.
- 双方向の取引機会:戦略は,多空の双方向の取引機会を捉えることができ,取引頻度と収益の機会を高めます.
- ビジュアルアシスタント: 取引者は,ストップ・ロズとトーナメントの位置をグラフにマークすることで,取引状況を直感的に監視することができます.
戦略リスク
- 振動市場リスク:横盤振動市場では,均線交差信号が偽信号を生じ,連続したストップ損失を引き起こす可能性がある.
- スリップポイントリスク:市場の急速な波動で,実際の取引価格が理想価格から大きな偏差がある可能性があります.
- 資金管理のリスク:固定使用の30%の資金は,特定の市場条件において過度に激進的かもしれない.
- ストップレード設定のリスク:前2 K ラインの設定に基づくストップレードは,極端な市場条件では柔軟性がない可能性があります.
戦略最適化の方向性
- トレンドフィルターの導入:弱点信号をフィルターするために,ADXまたはトレンド強度指標などの追加のトレンド確認指標を追加できます.
- ダイナミックな資金管理:市場の変動に応じてポジションのサイズを自動的に調整して,戦略をより適応的にすることができる.
- 最適化ストップ方法: 市場変動特性に適したストップを設定するためにATR指標を導入することを検討することができます.
- タイムフィルタを追加: 取引の時間帯フィルタを追加し,急激な変動や流動性の不足の時期を回避します.
- 取引量確認の導入:取引量を取引信号の確認指標として導入し,信号の信頼性を向上させる.
要約する
これは,構造が整った,論理が明確な均線交差戦略である。 クラシックな技術分析方法と現代的なリスク管理技術を組み合わせることで,戦略は優れたリスク・利益特性を実現している。 特定の最適化余地があるが,戦略の基本的枠組みは,優れた実用性と拡張性を有している。 提案された最適化方向によって,戦略のパフォーマンスはさらに向上する見込みがある。
ストラテジーソースコード
/*backtest
start: 2019-12-23 08:00:00
end: 2024-12-11 08:00:00
period: 1d
basePeriod: 1d
exchanges: [{"eid":"Futures_Binance","currency":"BTC_USDT"}]
*/

//@version=5
strategy("EMA Cross - Any Direction", overlay=true, default_qty_type=strategy.percent_of_equity, default_qty_value=30)

// Input for EMAs
ema_short_length = input(15, title="Short EMA Length")
ema_long_length = input(50, title="Long EMA Length")

// Calculate EMAs
ema_short = ta.ema(close, ema_short_length)
ema_long = ta.ema(close, ema_long_length)

// Plot EMAs
plot(ema_short, color=color.blue, title="15 EMA")
plot(ema_long, color=color.red, title="50 EMA")

// Entry Conditions (Any EMA Cross)
cross_condition = ta.crossover(ema_short, ema_long) or ta.crossunder(ema_short, ema_long)

// Determine Trade Direction
is_long = ta.crossover(ema_short, ema_long)
is_short = ta.crossunder(ema_short, ema_long)

// Stop Loss and Take Profit
long_stop_loss = ta.lowest(open[1], 2)  // Lowest open of the last 2 candles
short_stop_loss = ta.highest(open[1], 2) // Highest open of the last 2 candles
long_take_profit = close + 2 * (close - long_stop_loss)
short_take_profit = close - 2 * (short_stop_loss - close)

// Execute Trades
if (cross_condition)
    if (is_long)
        strategy.entry("Long", strategy.long)
        strategy.exit("Exit Long", "Long", stop=long_stop_loss, limit=long_take_profit)
    else if (is_short)
        strategy.entry("Short", strategy.short)
        strategy.exit("Exit Short", "Short", stop=short_stop_loss, limit=short_take_profit)

// Plot Stop Loss and Take Profit Levels
plot(long_stop_loss, color=color.orange, title="Long Stop Loss", style=plot.style_circles, linewidth=2)
plot(long_take_profit, color=color.green, title="Long Take Profit", style=plot.style_circles, linewidth=2)
plot(short_stop_loss, color=color.orange, title="Short Stop Loss", style=plot.style_circles, linewidth=2)
plot(short_take_profit, color=color.red, title="Short Take Profit", style=plot.style_circles, linewidth=2)