1
フォロー
1628
フォロワー

概要
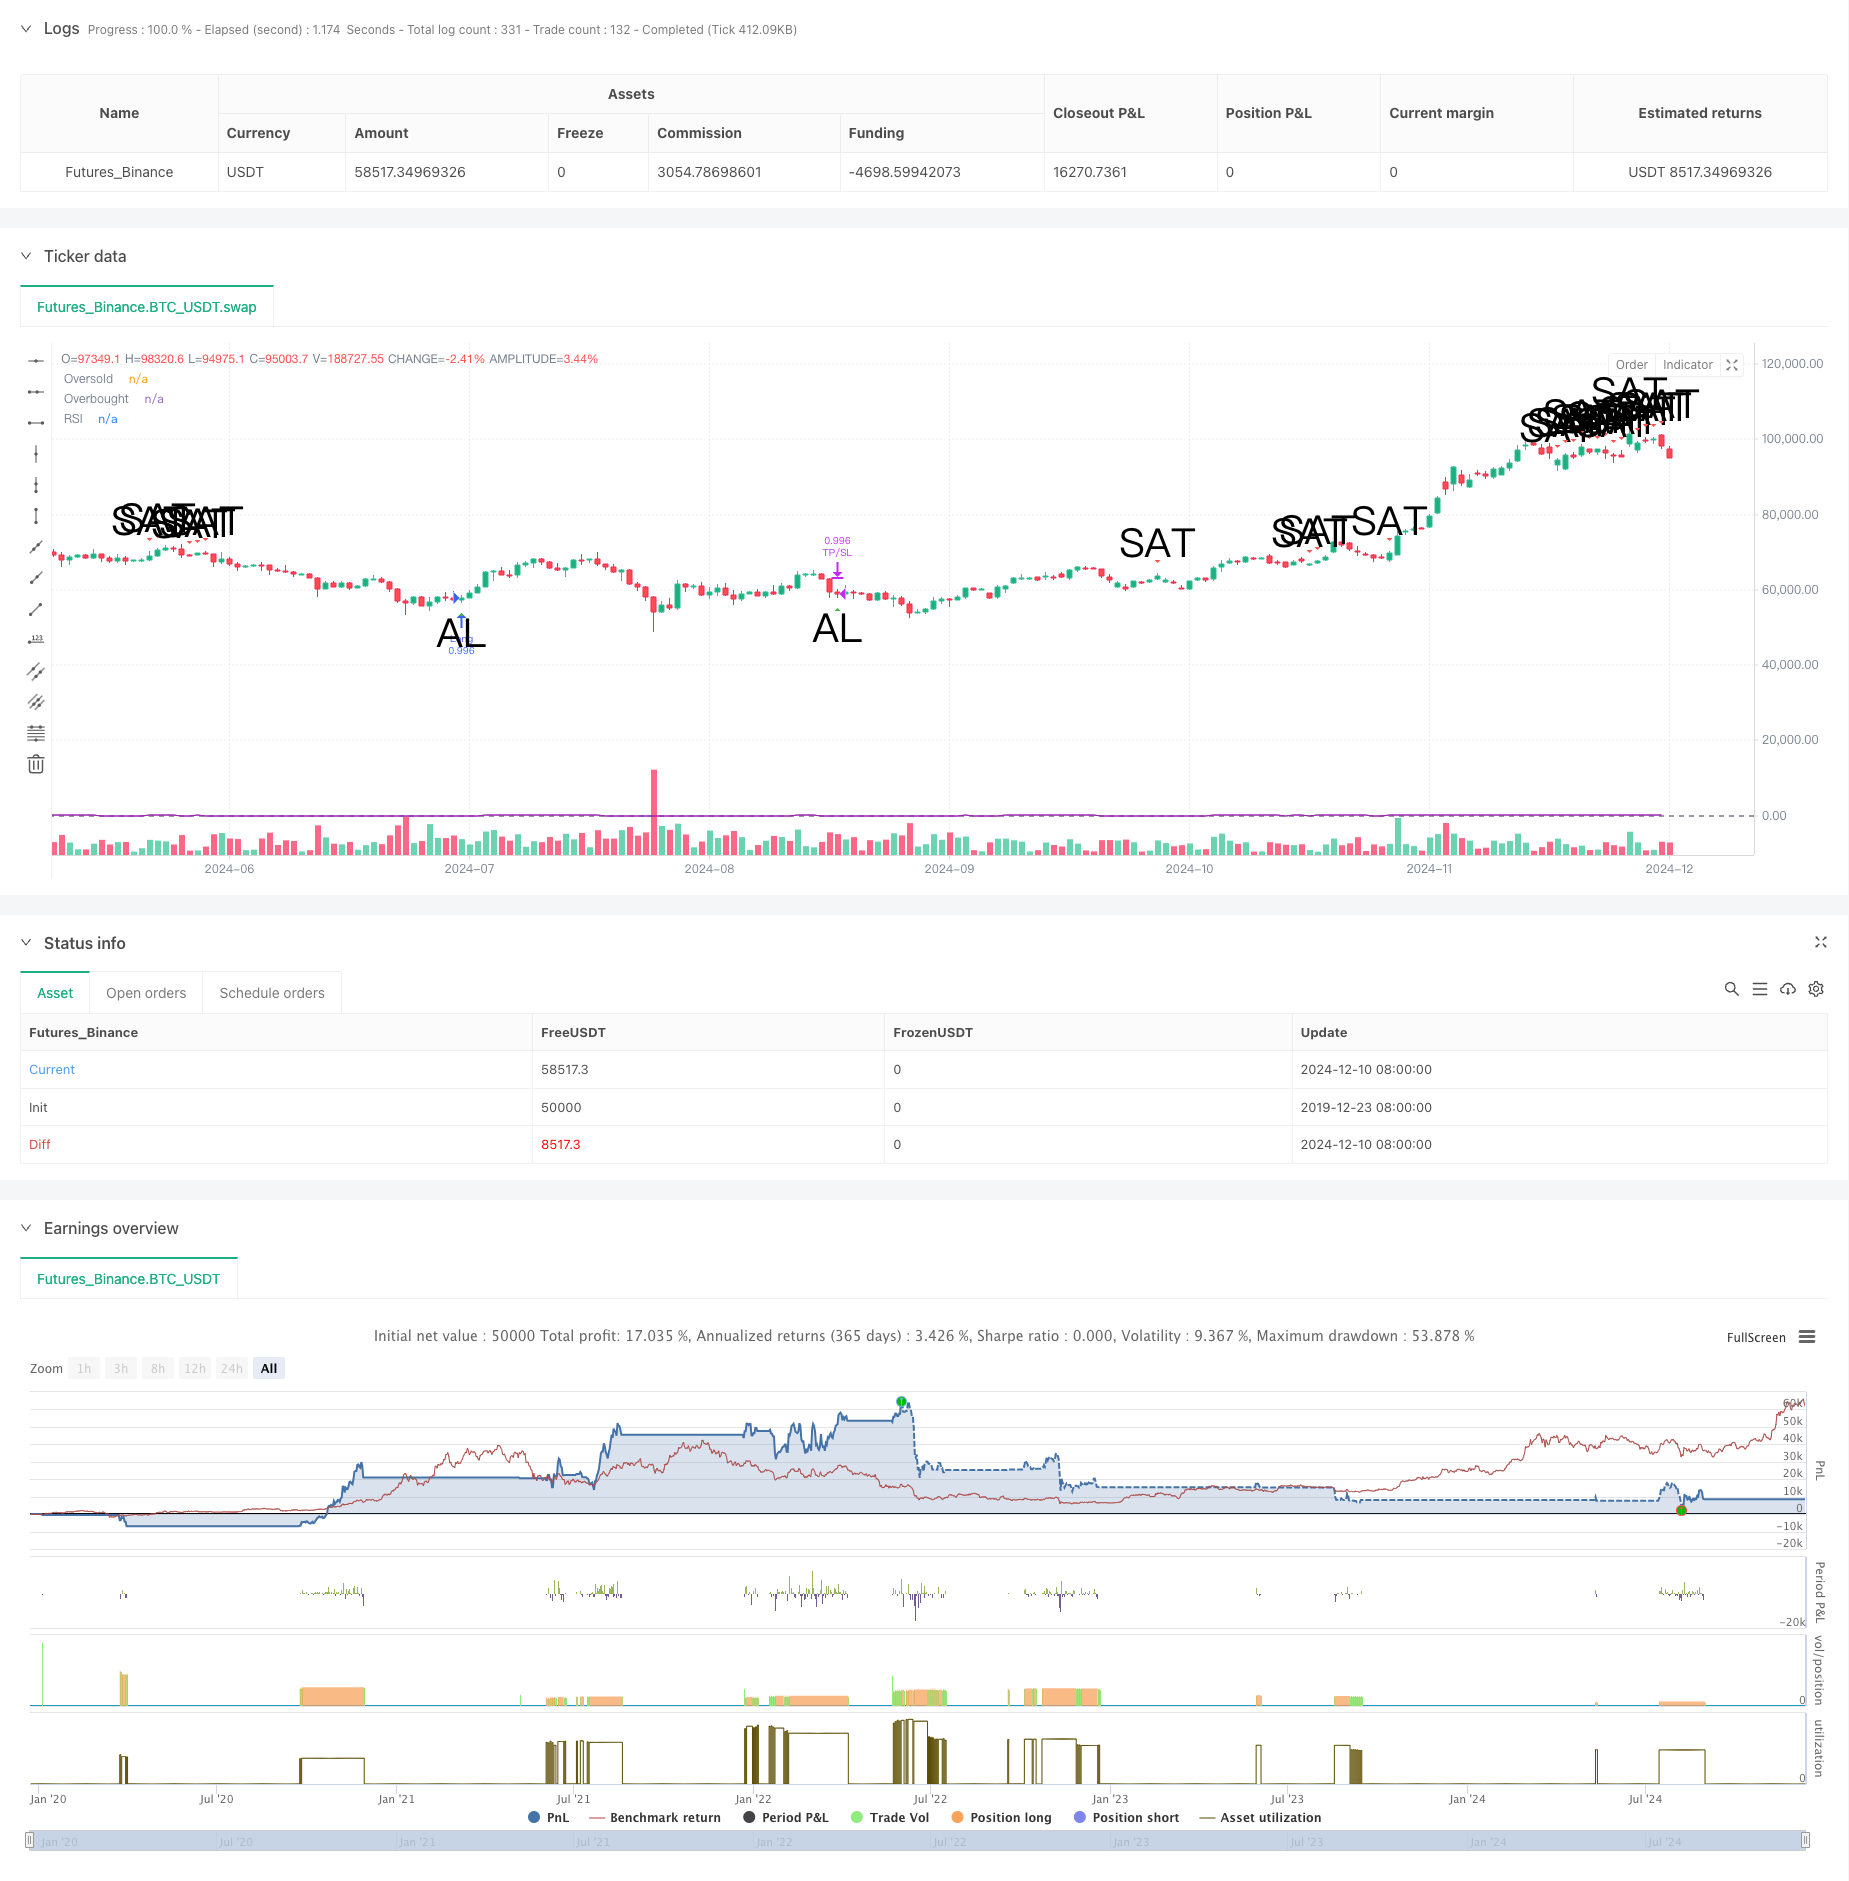
この戦略は,MACD ((移動平均の収束散度) とRSI ((相対的に強い指標) を組み合わせたトレンド追跡取引システムである.戦略は,5分間の時間周期で動作し,MACDとシグナルラインの交差とRSIの超買い超売りレベルを分析することによって取引シグナルを生成する.同時に,リスク管理を実現するために,パーセントベースのストップと利益の終了の仕組みを統合する.
戦略原則
戦略は主に以下のコアロジックに基づいています.
- 12-26-9のパラメータ設定を使用したMACD指標で価格トレンドを捉える
- 14サイクルのRSI指標を用いて超買いと超売りを識別する
- MACD線で信号線を穿越し,RSIが45未満であるとき,多信号をトリガーする
- MACDが信号線をオフラインで通過し,RSIが55を超えると平衡シグナルをトリガーします.
- 1.2%のストップを設定してリスクをコントロールし,2.4%のストップを設定して利益をロックします.
- 10サイクルEMAをトレンドフィルターとして使用し,信号の質を向上させる
戦略的優位性
- 指数の組み合わせの利点:MACDのトレンド追跡特性とRSIの波動特性との組み合わせにより,市場の転換点をより正確に捉える
- リスク管理の改善:固定比率のストップ・ストップ,単一取引リスクの厳格な管理
- シグナル確認メカニズム:偽信号を低減するために,MACDとRSIの条件を同時に満たす必要があります.
- 適応性:異なる市場環境にパラメータで適応できる
- 実行論理の明晰さ:取引規則が明確で,自動化が容易である
戦略リスク
- 横軸の変動市場では,頻繁に取引が起こり,損失を招く可能性があります.
- スライドポイントリスク: 5分周期取引が頻繁で,大きなスライドポイントに直面する可能性がある
- 偽破裂リスク:MACD交差信号が偽破裂する可能性がある
- パラメータの感受性:指標のパラメータの設定は,戦略のパフォーマンスに大きな影響を与える
- 市場環境依存: 戦略はトレンドが明確である市場において優れている
戦略最適化の方向性
- 交差量フィルターを追加:信号生成時に交差量要因を考慮して,信号信頼性を向上させる
- ダイナミックストップレスト設定:市場の変動に応じて自律的にストップレスを調整する
- トレンド強度フィルターの導入: ADXなどのトレンド強度指標を追加し,取引タイミングを最適化
- ポジション管理の改善:変動率に基づく動的ポジション管理を実現
- 最適化パラメータの自適性:パラメータの動的最適化メカニズムを開発し,戦略の適応性を向上させる
要約する
この戦略は,MACDとRSIの優位性を組み合わせて,トレンド追跡と動力の特性を兼ね備えた取引システムを構築している. 完善したリスク制御機構と明確な取引論理により,その実用性は良好である. 提案された最適化方向によって,戦略はさらに向上する余地がある. 実地での適用では,充分なフィードバック検証をまず行い,特定の市場の特徴に応じてパラメータを適切に調整することが推奨されている.
ストラテジーソースコード
/*backtest
start: 2019-12-23 08:00:00
end: 2024-12-11 08:00:00
period: 1d
basePeriod: 1d
exchanges: [{"eid":"Futures_Binance","currency":"BTC_USDT"}]
*/

// This source code is subject to the terms of the Mozilla Public License 2.0 at https://mozilla.org/MPL/2.0/
//@version=5
strategy("MACD + RSI Basit Strateji", overlay=true, initial_capital=1000, default_qty_type=strategy.percent_of_equity, default_qty_value=100)

// İndikatör parametreleri
fastLength = input(12, "MACD Fast Length")
slowLength = input(26, "MACD Slow Length")
signalLength = input(9, "MACD Signal Length")
rsiLength = input(14, "RSI Period")
rsiOversold = input(45, "RSI Oversold Level")
rsiOverbought = input(55, "RSI Overbought Level")

// Stop Loss ve Take Profit ekledim
stopLoss = input(1.2, "Stop Loss (%)")
takeProfit = input(2.4, "Take Profit (%)")

// MACD hesaplama
[macdLine, signalLine, histLine] = ta.macd(close, fastLength, slowLength, signalLength)

// RSI hesaplama
rsiValue = ta.rsi(close, rsiLength)

// EMA trend filtresi
emaValue = ta.ema(close, 10)

// Alım sinyali koşulları - sadece MACD ve RSI kullanalım
longCondition = macdLine > signalLine and rsiValue < rsiOversold

// Satım sinyali koşulları
shortCondition = macdLine < signalLine and rsiValue > rsiOverbought

// Pozisyon yönetimi - Stop Loss ve Take Profit ekledim
if (longCondition)
    strategy.entry("Long", strategy.long)
    strategy.exit("TP/SL", "Long",
                 profit = close * takeProfit / 100,
                 loss = close * stopLoss / 100)

if (shortCondition)
    strategy.close("Long")

// Grafik göstergeleri
plotshape(longCondition, title="Alım",
         style=shape.triangleup,
         location=location.belowbar,
         color=color.green,
         size=size.large,
         text="AL")

plotshape(shortCondition, title="Satım",
         style=shape.triangledown,
         location=location.abovebar,
         color=color.red,
         size=size.large,
         text="SAT")

// İndikatörleri göster
plot(rsiValue, "RSI", color=color.purple)
hline(rsiOversold, "Oversold", color=color.gray)
hline(rsiOverbought, "Overbought", color=color.gray)