多指标组合的高频交易策略:指数均线与动量指标相结合的短线交易系统
Author: ChaoZhang, Date: 2024-06-21 15:23:13Tags: EMARSIMACD
概述
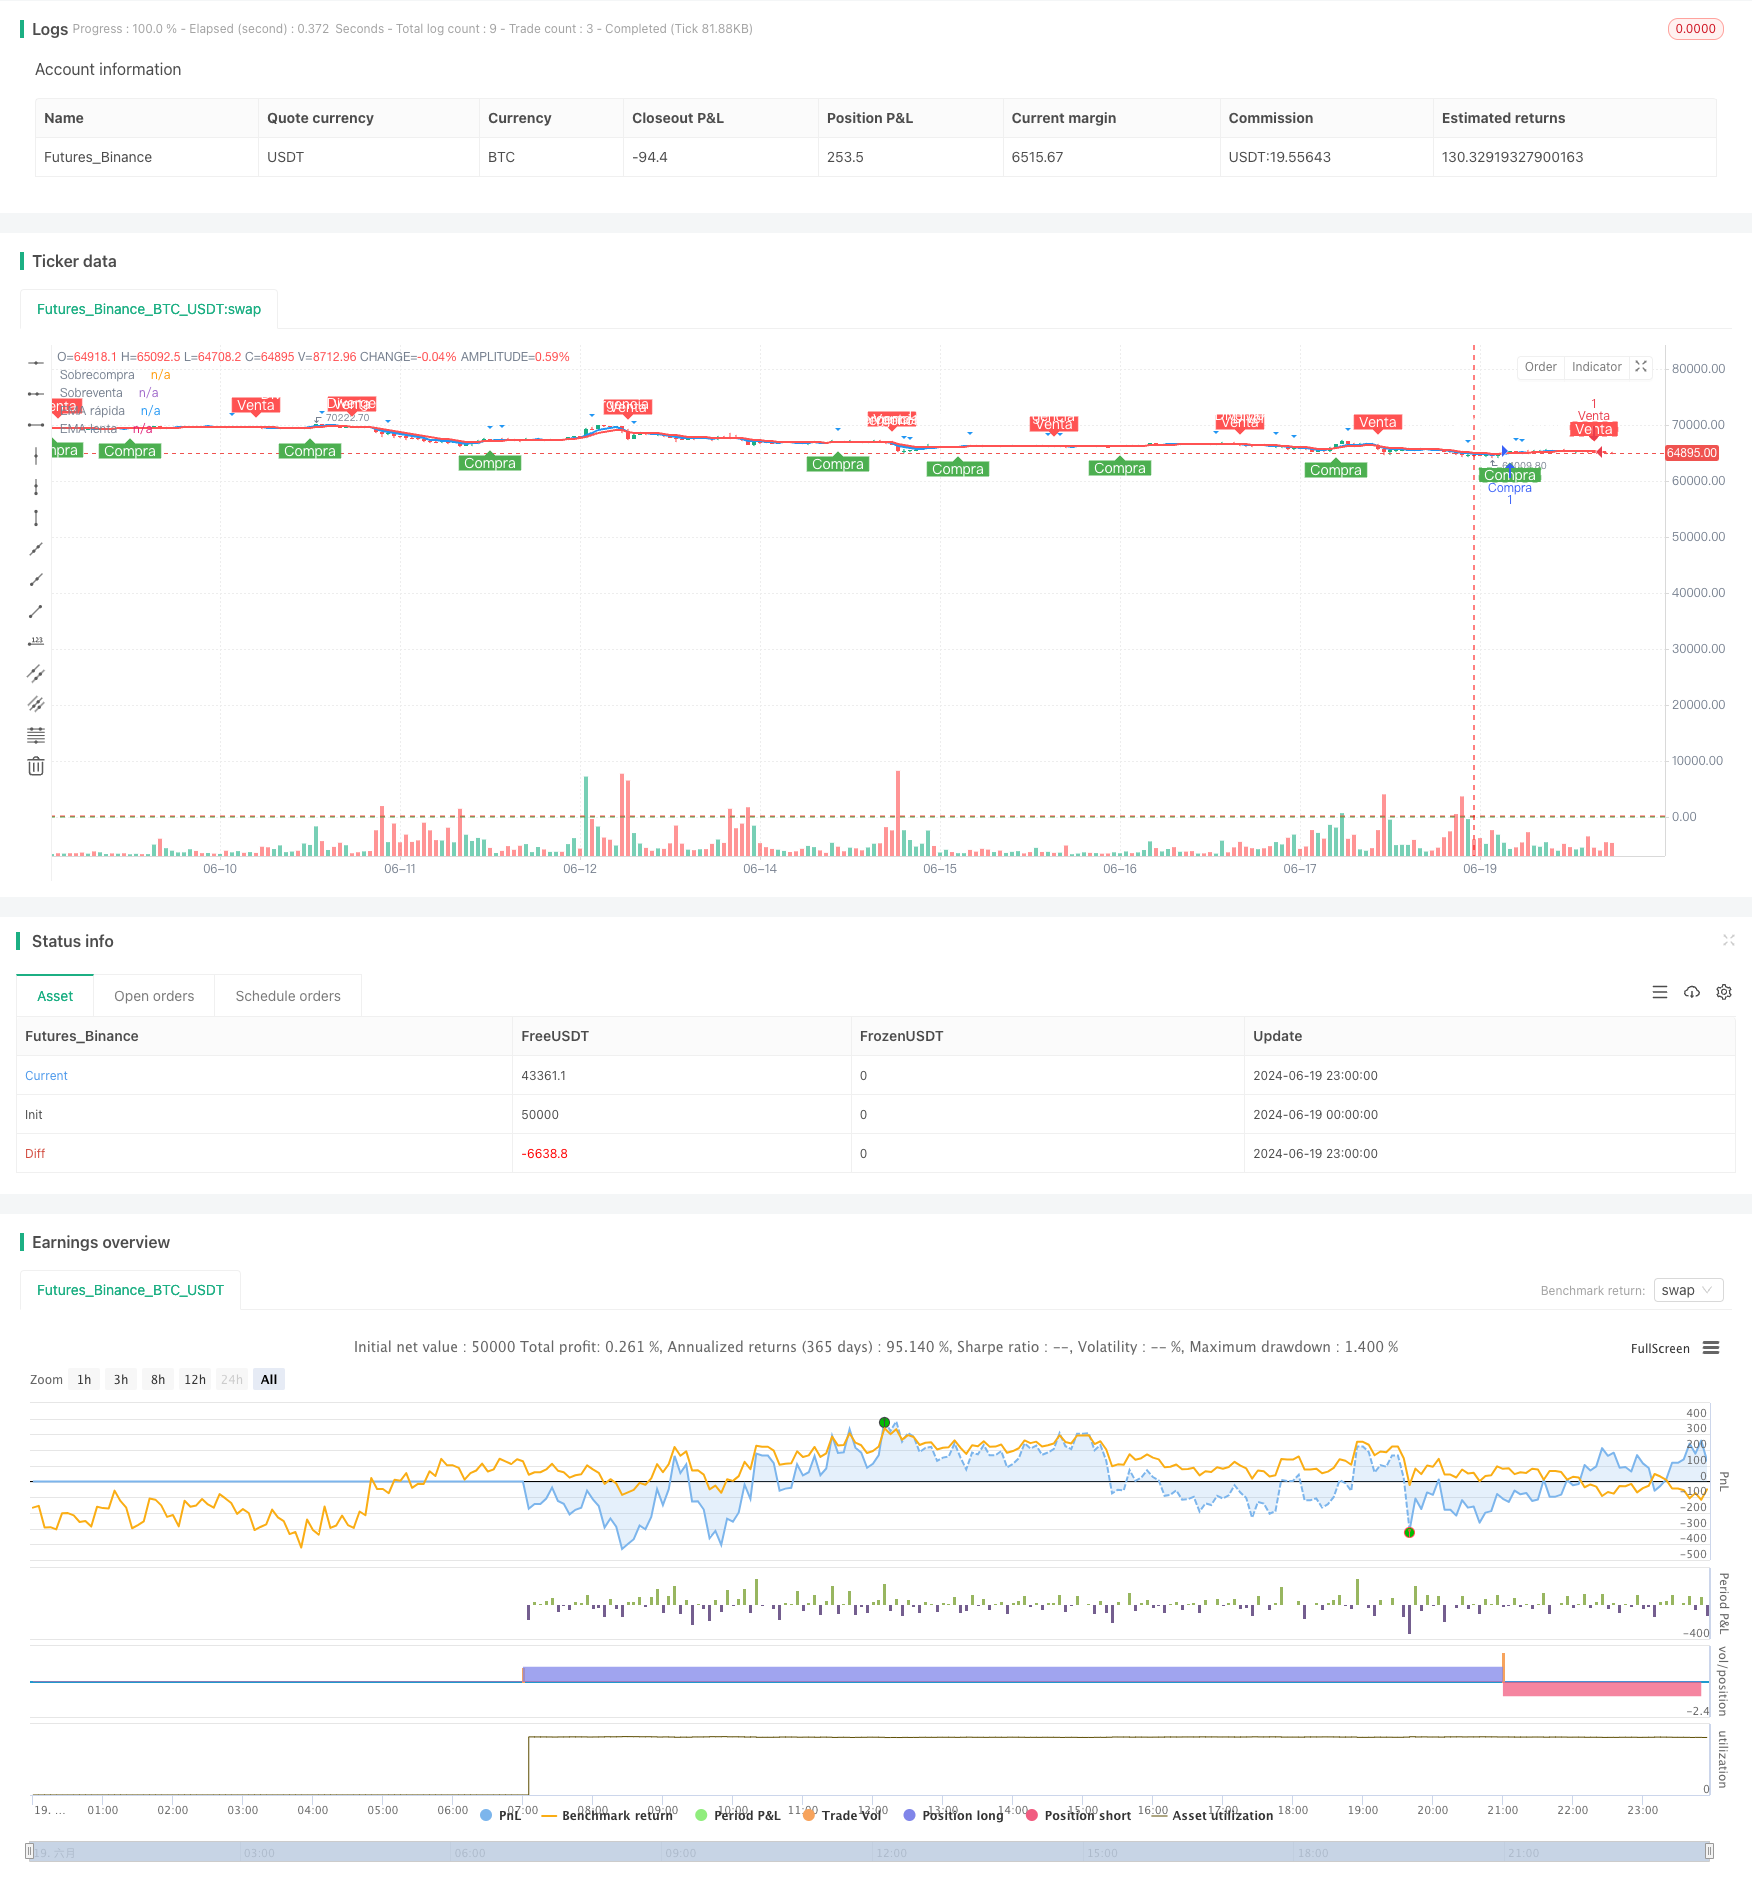
本文介绍了一种结合指数移动平均线(EMA)、相对强弱指标(RSI)和移动平均线趋同背离指标(MACD)的高频交易策略。该策略主要针对短期市场波动,通过多个技术指标的交叉信号和超买超卖水平来捕捉市场短线交易机会。策略的核心在于利用EMA的快速反应特性、RSI的超买超卖指示以及MACD的趋势确认功能,在市场波动中寻找高概率的交易信号。
策略原理
EMA交叉信号:策略使用5周期和10周期的EMA。当快速EMA(5周期)上穿慢速EMA(10周期)时,产生买入信号;当快速EMA下穿慢速EMA时,产生卖出信号。
RSI超买超卖:使用14周期的RSI指标。RSI值大于70被视为超买,小于30被视为超卖。这些水平用于确认或过滤交易信号。
MACD趋势确认:使用MACD指标来确认整体趋势方向,并检测潜在的背离情况。
交易信号生成:
- 买入条件:EMA上穿且RSI小于70
- 卖出条件:EMA下穿且RSI大于30
背离检测:
- RSI背离:比较RSI高点/低点与价格高点/低点,检测潜在的顶部或底部形成。
- MACD背离:比较MACD线的高点/低点与价格高点/低点,进一步确认潜在的反转信号。
策略优势
多指标协同:结合了趋势跟踪(EMA)、动量(RSI)和趋势确认(MACD)指标,提供了全面的市场分析视角。
快速响应:使用短周期EMA,能够对价格变化做出迅速反应,适合高频交易环境。
过滤假信号:通过RSI的超买超卖水平,有效过滤了部分可能的假突破信号。
背离检测:RSI和MACD的背离检测功能为潜在的趋势反转提供了额外的预警。
可视化支持:策略提供了清晰的图形界面,包括买卖信号标记、EMA线条和RSI超买超卖水平,有助于交易者直观理解市场状况。
灵活性:策略参数(如EMA周期、RSI水平)可以根据不同市场和交易品种进行调整,具有良好的适应性。
策略风险
频繁交易:高频交易策略可能导致过度交易,增加交易成本和滑点风险。
假信号:在震荡市场中,EMA可能产生频繁的交叉信号,导致错误交易。
趋势延续风险:在强势趋势中,RSI可能长期处于超买或超卖状态,可能错过重要的趋势机会。
背离判断的主观性:RSI和MACD背离的判断可能存在主观因素,不同交易者可能有不同的解读。
参数敏感性:策略性能对EMA周期和RSI水平等参数设置较为敏感,不同市场环境可能需要不同的参数组合。
市场噪音:在高波动性市场中,短期指标可能受到市场噪音的影响,产生误导性信号。
策略优化方向
动态参数调整:引入自适应机制,根据市场波动性自动调整EMA周期和RSI阈值。
增加过滤条件:考虑加入成交量、波动率等额外指标,提高信号质量。
止损和利润目标:设计动态止损和利润目标机制,优化风险管理。
时间过滤:增加交易时间过滤,避开低流动性时段。
多时间框架分析:结合更长期的时间框架分析,提高交易方向的准确性。
机器学习优化:使用机器学习算法优化参数选择和信号生成过程。
回测与优化:进行大量历史数据回测,找出最优参数组合和市场适应性。
情绪指标整合:考虑引入市场情绪指标,如VIX,以更好地捕捉市场转折点。
总结
这种多指标组合的高频交易策略通过整合EMA、RSI和MACD的优势,为短线交易者提供了一个全面的市场分析工具。它能够快速捕捉市场动向,同时通过多重确认机制降低假信号风险。然而,使用此策略时需要注意控制交易频率,合理设置参数,并结合有效的风险管理措施。通过持续优化和适应市场变化,该策略有潜力成为一个稳健的短线交易系统。交易者应当充分理解策略原理,进行充分的回测和实盘验证,并根据个人风险承受能力和交易目标来决定是否采用此策略。
/*backtest
start: 2024-06-19 00:00:00
end: 2024-06-20 00:00:00
period: 1h
basePeriod: 15m
exchanges: [{"eid":"Futures_Binance","currency":"BTC_USDT"}]
*/

//@version=5
strategy("Estrategia de Scalping - EMA, RSI y MACD", shorttitle="Scalping EMA RSI MACD", overlay=true)

// Definición de medias móviles
fast_length = input.int(5, title="EMA rápida (periodos)")
slow_length = input.int(10, title="EMA lenta (periodos)")
ema_fast = ta.ema(close, fast_length)
ema_slow = ta.ema(close, slow_length)

// Definición de RSI
rsi_length = input.int(14, title="RSI (periodos)")
rsi = ta.rsi(close, rsi_length)

// Definición de MACD
[macd_line, signal_line, _] = ta.macd(close, fast_length, slow_length, rsi_length) // Incluimos fast_length, slow_length, rsi_length aquí

// Condiciones de entrada y salida
ema_up_cross = ta.crossover(ema_fast, ema_slow)
ema_down_cross = ta.crossunder(ema_fast, ema_slow)
rsi_overbought = rsi > 70
rsi_oversold = rsi < 30

// Detección de divergencias bajistas en el RSI
rsi_high = ta.highest(rsi, 14)
rsi_low = ta.lowest(rsi, 14)
bearish_rsi_divergence = (rsi > rsi_high[1] and close < close[1]) or (rsi < rsi_low[1] and close > close[1])

// Detección de divergencias bajistas en el MACD
macd_high = ta.highest(macd_line, 14)
macd_low = ta.lowest(macd_line, 14)
bearish_macd_divergence = (macd_line > macd_high[1] and close < close[1]) or (macd_line < macd_low[1] and close > close[1])

// Condiciones de compra y venta
buy_condition = ema_up_cross and rsi < 70
sell_condition = ema_down_cross and rsi > 30

// Ejecución de órdenes de compra y venta
if (buy_condition)
    strategy.entry("Compra", strategy.long)
if (sell_condition)
    strategy.entry("Venta", strategy.short)

// Plot señales de compra y venta
plotshape(series=buy_condition, title="Señal de Compra", location=location.belowbar, color=color.green, style=shape.labelup, text="Compra", textcolor=color.white)
plotshape(series=sell_condition, title="Señal de Venta", location=location.abovebar, color=color.red, style=shape.labeldown, text="Venta", textcolor=color.white)
plotshape(series=bearish_rsi_divergence, title="Divergencia Bajista en RSI", location=location.abovebar, color=color.red, style=shape.triangledown, text="Divergencia RSI", textcolor=color.white)
plotshape(series=bearish_macd_divergence, title="Divergencia Bajista en MACD", location=location.abovebar, color=color.blue, style=shape.triangledown, text="Divergencia MACD", textcolor=color.white)

// Trazado de medias móviles para visualización
plot(ema_fast, color=color.blue, linewidth=2, title="EMA rápida")
plot(ema_slow, color=color.red, linewidth=2, title="EMA lenta")

// Trazado de niveles de sobrecompra y sobreventa para RSI
hline(70, "Sobrecompra", color=color.red, linestyle=hline.style_dashed)
hline(30, "Sobreventa", color=color.green, linestyle=hline.style_dashed)
- 基于多重技术指标的趋势跟踪与动量策略
- 多级平衡量化交易策略
- EMA交叉与RSI过滤的双重趋势策略
- 趋势波段交易EMA-MACD复合策略
- EMA动态止损交易策略
- 复合技术指标多维度趋势跟踪量化策略
- EMA、MACD、RSI三重指标动量策略
- MACD-RSI趋势动量交叉策略结合风险管理模型
- EMA RSI MACD动态止盈止损交易策略
- 双均线交叉动量趋势跟踪策略 (EMA Crossover Momentum Trend Following Strategy)
- 多周期斐波那契RSI黄金交叉趋势跟踪量化交易策略
- 动态止损止盈的双均线趋势跟踪与蜡烛图反应策略
- 基于机器学习的移动平均线交叉量化交易策略
- RSI与随机指标融合交叉策略
- 多重指数移动平均线交叉趋势跟踪策略
- 动态波动趋势捕捉策略
- VAWSI和趋势持续性反转策略结合动态长度计算的多指标综合分析系统
- 动态通道百分比包络策略
- SuperTrend策略优化:动态波动率跟踪与交易信号增强系统
- 机器学习启发的双均线RSI交易策略
- 三标准差动量反转交易策略
- 多周期指数移动平均交叉策略与期权交易建议系统
- Supertrend双重触发的多步移动止盈策略
- 自定义信号振荡器策略 (CSO)
- 多层级RSI回归交易策略与动态波动率调整
- 布林带动量交叉策略
- 超级三指标RSI-MACD-BB动量反转策略
- CCI动量背离趋势交易策略
- Hilo Activator MACD 动态止盈止损交易策略
- 动态止盈止损的双均线交叉交易策略