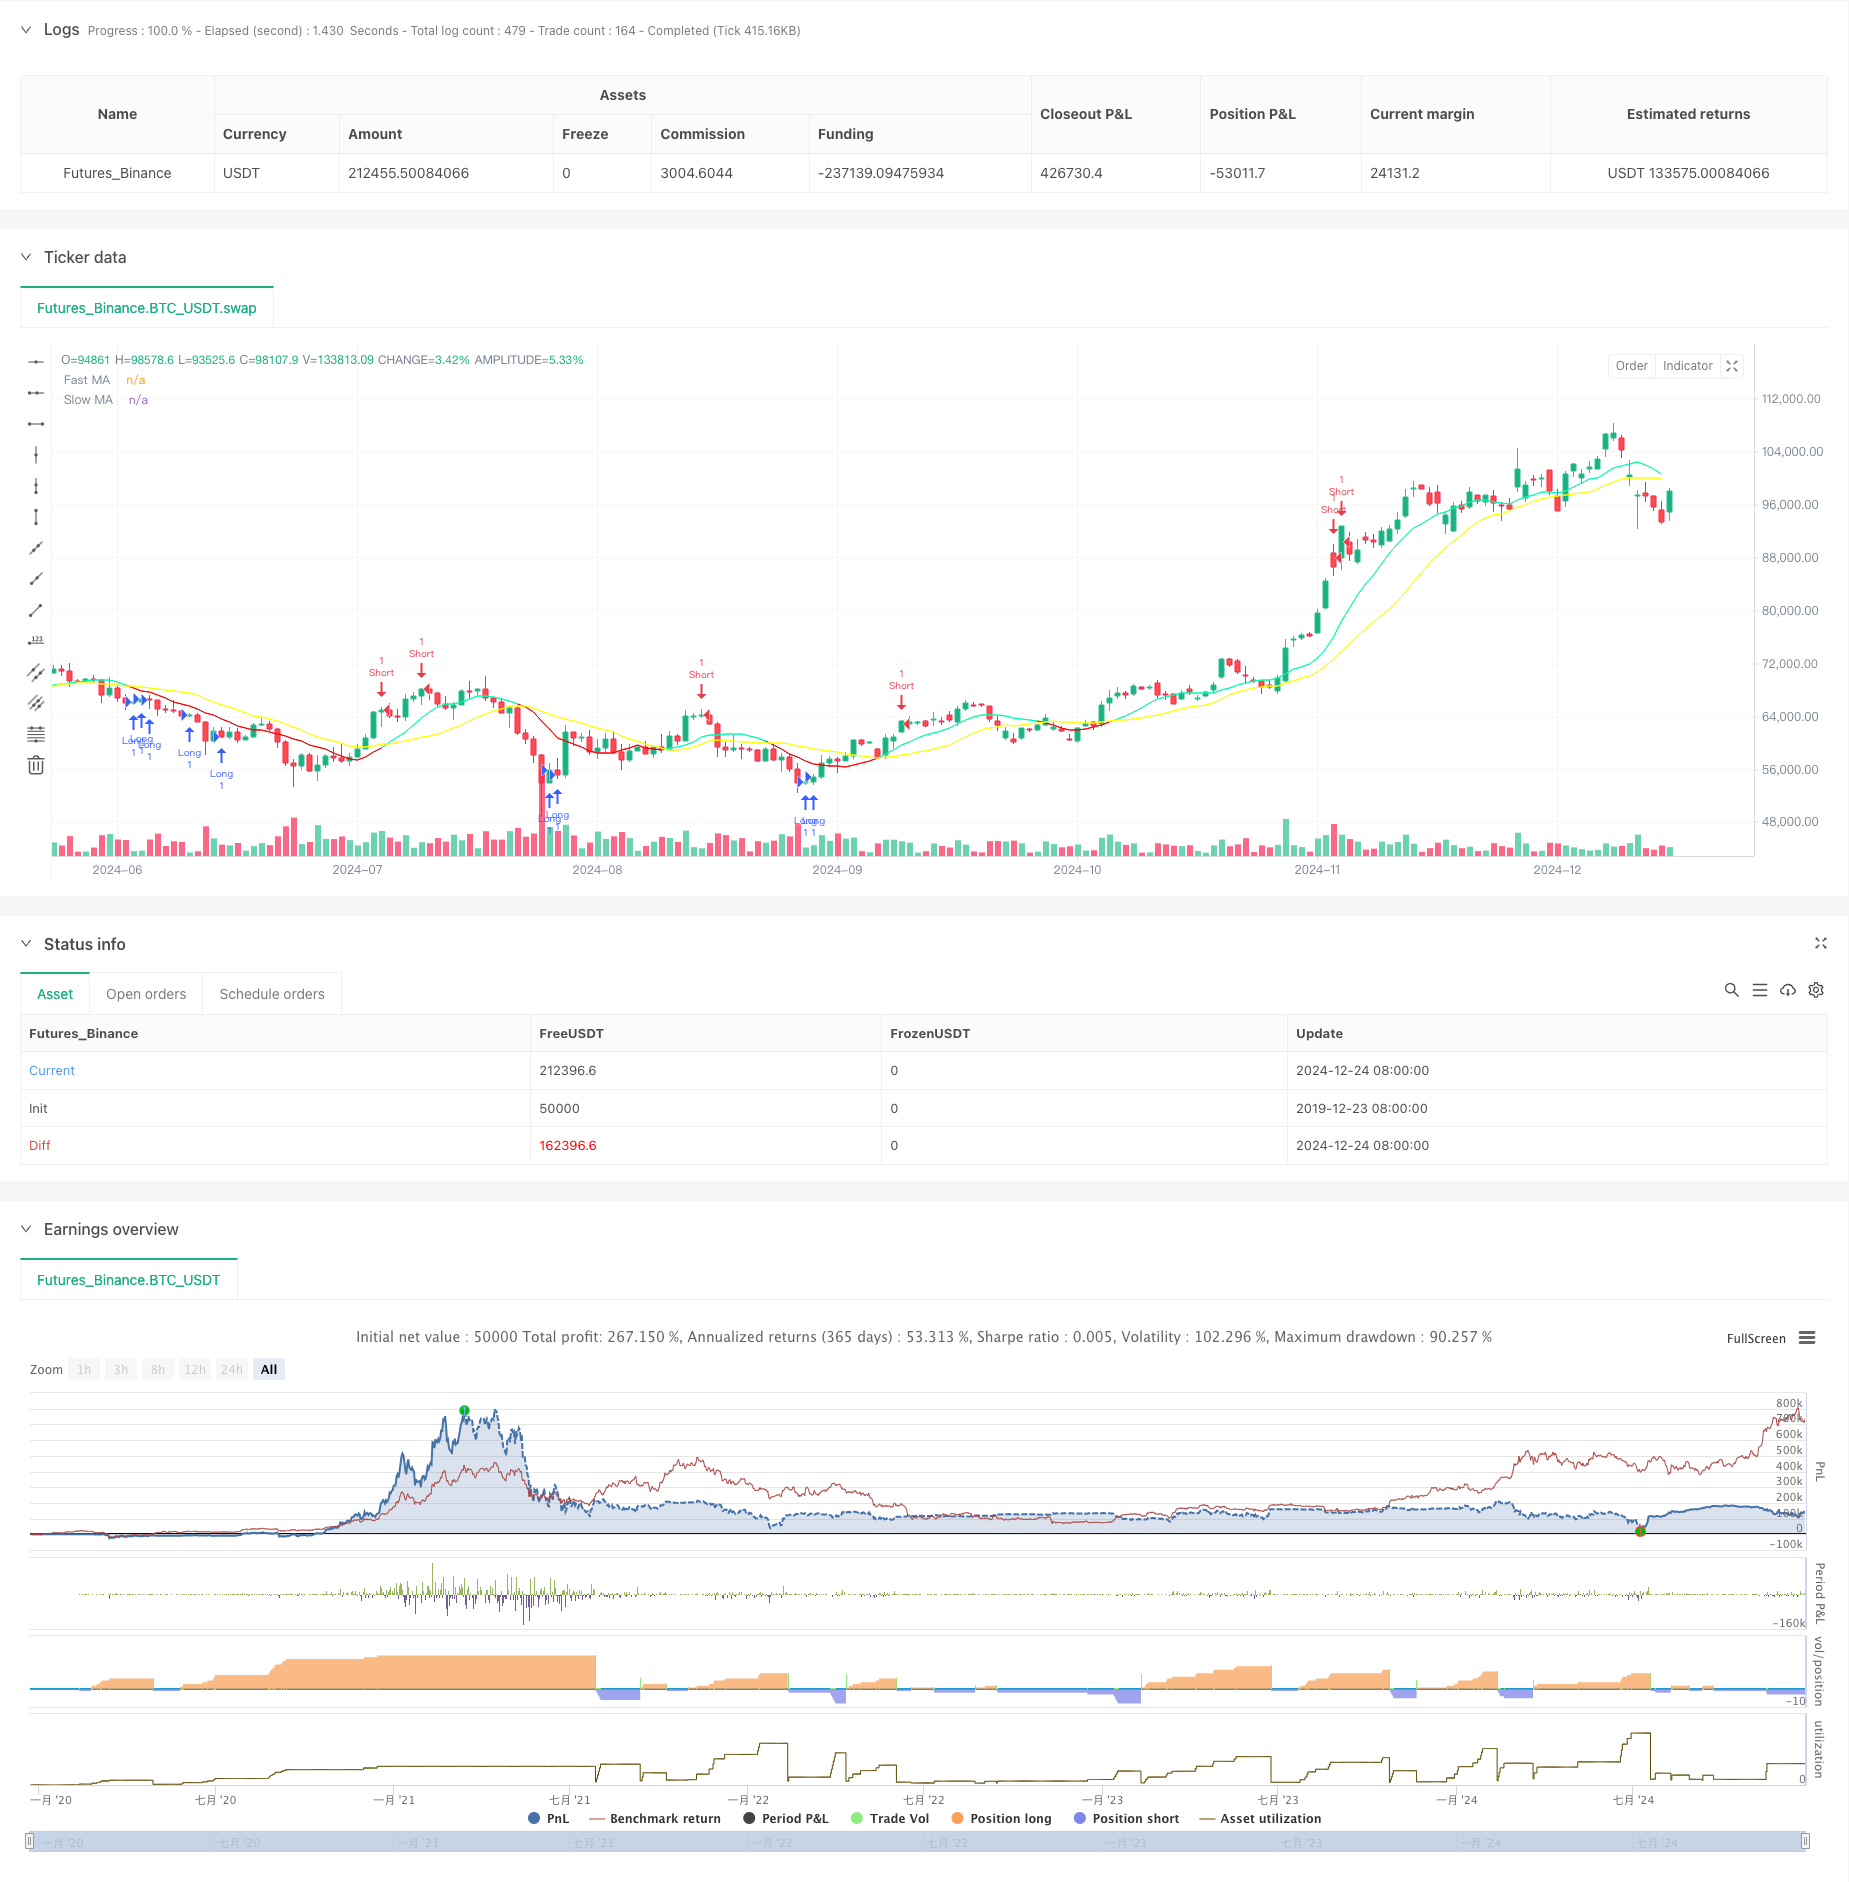
ストカスティックRSIと移動平均システムに基づく定量分析
作者: リン・ハーンチャオチャン開催日:2024年12月27日14時37分55秒タグ:RSIストックSMAマルチ

概要
この戦略は,ストカスティックRSI (相対強度指数) と移動平均指標を組み合わせたトレンドフォローする取引システムである.この戦略は,これらの2つの技術指標のクロスオーバー信号を分析することによって市場のトレンドターニングポイントを特定し,それによって潜在的な取引機会を把握する.この戦略は,誤った信号を効果的に削減し,取引精度を向上させるために複数の指標クロスバリダーション方法を採用している.
戦略の原則
戦略の基本論理は2つの主要な指標システムに基づいています
- ストキャスティックRSI:
- RSI 期間が 17 に設定され,ストカスティック 期間が 20 に設定される.
- K線とD線の交差点が主要な信号として機能する
- K値が17未満,D値が23未満で,K線がD線の上を横切ると長信号が発信される.
- K値が99を超え,D値が90を超え,K線がD線以下に交差するときに短信号が発信される.
- 2つの移動平均システム:
- 速度のMA期間を10に設定し,緩やかなMA期間を20に設定する
- MA ポジション関係がトレンド方向性を確認する
- 急速なMAsと遅いMAsのクロスオーバーは,トレンド逆転の補完信号を提供します.
戦略 の 利点
- 複数の指標の検証: より信頼性の高い取引シグナルのために動力とトレンド指標を組み合わせます
- パラメータ最適化: 市場変動に最適化された指標パラメータがより良く適応する
- リスク管理: 厳格な信号発信条件により,誤った信号を効果的に減らす
- 自動化実行: 戦略は自動化取引を通じて実行され,人間の介入を減らすことができます
- 高い柔軟性:パラメータは,異なる市場状況に応じて調整できます.
戦略リスク
- 遅延リスク: 移動平均値は本質的に遅延があり,潜在的に不適正なエントリーポイントにつながる可能性があります.
- 振動リスク: 振動市場で頻繁に誤った信号を生む可能性があります.
- パラメータ敏感性: 戦略の有効性はパラメータ設定に敏感であり,定期的な最適化が必要です.
- 市場環境依存性: 強い傾向のある市場では良好なパフォーマンスを発揮するが,他の市場条件では劣悪なパフォーマンスを発揮する可能性がある
戦略の最適化方向
- 波動性フィルターを導入する:
- 市場変動を評価するためのATR指標を追加する
- 変動レベルに基づいてポジションサイズを動的に調整する
- シグナル確認メカニズムを最適化:
- 音量指標の検証を追加する
- トレンド強さを確認する指標を組み込む
- リスク管理システムの改善:
- ストップ・ロストとテイク・プロフィートのダイナミックなレベルを導入する
- ポジション管理を最適化する
概要
この戦略は,ストーカスティックRSIと移動平均値を組み合わせて比較的完全なトレンドフォローする取引システムを構築する.この戦略の強みは,誤った信号による干渉を効果的に軽減する複数の指標クロス検証メカニズムにあります.しかし,特に振動する市場でリスク管理に注意を払わなければならない.継続的な最適化と改善を通じて,この戦略は実際の取引でより良いパフォーマンスを期待しています.
/*backtest
start: 2019-12-23 08:00:00
end: 2024-12-25 08:00:00
period: 1d
basePeriod: 1d
exchanges: [{"eid":"Futures_Binance","currency":"BTC_USDT"}]
*/

// This Pine Script™ code is subject to the terms of the Mozilla Public License 2.0 at https://mozilla.org/MPL/2.0/
// © Quantuan_Research

//@version=6
version=6
strategy("Quantuan Research - Alpha", overlay=true, pyramiding=200, default_qty_value=1)


// Define Stochastic RSI settings
lengthRSI = input(17, title="RSI Length")
lengthStoch = input(20, title="Stochastic Length")
src = input(close, title="Source")
rsi = ta.rsi(src, lengthRSI)
k = ta.stoch(rsi, rsi, rsi, lengthStoch)
d = ta.sma(k, 3)

// Define MA settings
fastMALength = input(10, title="Fast MA Length")
slowMALength = input(20, title="Slow MA Length")
fastMA = ta.sma(close, fastMALength)
slowMA = ta.sma(close, slowMALength)

// Define long and short conditions
longCondition = k < 17 and d < 23 and k > d
shortCondition = k > 99 and d > 90 and k < d

// Create long and short signals
if longCondition//@
    strategy.entry("Long", strategy.long)

if shortCondition
    strategy.entry("Short", strategy.short)

// Add alerts for long and short signals
alertcondition(longCondition, title="Long Signal", message="Long signal generated")
alertcondition(shortCondition, title="Short Signal", message="Short signal generated")

// Plot Moving Averages with color based on trend
plot(fastMA, color = fastMA > slowMA ? color.new(color.rgb(0, 255, 170), 0) : color.new(color.rgb(255, 0, 0), 0), title = 'Fast MA')
plot(slowMA, color = color.new(color.rgb(255, 255, 0), 0), title = 'Slow MA')
関連性
- クリプト・ビッグ・ムーブ ストカスティック・RSI戦略
- MA,SMA,MA傾斜,ストップ損失を後押しし,再入力
- 動的サポート・レジスタンスのブレイク 移動平均クロスオーバー戦略
- 多期移動平均値とRSIモメントの交差トレンド 戦略に従う
- 多期移動平均値とRSIモメントクロス戦略
- 戦略をフォローする多動平均勢力の傾向
- 2つの移動平均RSIトレンドモメンタム戦略
- マルチテクニカル指標クロストレンド追跡戦略:RSIとストカスティックRSIシネージ取引システム
- 移動平均フィルター戦略による3回検証されたRSI平均逆転
- 機械学習にインスパイアされた二重移動平均RSI取引戦略
もっと
- プルバック最適化システムを持つ多期指数移動平均のダイナミッククロス戦略
- ダイナミック・ムービング・メアージャー・クロスオーバー・トレンド 適応型リスク管理による戦略
- ストカスティックRSIをベースにした適応型取引戦略
- 動的ポジションスケーリングシステムを持つ多レベル機関オーダーフロー量的な戦略
- マルチEMA動的トレンドキャプチャ量的な取引戦略
- 固定ストップ・ロスの最適化モデルによる動的移動平均値とボリンジャー・バンドのクロス戦略
- RSIトレンド逆転取引戦略 ATRストップ損失と取引エリア制御
- オシレーターとダイナミックサポート/レジスタンスの取引戦略を持つマルチEMAクロス
- 複数のSMAとストーカスティックの組み合わせたトレンド
- 標準化されたロガリズムリターンに基づく適応動的取引戦略
- 多指標トレンドクロシング戦略: ブール市場サポートバンド取引システム
- マルチレベルダイナミックMACDトレンドフォロー戦略 52週間の高低延長分析システム
- 双 EMA RSI モメンタム トレンド 逆転 トレーディング システム - EMA と RSI クロスオーバー をベースにしたモメンタム 突破戦略
- 多指標高周波範囲取引戦略
- 動的トレンドライン ブレイク逆転取引戦略
- EMAとSMAに基づく戦略をフォローする多指標動的傾向
- 強化されたフィボナッチトレンドフォローとリスク管理戦略
- 適性多態EMA-RSIモメントストラテジーは,ショッピネスインデックスフィルターシステム
- インテリジェント指数関数移動平均取引戦略最適化システム
- AI駆動波動性価格システム ダイバージェンス・トレーディング戦略