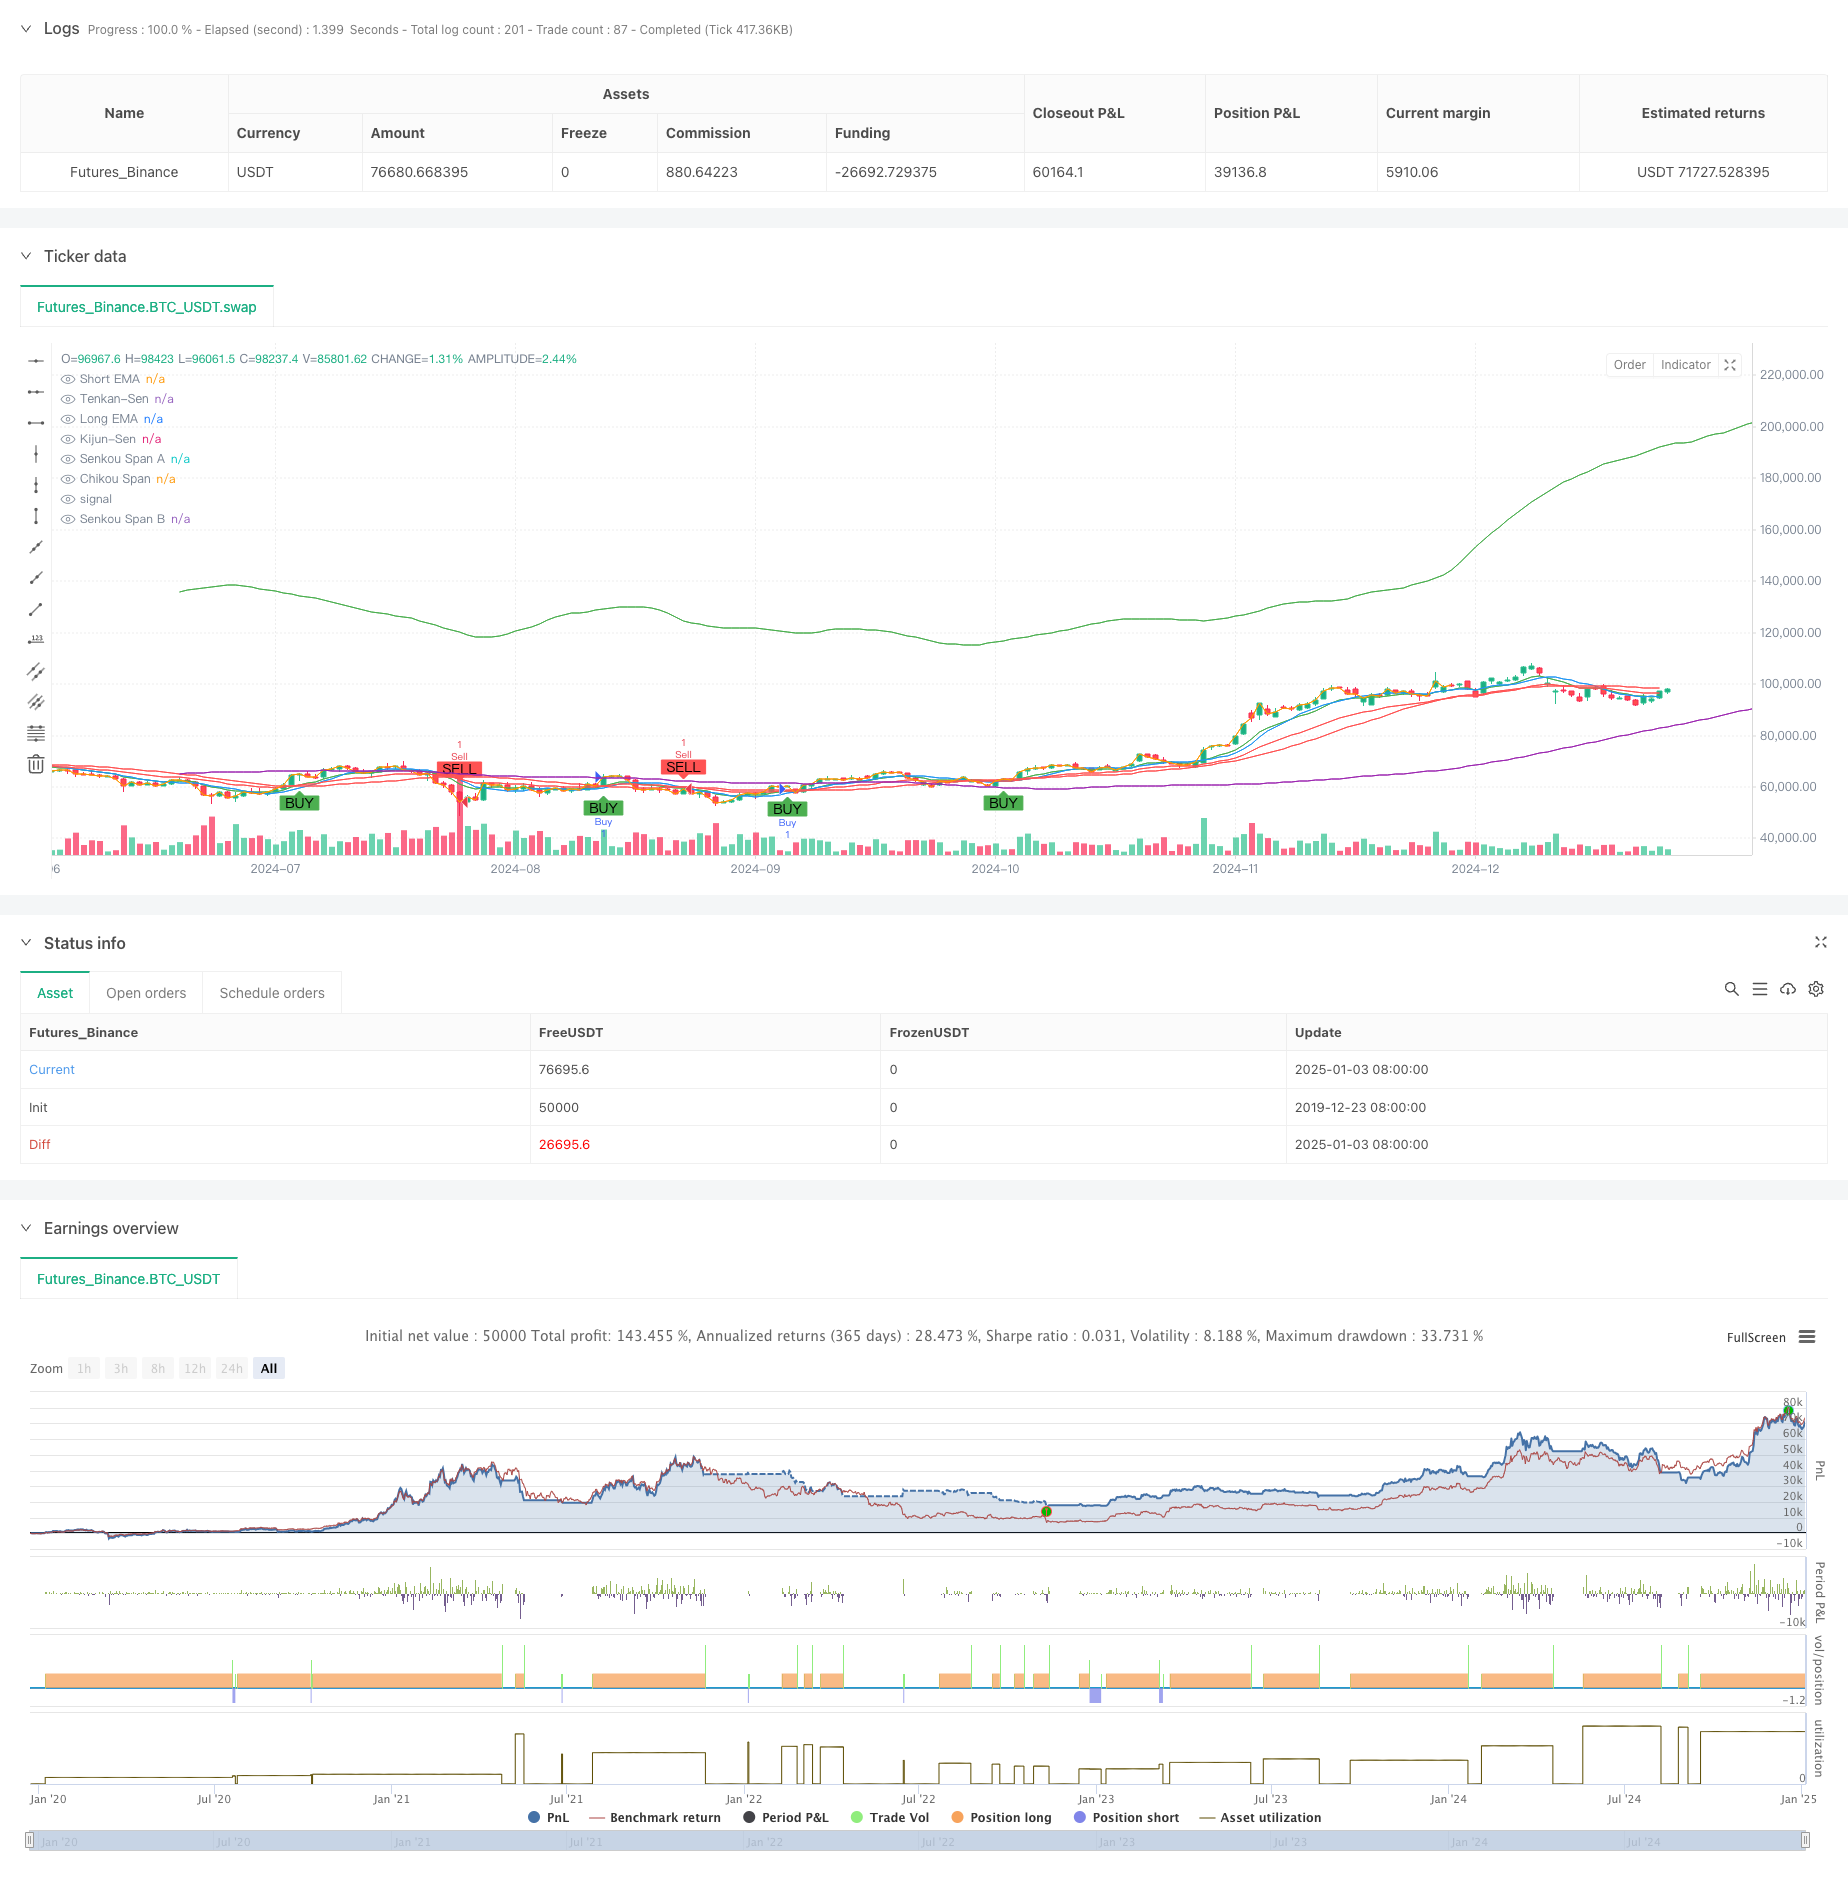
先進的な定量的なトレンドフォローとクラウド逆転複合取引戦略
作者: リン・ハーンチャオチャン, 日付: 2025-01-06 10:56:42タグ:エイマSMA

概要
この戦略は,指数移動平均値 (EMA) クロスオーバーとイチモク・クラウドを組み合わせた複合取引システムである. EMA クロスオーバーは主にトレンド開始信号と購入機会を確認するために使用され,イチモク・クラウドは市場の逆転を特定し,販売ポイントを決定するために使用される.多次元的な技術指標の調整を通じて,戦略は,リスクを及時回避しながら,効果的にトレンドを把握することができます.
戦略原則
戦略は2つの主要な要素を介して機能します.
- EMAクロスオーバー・バイ・シグナル: トレンド指向を確認するために,短期 (9日) と長期 (21日) の指数関数移動平均のクロスオーバーを使用する.短期EMAが長期EMAを超えるとバイ・シグナルが生成され,短期の勢力の強化を示します.
- イチモク・クラウド・セール・シグナル: クラウドと内部クラウド構造との関係で価格位置によるトレンド逆転を決定する. 価格がクラウド以下に突破したり,リーディング・スペンAがリーディング・スペンB以下に突破したとき,セール・シグナルが起動する. ストップ・ロスは1.5%で,テイク・プロフィートは3%です.
戦略 の 利点
- 多次元信号確認: EMAクロスオーバーとIchimoku Cloudの組み合わせにより,異なる視点から取引信号を検証できます.
- 総合的なリスク管理: 固定パーセントのストップ・ロストと利益目標は,各取引のリスクを効果的に制御します.
- 強いトレンドキャプチャ能力: EMAクロスオーバーはトレンド開始をキャプチャし,Ichimoku Cloudはトレンド終了を効果的に識別する.
- 明確で客観的なシグナル: 取引シグナルは技術指標によって自動的に生成され,主観的な判断の干渉を減らす.
戦略リスク
- 市場リスク: 横向市場では頻繁に誤った信号を発生させ,連続的なストップを引き起こす可能性があります.
- 遅延リスク:移動平均値とイチモク・クラウドの両方が固有の遅延があり,急速な市場動向で最適なエントリーポイントを欠いている可能性があります.
- パラメータ敏感性: 戦略のパフォーマンスはパラメータ設定に敏感で,異なる市場条件に調整する必要があります.
戦略の最適化
- 市場環境フィルターを追加する: 市場状況に基づいて戦略パラメータを調整するために,変動または傾向強さの指標を含める.
- ストップ・ロスのメカニズムを最適化する: トレイリング・ストップやATRベースのストップなどのダイナミック・ストップを導入することを検討する.
- シグナル確認を強化する: 信号信頼性を向上させるため,音量およびモメント指標を追加する.
- ポジションサイジングを実施する: 信号強さと市場の変動に基づいてポジションサイズの動的調整.
概要
この戦略は,EMAクロスオーバーとイチモク・クラウドの有機的な組み合わせを通じて,トレンドフォローと逆転の捕獲の両方を可能にする取引システムを構築する.戦略設計は適切なリスク制御と合理的で,実用的な応用価値を示している.提案された最適化方向性を通じて,さらなる改善の余地がある.ライブ取引では,まずバックテストを通じて適切なパラメータ組み合わせを決定し,実際の市場状況に基づいて動的調整を行うことが推奨される.
/*backtest
start: 2019-12-23 08:00:00
end: 2025-01-04 08:00:00
period: 1d
basePeriod: 1d
exchanges: [{"eid":"Futures_Binance","currency":"BTC_USDT"}]
*/

//@version=5
strategy("EMA Crossover Buy + Ichimoku Cloud Sell Strategy", overlay=true)

// Input Parameters for the EMAs
shortEmaPeriod = input.int(9, title="Short EMA Period", minval=1)
longEmaPeriod = input.int(21, title="Long EMA Period", minval=1)

// Input Parameters for the Ichimoku Cloud
tenkanPeriod = input.int(9, title="Tenkan-Sen Period", minval=1)
kijunPeriod = input.int(26, title="Kijun-Sen Period", minval=1)
senkouSpanBPeriod = input.int(52, title="Senkou Span B Period", minval=1)
displacement = input.int(26, title="Displacement", minval=1)

// Calculate the EMAs
shortEma = ta.ema(close, shortEmaPeriod)
longEma = ta.ema(close, longEmaPeriod)

// Ichimoku Cloud Calculations
tenkanSen = ta.sma(close, tenkanPeriod)
kijunSen = ta.sma(close, kijunPeriod)
senkouSpanA = ta.sma(tenkanSen + kijunSen, 2)
senkouSpanB = ta.sma(close, senkouSpanBPeriod)
chikouSpan = close[displacement]

// Plot the EMAs on the chart
plot(shortEma, color=color.green, title="Short EMA")
plot(longEma, color=color.red, title="Long EMA")

// Plot the Ichimoku Cloud
plot(tenkanSen, color=color.blue, title="Tenkan-Sen")
plot(kijunSen, color=color.red, title="Kijun-Sen")
plot(senkouSpanA, color=color.green, title="Senkou Span A", offset=displacement)
plot(senkouSpanB, color=color.purple, title="Senkou Span B", offset=displacement)
plot(chikouSpan, color=color.orange, title="Chikou Span", offset=-displacement)

// Buy Condition: Short EMA crosses above Long EMA
buyCondition = ta.crossover(shortEma, longEma)

// Sell Condition: Tenkan-Sen crosses below Kijun-Sen, and price is below the cloud
sellCondition = ta.crossunder(tenkanSen, kijunSen) and close < senkouSpanA and close < senkouSpanB

// Plot Buy and Sell signals
plotshape(series=buyCondition, title="Buy Signal", location=location.belowbar, color=color.green, style=shape.labelup, text="BUY")
plotshape(series=sellCondition, title="Sell Signal", location=location.abovebar, color=color.red, style=shape.labeldown, text="SELL")

// Execute Buy and Sell Orders
if (buyCondition)
    strategy.entry("Buy", strategy.long)

if (sellCondition)
    strategy.entry("Sell", strategy.short)

// Optional: Add Stop Loss and Take Profit (risk management)
stopLossPercentage = input.float(1.5, title="Stop Loss Percentage", minval=0.1) / 100
takeProfitPercentage = input.float(3.0, title="Take Profit Percentage", minval=0.1) / 100

longStopLoss = close * (1 - stopLossPercentage)
longTakeProfit = close * (1 + takeProfitPercentage)

shortStopLoss = close * (1 + stopLossPercentage)
shortTakeProfit = close * (1 - takeProfitPercentage)

strategy.exit("Take Profit/Stop Loss", "Buy", stop=longStopLoss, limit=longTakeProfit)
strategy.exit("Take Profit/Stop Loss", "Sell", stop=shortStopLoss, limit=shortTakeProfit)
関連性
- ダイナミックチャネルの割合 封筒戦略
- ハルク4エマ
- BMSBの脱出戦略
- EMA/SMA トレンドフォロー スウィング・トレーディング戦略 総量フィルターとパーセントのテイク・プロフィート/ストップ・ロース・システム
- 戦略をフォローする多動平均傾向 - EMAとSMA指標に基づく長期投資シグナルシステム
- 長期トレンドSMAクロスオーバー量的な戦略
- トレンド確認付きのマルチEMAクロスオーバー戦略
- ブレイクゾーンモメンタム取引戦略
- 2つのタイムフレームダイナミックサポート取引システム
- 2つの移動平均のクロスオーバー戦略
- クロスオーバー移動平均値に基づいた適応型予想値評価戦略の傾向
もっと
- 多指標動的波動性取引戦略
- ダイナミック・トレード理論:指数的な移動平均値と累積的なボリューム期間クロスオーバー戦略
- ADX トレンド強度フィルタリングシステムによるダイナミック・EMA・クロスオーバー戦略
- 多期トレンド線形吸収パターン 定量的な取引戦略
- ダイナミックなサポートとレジスタンスの取引システムを持つ適応チャネルブレークアウト戦略
- ダイナミックフィルタリング 日々のトレンド分析のためのEMAクロス戦略
- マルチEMAクロスオーバーとカマリラ・サポート/レジスタンスのトレンド・トレーディング・システム
- 強化されたトレンド・マルチ・シグナル・ダイナミック・トレーディング・戦略
- アダプティブ・モメンテム・マルティンゲール・トレーディング・システム
- RSIと移動平均の組み合わせた定量取引戦略の傾向
- 戦略最適化モデルをフォローする5日間のEMAベースのトレンド
- 多レベル多期EMAクロスオーバー ダイナミック・テイク・プロフィート最適化戦略
- 複数の技術指標のシネージスト取引システム
- 多技術指標に基づく高周波ダイナミック最適化戦略
- トリプル・スーパートレンドと指数関数移動平均トレンド
- クラウドベースのボリンガー帯 双動平均量的な傾向戦略
- Bollinger Bands Trend Divergence に基づいた多レベル量的な取引戦略
- フィボナッチ0.7レベルトレンドブレークスルーに基づく定量的な取引戦略
- 多期フラクタルブレイクオーダーブロック 適応型取引戦略
- 移動平均のクロスオーバーに基づくリスク/報酬比最適化戦略