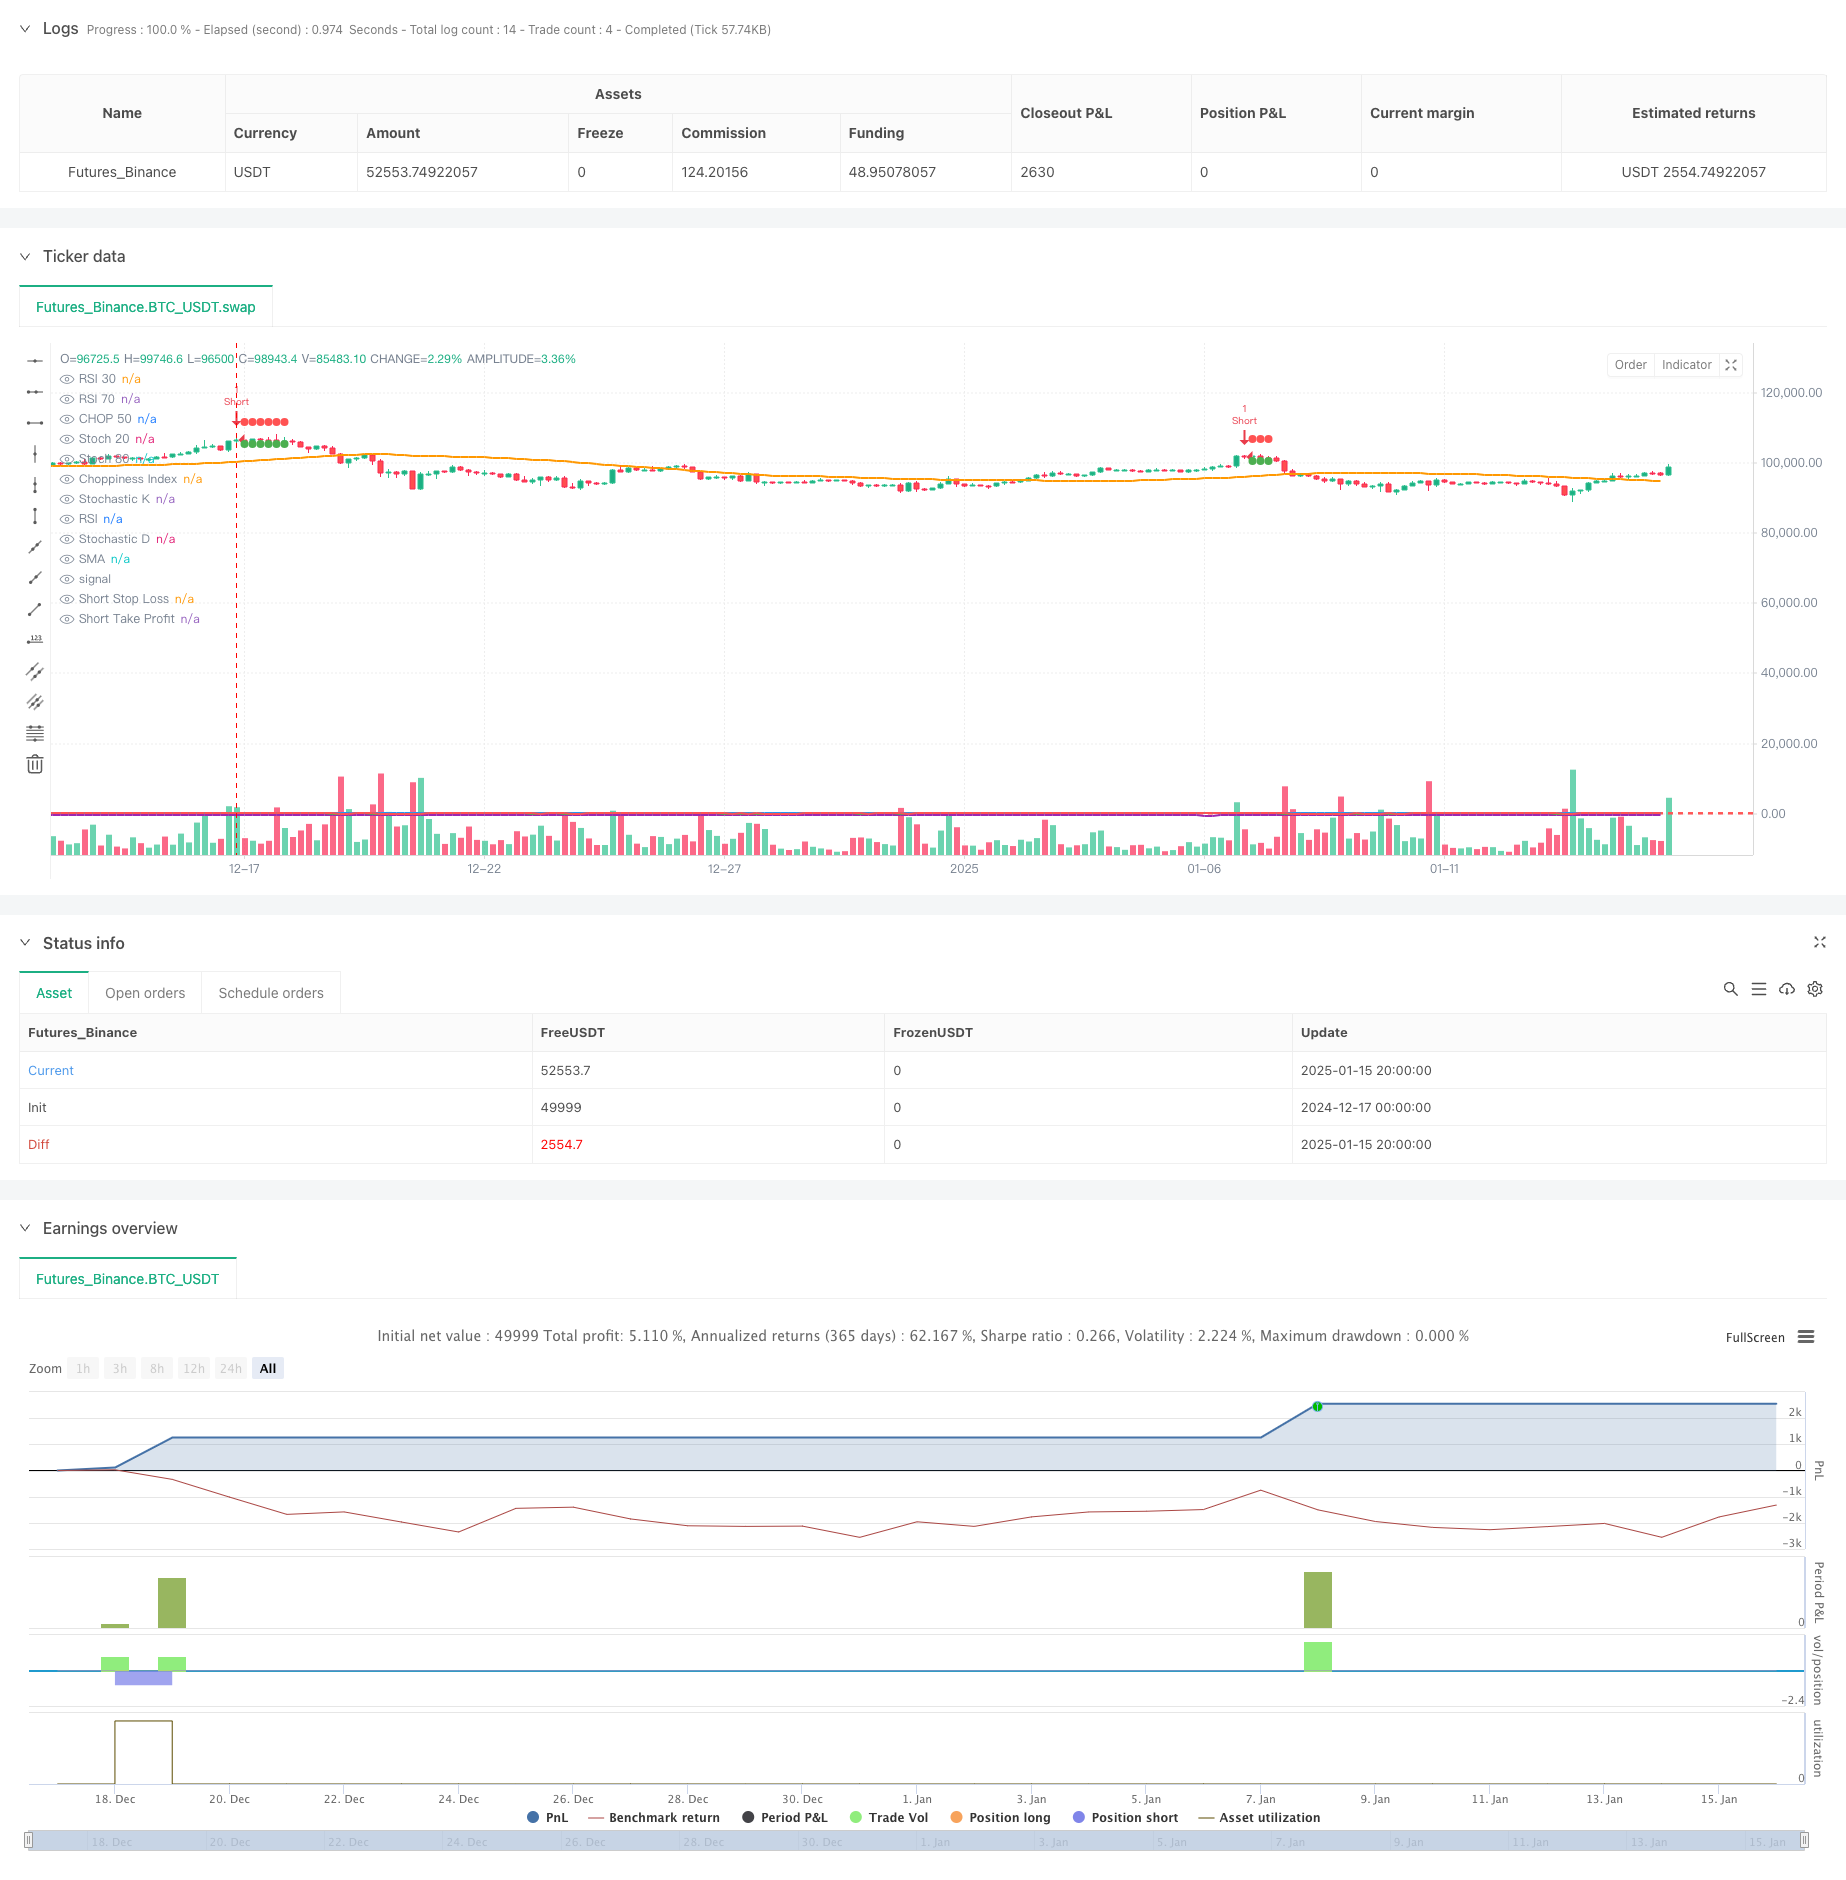
概要
この戦略は、複数のテクニカル指標を組み合わせた自動取引システムです。主にRSI(相対力指数)、CHOP(クロスオシレーション指数)、ストキャスティクスの調整を通じて市場のトレンドを特定し、動的なストッププロフィットとストップロスを使用して、市場。損失管理取引リスク。この戦略では、短期取引に 5 分間の時間枠を使用し、複数の指標の相互検証を通じて取引の精度と信頼性を向上させます。
戦略原則
この戦略では、トレンドの判断と取引シグナルの生成に 4 つのコア指標を使用します。
- RSI は買われすぎと売られすぎの状態を判断するために使用されます。RSI が 30 未満の場合は売られすぎ、70 を超える場合は買われすぎとみなされます。
- CHOP 指数は、市場がショック状態にあるかどうかを判断するために使用されます。<50 は明確なトレンドを示します。
- ストキャスティクス指標のKラインとDラインのクロスオーバーは、取引機会を確認するために使用されます。
- SMA(単純移動平均)は、全体的な傾向を判断するのに役立ちます。
取引ルールは以下の通りです。
- ロング条件: RSI<30 + CHOP<50 + KラインがDラインを横切る
- 空売り条件: RSI>70 + CHOP<50 + KラインがDラインを下回る この戦略は、動的な利益確定ポジションと損切りポジションをパーセンテージで設定することでリスク管理を実現します。
戦略的優位性
- 複数指標のクロス検証により信号の信頼性が向上
- 誤ったシグナルを減らすためにCHOPインデックスを通じて不安定な市場をフィルタリングする
- ダイナミックなストッププロフィットとストップロスのメカニズムにより、エントリー価格に応じてリスク管理ポジションを自動的に調整します。
- 5分周期を採用し、短期取引に適しており、ポジションリスクを軽減します。
- インデックスパラメータは調整可能で、適応性が高い
戦略リスク
- 複数の指標により、取引シグナルが遅れる可能性がある
- 非常に不安定な市場では、取引の機会を逃す可能性があります
- 固定パーセンテージのストップロスとテイクプロフィットは、すべての市場状況に適しているわけではない。
- 短期取引は市場のノイズの影響をより受けやすい リスクを軽減するために、資金管理とポジション管理を採用することをお勧めします。
戦略最適化の方向性
- 市場のボラティリティに応じて指標パラメータを動的に調整する適応パラメータメカニズムを導入する
- 取引シグナルの有効性を向上させるためにボリュームインジケーター検証を追加します
- 市場のボラティリティに応じてリスク管理レベルを自動的に調整する動的なストッププロフィットおよびストップロスアルゴリズムを開発する
- 取引機会の選択をさらに最適化するためにトレンド強度フィルターを追加しました
- ボラティリティの高い期間を避けるため、時間フィルタリングを追加することを検討してください。
要約する
この戦略は、複数の指標と厳格なリスク管理を組み合わせることで、比較的完全な取引システムを構築します。最適化が必要な領域がいくつかありますが、全体的な設計アイデアは明確であり、実用的な応用価値があります。継続的な最適化とパラメータ調整により、戦略の安定性と収益性をさらに向上させることができます。
ストラテジーソースコード
/*backtest
start: 2024-12-17 00:00:00
end: 2025-01-16 00:00:00
period: 4h
basePeriod: 4h
exchanges: [{"eid":"Futures_Binance","currency":"BTC_USDT","balance":49999}]
*/

//@version=5
strategy("RSI + CHOP + Stochastic Strategy", overlay=true)

// Parametry wskaźników
rsiPeriod = input(14, title="RSI Period")
chopPeriod = input(14, title="Choppiness Period")
stochK = input(14, title="Stochastic K Period")
stochD = input(3, title="Stochastic D Period")
stochSmoothK = input(3, title="Stochastic Smooth K Period")
smaPeriod = input(50, title="SMA Period")

// Parametry Take Profit i Stop Loss
longTakeProfitPct = input.float(1.0, title="Long Take Profit %", minval=0.1, step=0.1) / 100
longStopLossPct = input.float(5.0, title="Long Stop Loss %", minval=0.1, step=0.1) / 100
shortTakeProfitPct = input.float(1.0, title="Short Take Profit %", minval=0.1, step=0.1) / 100
shortStopLossPct = input.float(5.0, title="Short Stop Loss %", minval=0.1, step=0.1) / 100

// Obliczenia wskaźników
rsiValue = ta.rsi(close, rsiPeriod)

highLowRange = ta.highest(high, chopPeriod) - ta.lowest(low, chopPeriod)
chopIndex = 100 * math.log10(highLowRange / ta.sma(close, chopPeriod)) / math.log10(2)

stoch = ta.stoch(close, high, low, stochK)
k = stoch[0]
d = stoch[1]

// Obliczenia SMA
smaValue = ta.sma(close, smaPeriod)

// Warunki kupna i sprzedaży
buyCondition = (rsiValue < 30) and (chopIndex < 50) and (ta.crossover(k, d))
sellCondition = (rsiValue > 70) and (chopIndex < 50) and (ta.crossunder(k, d))

var float longStopLevel = na
var float longTakeProfitLevel = na
var float shortStopLevel = na
var float shortTakeProfitLevel = na

// Wejście w pozycję długą
if (buyCondition and na(longStopLevel))
    strategy.entry("Long", strategy.long)
    longStopLevel := na // Zresetuj poziom Stop Loss
    longTakeProfitLevel := na // Zresetuj poziom Take Profit

// Wejście w pozycję krótką
if (sellCondition and na(shortStopLevel))
    strategy.entry("Short", strategy.short)
    shortStopLevel := na // Zresetuj poziom Stop Loss
    shortTakeProfitLevel := na // Zresetuj poziom Take Profit

// Ustaw poziomy Take Profit i Stop Loss na podstawie ceny wejścia w pozycję
if (strategy.position_size > 0 and na(longTakeProfitLevel))
    longStopLevel := strategy.position_avg_price * (1 - longStopLossPct)
    longTakeProfitLevel := strategy.position_avg_price * (1 + longTakeProfitPct)

if (strategy.position_size < 0 and na(shortTakeProfitLevel))
    shortStopLevel := strategy.position_avg_price * (1 + shortStopLossPct)
    shortTakeProfitLevel := strategy.position_avg_price * (1 - shortTakeProfitPct)

// Resetowanie poziomów po wyjściu z pozycji
if (strategy.position_size == 0)
    longStopLevel := na
    longTakeProfitLevel := na
    shortStopLevel := na
    shortTakeProfitLevel := na

// Wyjście z pozycji długiej
if (strategy.position_size > 0)
    strategy.exit("Take Profit", "Long", limit=longTakeProfitLevel, stop=longStopLevel)

// Wyjście z pozycji krótkiej
if (strategy.position_size < 0)
    strategy.exit("Take Profit", "Short", limit=shortTakeProfitLevel, stop=shortStopLevel)

// Oznaczenie poziomów stop loss i take profit na wykresie
plot(series=longStopLevel, title="Long Stop Loss", color=color.red, linewidth=1, style=plot.style_circles)
plot(series=longTakeProfitLevel, title="Long Take Profit", color=color.green, linewidth=1, style=plot.style_circles)
plot(series=shortStopLevel, title="Short Stop Loss", color=color.red, linewidth=1, style=plot.style_circles)
plot(series=shortTakeProfitLevel, title="Short Take Profit", color=color.green, linewidth=1, style=plot.style_circles)

// Wyświetlanie wskaźników na wykresie
plot(rsiValue, title="RSI", color=color.blue, linewidth=2)
hline(30, "RSI 30", color=color.red)
hline(70, "RSI 70", color=color.red)

plot(chopIndex, title="Choppiness Index", color=color.purple, linewidth=2)
hline(50, "CHOP 50", color=color.red)

plot(k, title="Stochastic K", color=color.green, linewidth=2)
plot(d, title="Stochastic D", color=color.red, linewidth=2)
hline(20, "Stoch 20", color=color.red)
hline(80, "Stoch 80", color=color.red)

// Wyświetlanie SMA na wykresie
plot(smaValue, title="SMA", color=color.orange, linewidth=2)