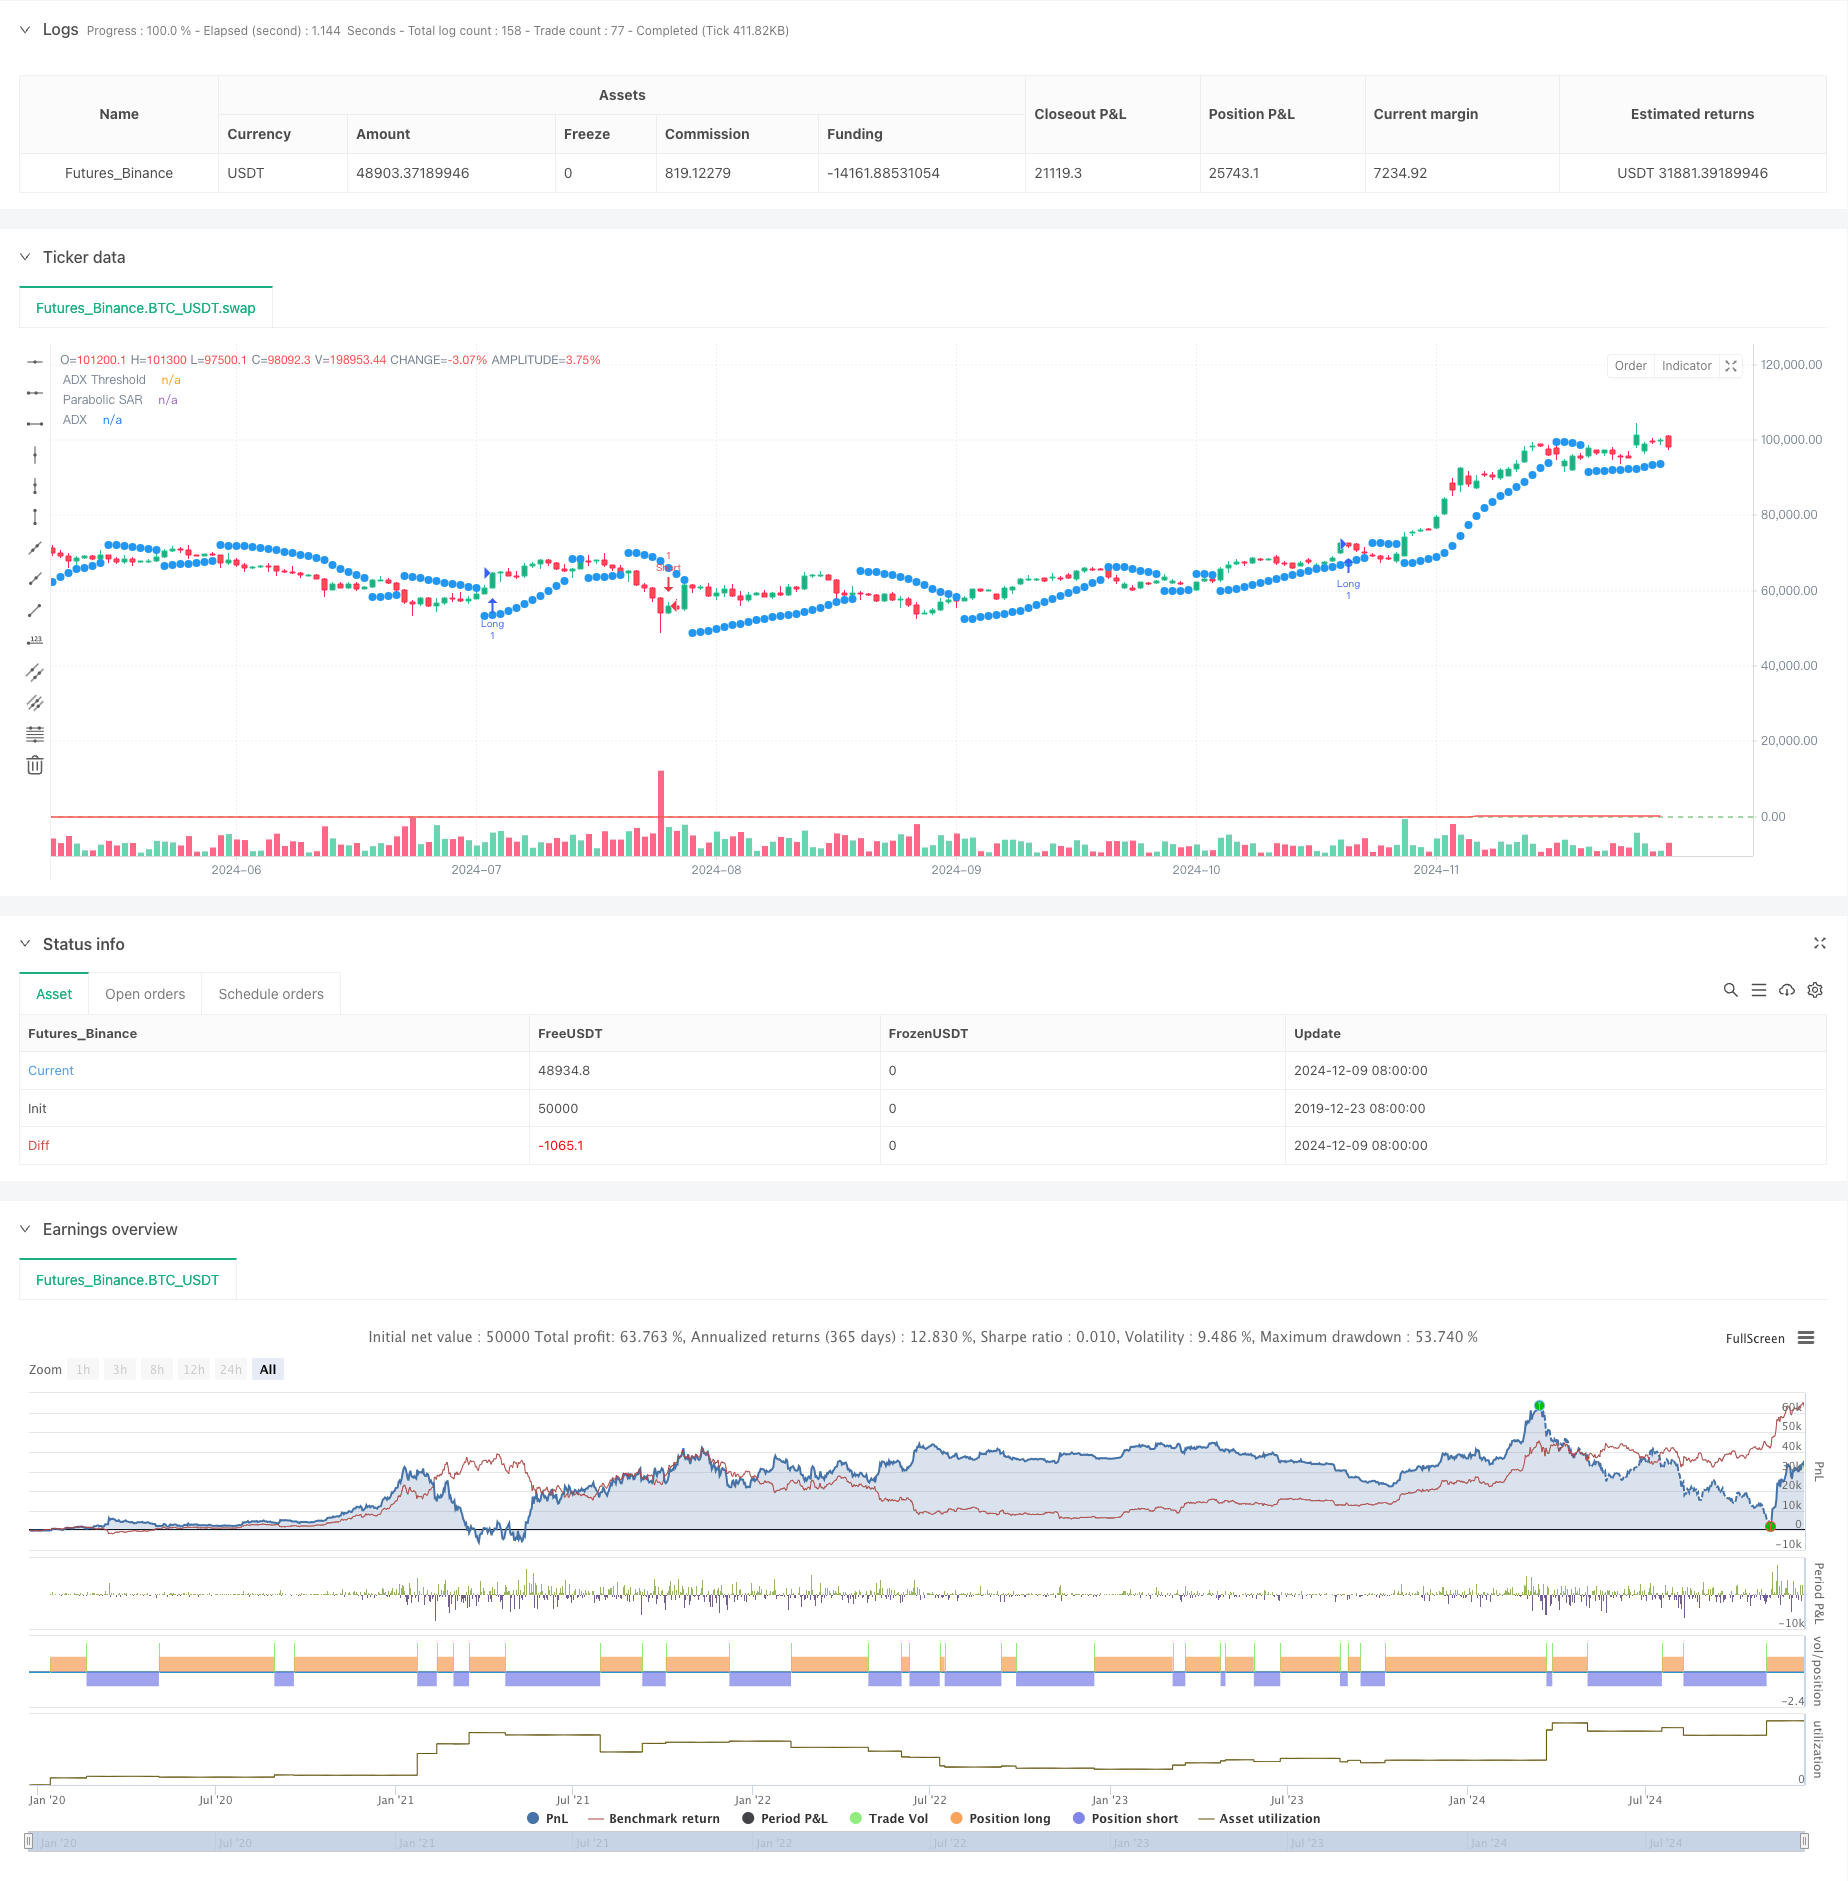
증강된 트렌드 추적 시스템: ADX 및 파라볼 SAR를 기반으로 동적 트렌드 식별
저자:차오장, 날짜: 2024-12-12 14:21:47태그:ADXSARDMI

전반적인 설명
이 전략은 트렌드를 따르는 거래 시스템으로 평균 방향 지표 (ADX) 와 파라볼릭 스톱 앤 리버스 (SAR) 지표를 결합합니다. 이 시스템은 ADX를 사용하여 트렌드 강도를 측정하고 강한 트렌딩 시장에서 거래 기회를 포착하기 위해 SAR를 사용하여 트렌드 방향을 확인합니다. 트렌드의 존재와 신뢰성을 보장하기 위해 이중 확인 메커니즘을 사용합니다.
전략 원칙
핵심 논리는 다음과 같은 핵심 구성 요소에 기반합니다.
- ADX 지표는 트렌드 강도를 측정하는데, 25 이상의 값은 중요한 트렌드를 나타냅니다.
- DI+와 DI- 크로스오버는 트렌드 방향을 결정하고, DI+> DI-는 상승세를 나타냅니다.
- 파라볼리 SAR는 동적으로 스톱 포인트를 조정하여 가격 움직임을 추적하여 추가 트렌드 확인을 제공합니다.
트레이드 신호 트리거는 다음과 같습니다.
- 롱 엔트리: ADX>25, DI+>DI- 및 SAR 이상의 가격
- 짧은 항목: ADX>25, DI->DI+, SAR 이하의 가격
- 출입: 반대 거래 신호가 나타나면
전략적 장점
- 이중 확인 메커니즘은 신호 신뢰성을 크게 향상시킵니다.
- 동적 스톱 로스는 기존 수익을 보호하는 데 도움이 됩니다.
- 다양한 시장 조건에 대한 높은 매개 변수 적응력
- 명확한 전략 논리, 이해하기 쉽고 실행하기 쉬운
- 강력한 트렌드 시장에서 우수한 성과
전략 위험
- 오시일레이션 시장에서 빈번한 잘못된 신호를 생성할 수 있습니다.
- 엔트리 포인트는 트렌드 시작보다 늦을 수 있습니다.
- 급격한 환전 시 상당한 마감 가능성
- 매개 변수 설정은 전략 성능에 상당한 영향을 줄 수 있습니다.
위험 관리 제안:
- 최대 유출 제한을 설정
- 시장 변동성에 따라 매개 변수를 조정합니다.
- 거래 확인을 위한 추가 기술 지표를 포함
- 포지션 관리 전략을 실행
전략 최적화 방향
-
변수 조정을 위한 변동성 지표를 도입
- 높은 변동성 기간 동안 ADX 문턱을 높여야 합니다
- 낮은 변동성 기간 동안 SAR 감수성을 줄이십시오.
-
출구 메커니즘 최적화
- 이윤 추가 목표
- 동적 스톱 로스 전략 설계
-
시장 환경 필터를 추가
- 트렌드 라인 분석을 포함
- 부피 요인을 고려
-
포지션 관리 개선
- ATR에 기초한 설계 위치 크기
- 단계별로 출입/출입
요약
이 전략은 ADX와 SAR 지표를 결합하여 강력한 트렌드 다음 시스템을 구축합니다. 주요 장점은 이중 확인 메커니즘과 동적 스톱 로스 설정에 있습니다. 비록 오스실레이션 시장에서 성능이 최적화되지 않을 수 있습니다. 적절한 매개 변수 최적화 및 위험 통제를 통해 전략은 명확하게 트렌딩 시장 환경에서 좋은 성능을 얻을 수 있습니다. 거래자는 라이브 구현 전에 철저한 백테스팅을 수행하고 특정 시장 특성에 따라 매개 변수를 조정하는 것이 좋습니다.
/*backtest
start: 2019-12-23 08:00:00
end: 2024-12-10 08:00:00
period: 1d
basePeriod: 1d
exchanges: [{"eid":"Futures_Binance","currency":"BTC_USDT"}]
*/

// This Pine Script™ code is subject to the terms of the Mozilla Public License 2.0 at https://mozilla.org/MPL/2.0/
// © traderhub

//@version=5
strategy("Trend Following ADX + Parabolic SAR", overlay=true)

// Strategy parameters
adxLength = input(14, title="ADX Period")
adxThreshold = input(25, title="ADX Threshold")
adxSmoothing = input(14, title="ADX Smoothing")
sarStart = input(0.02, title="Parabolic SAR Start")  // Starting acceleration factor
sarIncrement = input(0.02, title="Parabolic SAR Increment")  // Increment step
sarMax = input(0.2, title="Parabolic SAR Max")  // Maximum acceleration factor

// Calculate ADX, DI+, and DI-
[diPlus, diMinus, adx] = ta.dmi(adxLength, adxSmoothing)

// Parabolic SAR calculation
sar = ta.sar(sarStart, sarIncrement, sarMax)

// Conditions for a long position
longCondition = adx > adxThreshold and diPlus > diMinus and close > sar

// Conditions for a short position
shortCondition = adx > adxThreshold and diMinus > diPlus and close < sar

// Enter a long position
if (longCondition)
    strategy.entry("Long", strategy.long)

// Enter a short position
if (shortCondition)
    strategy.entry("Short", strategy.short)

// Close position on reverse signal
if (strategy.position_size > 0 and shortCondition)
    strategy.close("Long")
if (strategy.position_size < 0 and longCondition)
    strategy.close("Short")

// Plot indicators on the chart
plot(sar, color=color.blue, style=plot.style_circles, linewidth=2, title="Parabolic SAR")
plot(adx, color=color.red, title="ADX")
hline(adxThreshold, "ADX Threshold", color=color.green)
관련
- 다중 지표 트렌드 수익 최적화 전략
- ADX 트렌드 브레이크업 모멘텀 거래 전략
- 다중 지표 조합 전략 (CCI, DMI, MACD, ADX)
- 멀티테크니컬 인디케이터 크로스오버 모멘텀 양적 거래 전략 - EMA, RSI 및 ADX에 기초한 통합 분석
- 15MIN BTCUSDTPERP BOT
- VWMA-ADX 모멘텀 및 트렌드 기반 비트코인 장기 전략
- 엘리엇 파동 이론 4-9 충동 파동 자동 탐지 거래 전략
- v4용 ADX 및 DI
- 파라볼 SAR
- SAR - 높고 낮다
더 많은
- 고주파량 양적 세션 거래 전략: 브레이크오웃 신호에 기반한 적응적 동적 포지션 관리 시스템
- 모멘텀 필터 통합 시스템으로 향상된 볼링거 브레이크업 양적 전략
- 다중 EMA 크로스오버 추진 동력 추세 전략
- 멀티 타겟 지능형 볼륨 모멘텀 거래 전략
- 다기간 볼링거 밴드 터치 트렌드 역전 양적 거래 전략
- 캔들스타크 근접 방향에 기반한 고주파 브레이크 트레이딩 전략
- 고급 동적 피보나치 리트레이싱 트렌드 양적 거래 전략
- 변수 지수 동적 평균 다단계 수익 동향 전략
- 동력과 부피 확증과 함께 멀티 이동 평균 거래 시스템 양적 트렌드 전략
- 적립적 인 후속 인수 균형 잡힌 거래 전략, 영업 취득 및 중단 손실
- 이중 시간 프레임 스토카스틱 모멘텀 거래 전략
- 적응적인 볼링거 밴드 역동적 포지션 관리 전략
- 동적 RSI 스마트 타이밍 스윙 거래 전략
- 촛불 흡수 패턴 분석에 기초한 양방향 거래 전략
- 평균 반전 4H 양적 거래 전략과 함께 볼링거 브레이크
- 동적 격자 위치 크기 전략을 따르는 경향
- 이중적인 BBI (Bulls and Bears Index) 크로스오버 전략
- 이동 평균 크로스오버 신호 시스템으로 동적 장기/단기 스윙 거래 전략
- 거래 전략에 따른 다기술 지표 트렌드
- 고급 변동성 평균 회전 거래 전략: VIX와 이동 평균에 기반한 다차원적 양적 거래 시스템