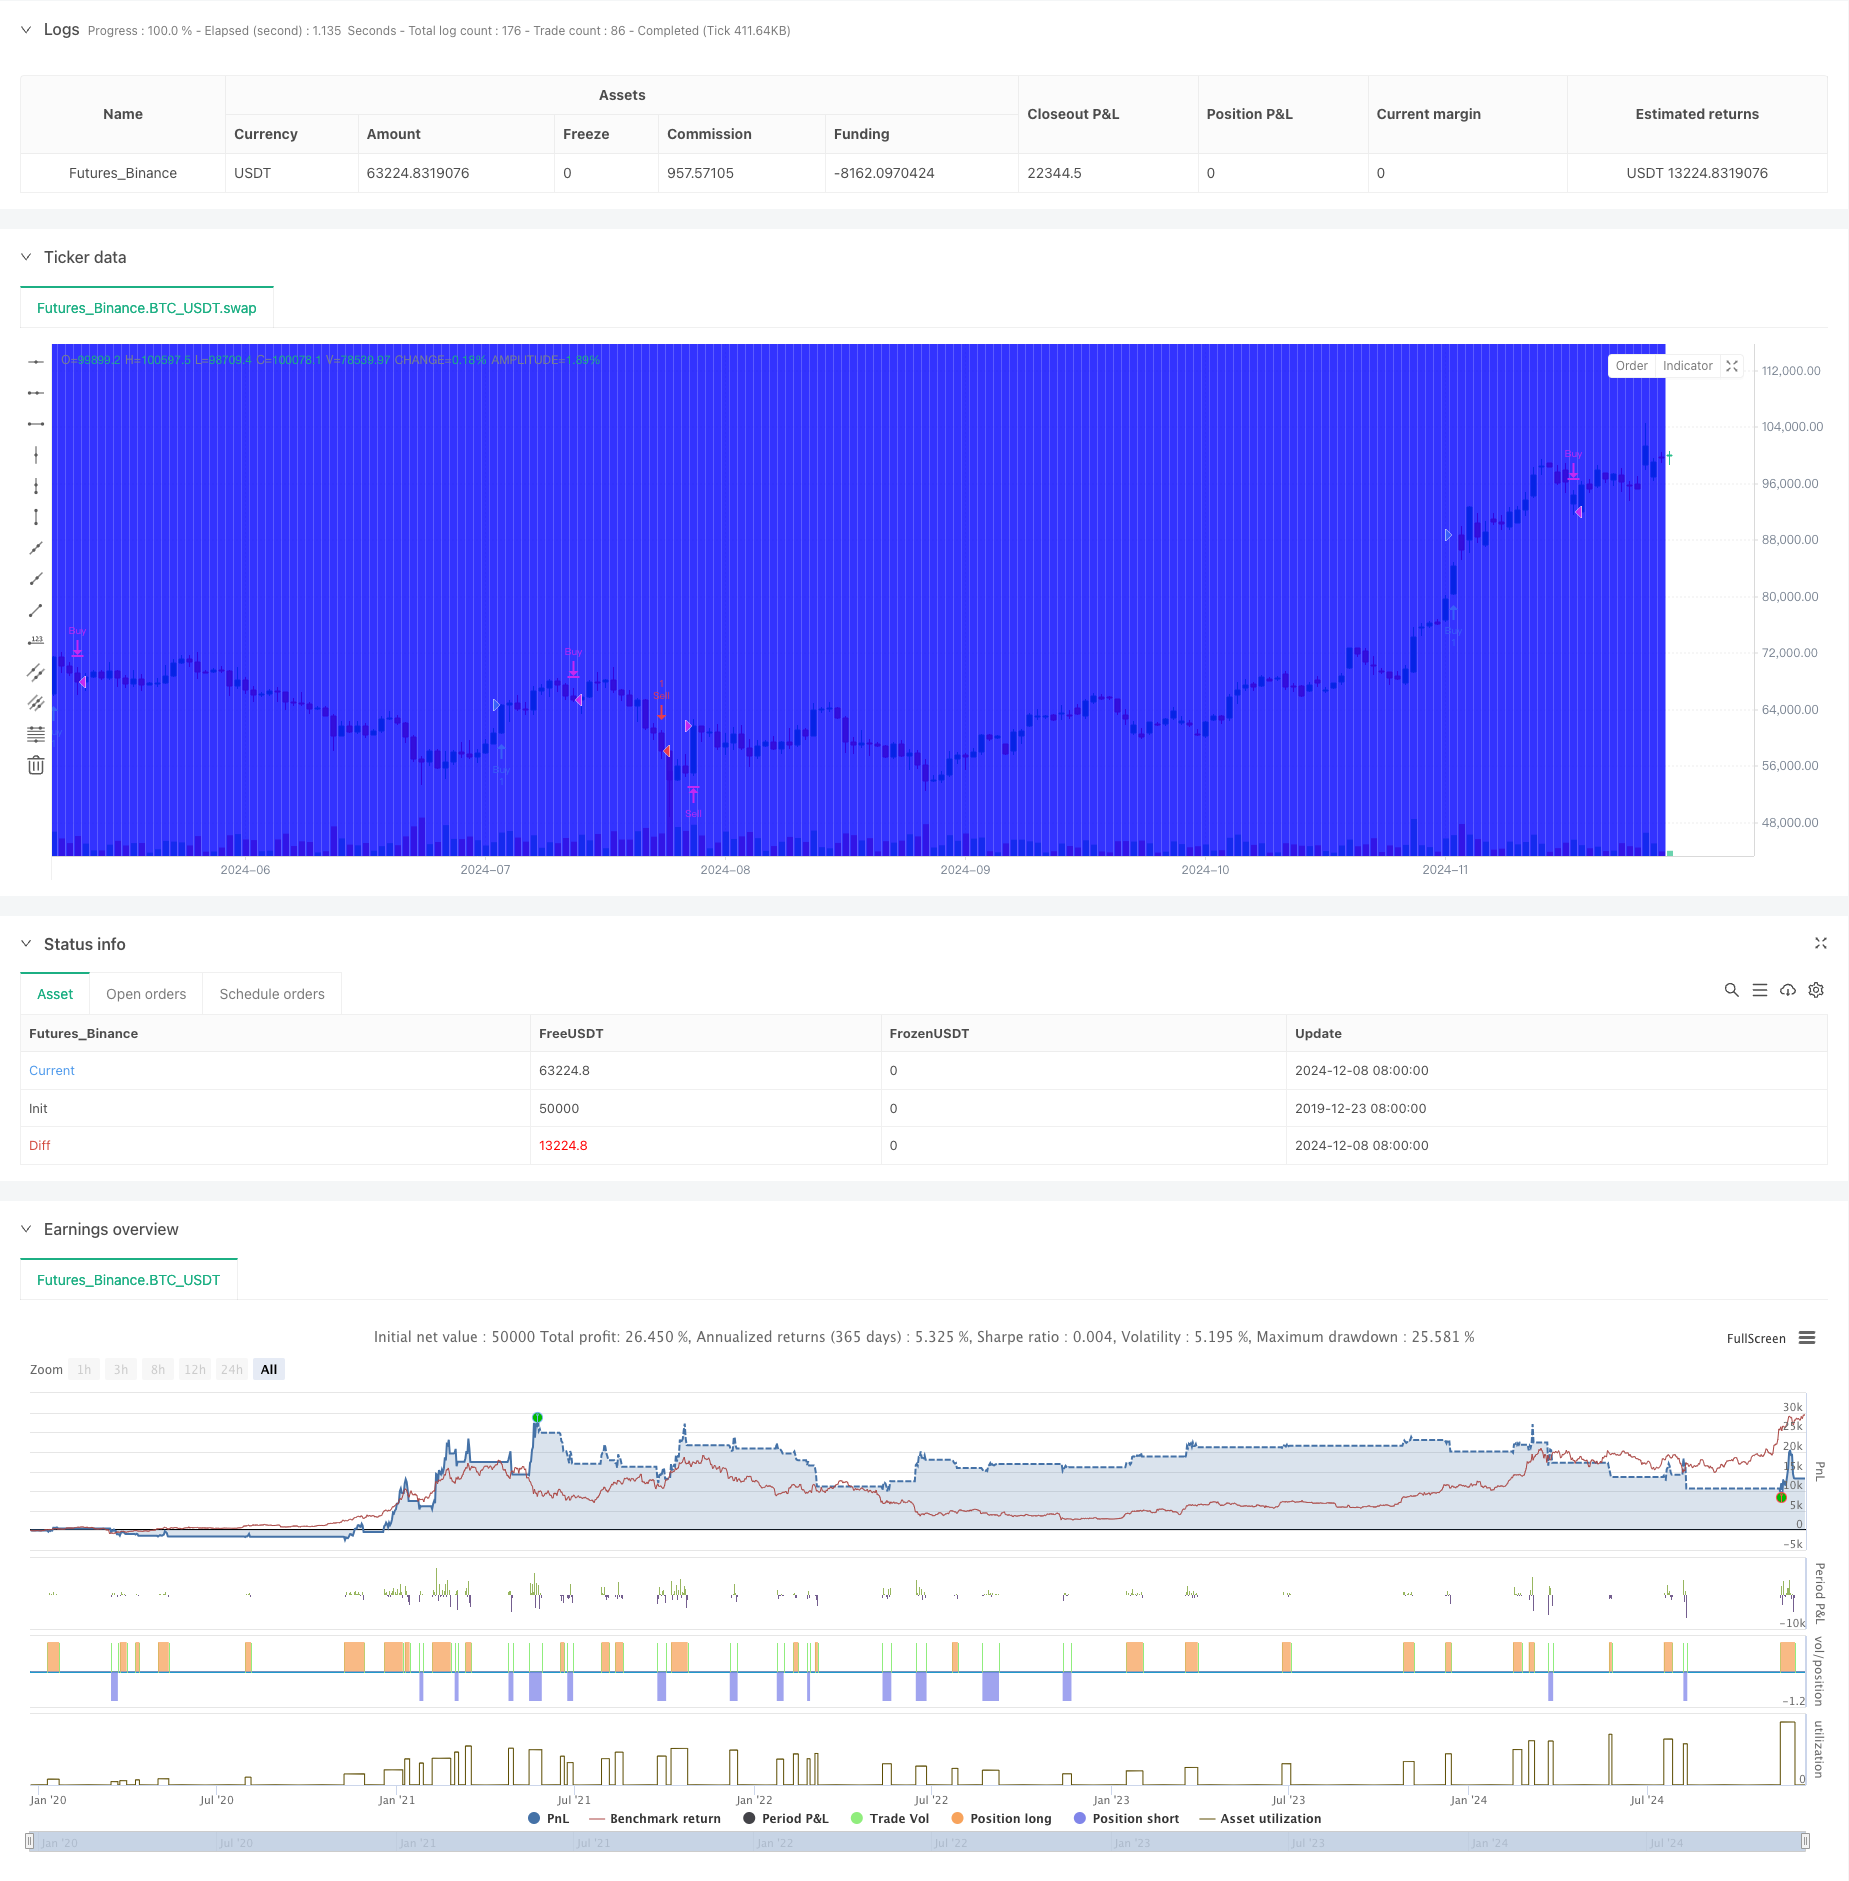
概述
本策略是一个基于波动率指数(VIX)相对于其10日移动平均线行为的量化交易系统。该策略利用VIX与其移动平均线之间的偏离程度作为交易信号,结合了技术分析和统计套利的理念。策略的核心思想是捕捉市场情绪的极端变化,在VIX出现显著偏离时进行交易,等待其回归均值。
策略原理
策略采用了双向交易机制,包含做多和做空两个维度: 做多条件要求VIX的最低价必须高于其10日移动平均线,且收盘价至少高于移动平均线10%。当这两个条件同时满足时,系统在收盘时产生做多信号。 做空条件则要求VIX的最高价必须低于其10日移动平均线,且收盘价至少低于移动平均线10%。当这两个条件同时满足时,系统在收盘时产生做空信号。 平仓规则同样基于VIX与移动平均线的关系:对于多头仓位,当VIX在日内交易低于前一天的10日移动平均线时平仓;对于空头仓位,当VIX在日内交易高于前一天的10日移动平均线时平仓。
策略优势
- 量化指标明确:策略使用具体的数值指标和清晰的交易规则,避免了主观判断。
- 双向交易机制:可以在市场波动的不同阶段获利,增加了盈利机会。
- 风险控制完善:设置了明确的入场和出场条件,有助于控制风险。
- 技术指标可靠:基于VIX这一市场公认的波动率指标,具有良好的市场适应性。
策略风险
- 市场波动风险:VIX本身就是衡量市场波动的指标,策略可能面临突然的市场波动。
- 过度拟合风险:基于特定条件的策略可能存在过度拟合的问题。
- 均值回归假设风险:在持续趋势市场中,均值回归假设可能失效。
- 流动性风险:在市场剧烈波动时可能面临流动性不足和滑点问题。
策略优化方向
- 参数优化:可以对移动平均线周期和偏离阈值进行优化。
- 增加过滤条件:结合其他技术指标,提高交易信号的可靠性。
- 动态阈值:根据市场环境动态调整偏离阈值。
- 风险管理优化:增加止损和资金管理机制。
总结
该策略是一个基于市场波动率的均值回归策略,通过量化方法捕捉市场情绪的极端变化。策略具有明确的交易规则和风险控制机制,但需要注意市场环境变化对策略效果的影响。通过持续优化和完善,该策略有望在不同市场环境下保持稳定的表现。
策略源码
/*backtest
start: 2019-12-23 08:00:00
end: 2024-12-09 08:00:00
period: 1d
basePeriod: 1d
exchanges: [{"eid":"Futures_Binance","currency":"BTC_USDT"}]
*/

// This Pine Script™ code is subject to the terms of the Mozilla Public License 2.0 at https://mozilla.org/MPL/2.0/
// © EdgeTools

//@version=5
strategy("Connors VIX Reversal III invented by Dave Landry", overlay=true)

// Inputs
vixSymbol = input("swap", "VIX Symbol")
lengthMA = input(10, title="Length of Moving Average")
percentThreshold = input(10, title="Percentage Threshold")
buyColor = input(color.rgb(0, 255, 0,90), title="Buy Signal Color")
sellColor = input(color.rgb(255, 0, 0,90), title="Sell Signal Color")
exitColor = input(color.rgb(0, 0, 255,90), title="Exit Signal Color")

// Fetch VIX data
vixClose = request.security(vixSymbol, "D", close)
vixHigh = request.security(vixSymbol, "D", high)
vixLow = request.security(vixSymbol, "D", low)

// Calculate 10-day Moving Average of VIX
vixMA = ta.sma(vixClose, lengthMA)

// Calculate yesterday's 10-day Moving Average
vixMA_yesterday = ta.sma(vixClose[1], lengthMA)

// Buy Rules
buyCondition1 = vixLow > vixMA
buyCondition2 = vixClose > vixMA * (1 + percentThreshold / 100)
buySignal = buyCondition1 and buyCondition2

// Sell Rules
sellCondition1 = vixHigh < vixMA
sellCondition2 = vixClose < vixMA * (1 - percentThreshold / 100)
sellSignal = sellCondition1 and sellCondition2

// Exit Rules
buyExit = vixLow < vixMA_yesterday
sellExit = vixHigh > vixMA_yesterday

// Plot Buy/Sell Signals
bgcolor(buySignal ? buyColor : na)
bgcolor(sellSignal ? sellColor : na)

// Exit Signals
bgcolor(buyExit ? exitColor : na)
bgcolor(sellExit ? exitColor : na)

// Strategy
if (buySignal)
    strategy.entry("Buy", strategy.long)
if (sellSignal)
    strategy.entry("Sell", strategy.short)

if (buyExit)
    strategy.close("Buy")
if (sellExit)
    strategy.close("Sell")
相关推荐