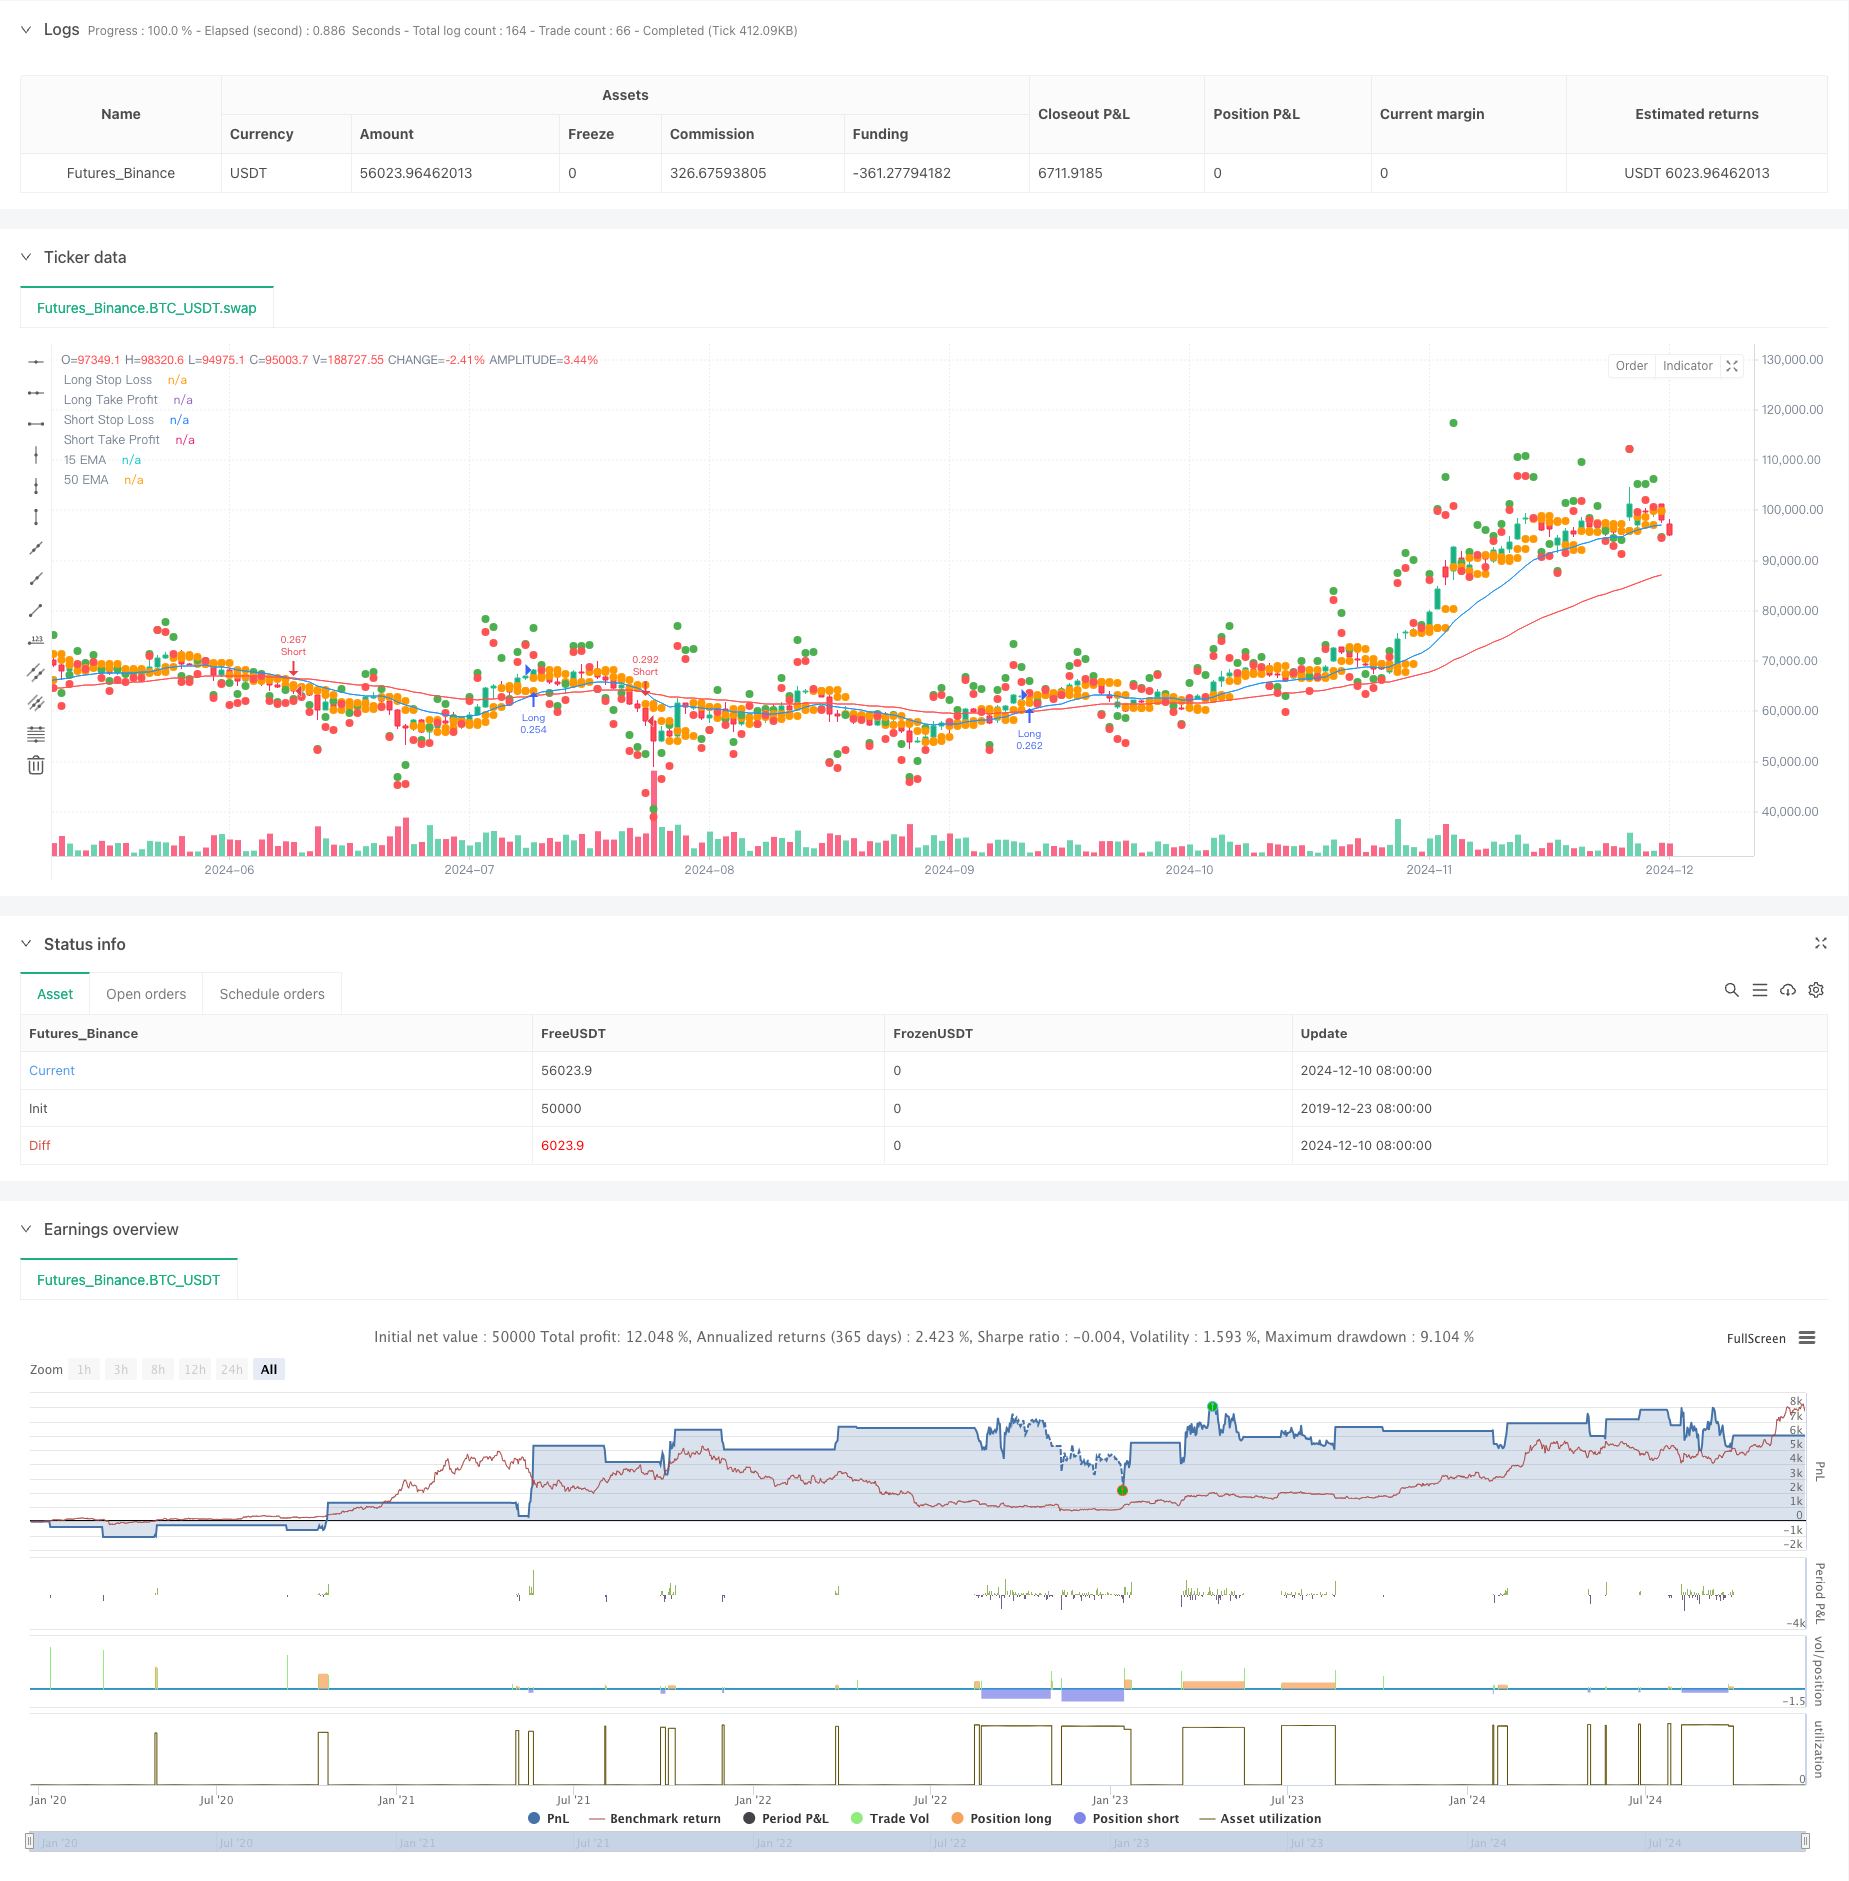
개요
이것은 15주기 및 50주기 지수 이동 평균 ((EMA) 의 교차를 기반으로 한 거래 전략입니다. 전략은 지능적인 정지 및 이득을 통해 위험-이익 비율을 최적화합니다. 이 전략은 트렌드 반전 신호를 포착 할 수있을뿐만 아니라 시장의 변동에 따라 거래 매개 변수를 자동으로 조정하여 전략의 안정성과 수익성을 향상시킬 수 있습니다.
전략 원칙
전략의 핵심 논리는 빠른 EMA ((15주기) 와 느린 EMA ((50주기) 의 교차 신호를 기반으로 한다. 빠른 선에서 느린 선을 통과할 때, 시스템은 다중 신호를 발생시킨다; 빠른 선 아래 느린 선을 통과할 때, 시스템은 공백 신호를 발생시킨다. 위험 관리를 최적화하기 위해, 전략은 동적 중지 손실 설정 방법을 채택한다. 즉, 이전 2K 선의 최저 개장 가격은 다중 스톱으로 손실을, 최고 개장 가격은 공백 스톱으로 손실을 취한다. 이익 목표는 위험의 2배로 설정되어, 좋은 위험 수익을 보장한다. 전략은 기본으로 30%의 계좌를 사용한다. 이러한 재무 관리 방법은 위험을 제어하는 데 도움이 된다.
전략적 이점
- 동적 위험 관리: 실시간으로 중지 위치를 계산하여, 전략은 시장의 변동에 따라 자동으로 위험 매개 변수를 조정할 수 있습니다.
- 최적화된 리스크/수익 비율: 수익 목표값을 2배의 스톱로스 거리로 설정하여 거래마다 합리적인 수익 공간을 보장합니다.
- 건전한 자금 관리: 계좌의 30%의 자금을 사용하여 거래하여 수익 잠재력을 보장하고 과도한 위험을 피합니다.
- 양방향 거래 기회: 전략은 양방향의 거래 기회를 포착하여 거래 빈도와 수익 기회를 향상시킵니다.
- 시각적 도움말: 거래자는 차트에 상표된 스톱로스 및 수익 위치를 표시하여 거래 상태를 직관적으로 모니터링 할 수 있습니다.
전략적 위험
- 흔들림 시장의 위험: 가로판 흔들림 시장에서, 평행선 교차 신호는 거짓 신호를 생성할 수 있으며, 이로 인해 연속적인 스톱 손실이 발생할 수 있다.
- 슬라이드 포인트 위험: 시장이 급격히 변동할 때, 실제 거래 가격은 이상적인 가격과 큰 오차가 있을 수 있다.
- 자금 관리 위험: 30%의 고정된 자금을 사용하는 것은 특정 시장 조건에서 너무 급진적일 수 있다.
- 스톱 로드 설정 위험: 상위 2 K 라인 설정에 기반한 스톱 로드는 극단적인 시장 조건에서 충분히 유연하지 않을 수 있다.
전략 최적화 방향
- 트렌드 필터를 도입합니다. 약점 신호를 필터링하기 위해 ADX 또는 트렌드 강도 지표와 같은 추가적인 트렌드 확인 지표를 추가할 수 있습니다.
- 다이내믹 펀드 매니지먼트: 시장의 변동에 따라 포지션 크기를 자동으로 조정할 수 있어 전략이 더 적응할 수 있다.
- 최적화 스톱: 스톱을 설정하기 위해 ATR 지표를 도입하여 스톱을 시장의 변동 특성에 더 적합하게 만들 수 있습니다.
- 시간 필터를 추가: 거래 시간 필터를 추가하여 급격한 변동이나 유동성이 부족한 시간을 피하십시오.
- 거래량 확인: 거래량을 거래 신호의 확인 지표로 사용하여 신호의 신뢰성을 높인다.
요약하다
이 전략은 구조적으로 완전하고 논리적으로 명확한 일직선 교차 전략이다. 고전적인 기술 분석 방법과 현대적인 위험 관리 기술을 결합함으로써 전략은 더 나은 위험 수익 특성을 달성한다. 약간의 최적화 공간이 있지만, 전략의 기본 프레임워크는 실용성과 확장성이 좋다. 제안된 최적화 방향에 의해 전략의 성능이 더 향상될 것으로 보인다.
전략 소스 코드
/*backtest
start: 2019-12-23 08:00:00
end: 2024-12-11 08:00:00
period: 1d
basePeriod: 1d
exchanges: [{"eid":"Futures_Binance","currency":"BTC_USDT"}]
*/

//@version=5
strategy("EMA Cross - Any Direction", overlay=true, default_qty_type=strategy.percent_of_equity, default_qty_value=30)

// Input for EMAs
ema_short_length = input(15, title="Short EMA Length")
ema_long_length = input(50, title="Long EMA Length")

// Calculate EMAs
ema_short = ta.ema(close, ema_short_length)
ema_long = ta.ema(close, ema_long_length)

// Plot EMAs
plot(ema_short, color=color.blue, title="15 EMA")
plot(ema_long, color=color.red, title="50 EMA")

// Entry Conditions (Any EMA Cross)
cross_condition = ta.crossover(ema_short, ema_long) or ta.crossunder(ema_short, ema_long)

// Determine Trade Direction
is_long = ta.crossover(ema_short, ema_long)
is_short = ta.crossunder(ema_short, ema_long)

// Stop Loss and Take Profit
long_stop_loss = ta.lowest(open[1], 2)  // Lowest open of the last 2 candles
short_stop_loss = ta.highest(open[1], 2) // Highest open of the last 2 candles
long_take_profit = close + 2 * (close - long_stop_loss)
short_take_profit = close - 2 * (short_stop_loss - close)

// Execute Trades
if (cross_condition)
    if (is_long)
        strategy.entry("Long", strategy.long)
        strategy.exit("Exit Long", "Long", stop=long_stop_loss, limit=long_take_profit)
    else if (is_short)
        strategy.entry("Short", strategy.short)
        strategy.exit("Exit Short", "Short", stop=short_stop_loss, limit=short_take_profit)

// Plot Stop Loss and Take Profit Levels
plot(long_stop_loss, color=color.orange, title="Long Stop Loss", style=plot.style_circles, linewidth=2)
plot(long_take_profit, color=color.green, title="Long Take Profit", style=plot.style_circles, linewidth=2)
plot(short_stop_loss, color=color.orange, title="Short Stop Loss", style=plot.style_circles, linewidth=2)
plot(short_take_profit, color=color.red, title="Short Take Profit", style=plot.style_circles, linewidth=2)