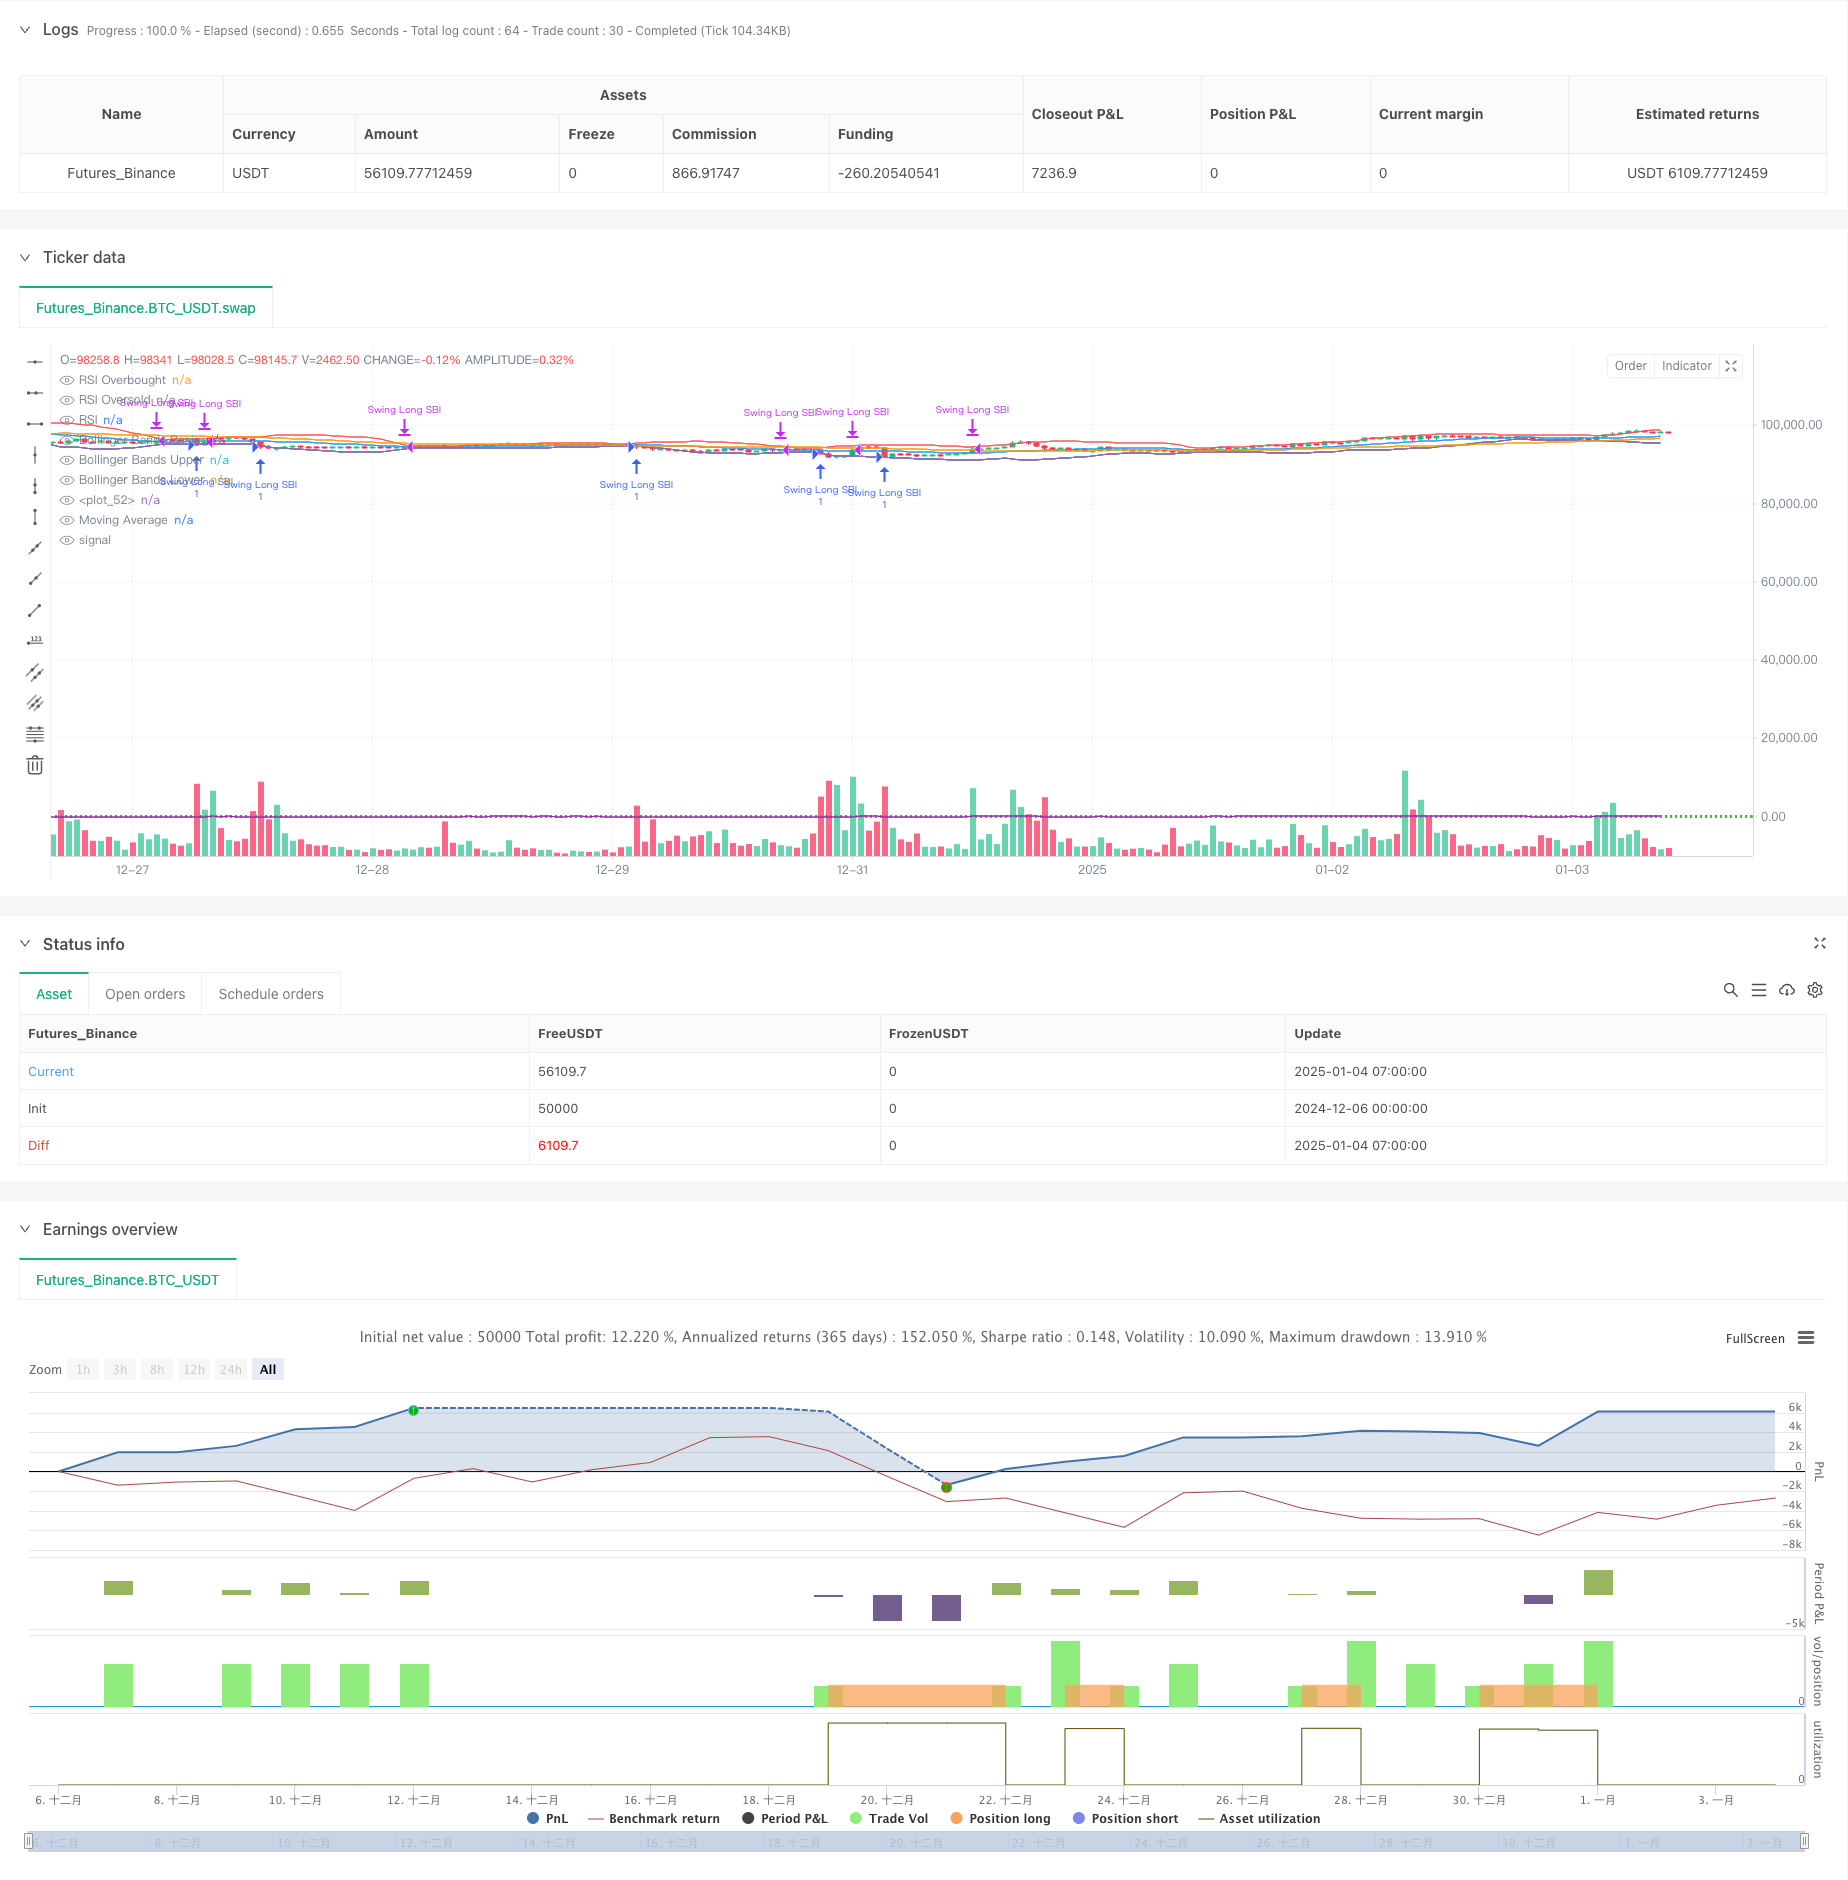
RSI와 볼링거 밴드 시너지 스윙 거래 전략
저자:차오장, 날짜: 2025-01-06 13:51:50태그:RSIBBMASMA

전반적인 설명
이 전략은 RSI 지표와 볼링거 밴드를 결합한 스윙 거래 시스템이다. 거래 결정을 위해 볼링거 밴드 내의 가격 위치를 고려하면서 시장 과잉 구매 및 과잉 판매 조건을 식별합니다. 전략은 상대적으로 느린 RSI 문턱을 (60에서 과잉 구매, 40에서 과잉 판매) 사용하며 2%의 수익 취득 메커니즘과 함께 입출 시기를 위한 볼링거 밴드 경계를 통합합니다.
전략 원칙
핵심 논리는 몇 가지 핵심 요소에 기반합니다.
- RSI 지표: 14주기 계산주기를 사용하여 시장 과잉 구매/ 과잉 판매 상황을 측정합니다.
- 볼링거 밴드: 중간 밴드로서 20주기 이동 평균을 사용하며, 표준편차 곱수는 2.0입니다.
- 50주기 이동 평균: 트렌드 참조로 사용됩니다.
구매 조건:
- 낮은 볼링거 밴드 근처 또는 그 이하의 가격 (1% 버퍼존 허용)
- 40 이하의 RSI (가장 팔린 지역)
판매 조건:
- 상단 볼린저 밴드 근처 또는 그 이상의 가격 (1% 버퍼존 허용)
- RSI 60 이상 (가량 매수 지역)
- 또는 2%의 수익 목표가 달성되었습니다.
전략적 장점
- 다중 확인 메커니즘: RSI와 볼링거 밴드 시너지를 통해 잘못된 신호를 줄입니다.
- 강력한 리스크 관리: 명확한 수익 목표가 포지션의 침해를 방지합니다.
- 유연 한 매개 변수: 주요 매개 변수는 다른 시장 조건에 최적화 될 수 있습니다.
- 비용 고려: 수수료 (0.1%) 및 미끄러짐 (3 점) 계산을 포함합니다.
- 좋은 시각화: 직관적인 신호 표시를 위해 여러 가지 색상의 선과 채워진 영역을 사용합니다.
전략 위험
-
부진 시장 위험: 부진 시장에서 빈번한 거래를 유발할 수 있습니다. 솔루션: 이동 평균 필터 또는 트렌드 확인 메커니즘을 추가합니다.
-
거짓 파업 위험: 볼린거 밴드의 짧은 가격 파업은 잘못된 신호를 유발할 수 있습니다. 해결 방법: 확인 기간을 추가하거나 분산 요구 사항을 증가시킵니다.
-
시장 환경 의존성: 성능은 다른 시장 주기에 따라 달라질 수 있습니다. 솔루션: 시장 특성에 따라 매개 변수를 동적으로 조정합니다.
최적화 방향
- 동적 매개 변수 최적화
- 변동성에 기초한 볼링거 밴드 표준편차 곱셈을 자동으로 조정합니다.
- 시장 환경에 따라 RSI 임계값을 동적으로 조정합니다.
- 추가 필터:
- 볼륨 확인 메커니즘 추가
- 트렌드 강도 지표를 도입
- 스톱 손실 최적화
- 후속 중지 기능을 추가
- ATR 기반 동적 스톱 손실을 구현합니다.
요약
이 전략은 RSI와 볼링거 밴드의 시너지를 통해 비교적 견고한 스윙 거래 시스템을 구축합니다. 주요 특징은 여러 확인 메커니즘을 통해 위험을 제어하는 동시에 거래 기회를 유지하는 것입니다. 잠재적 인 위험이 있지만 매개 변수 최적화 및 추가 필터링 조건으로 전략의 안정성과 신뢰성을 더욱 향상시킬 수 있습니다. 변동성 시장에 적합하지만 특정 시장 특성에 따라 매개 변수 조정이 필요합니다.
/*backtest
start: 2024-12-06 00:00:00
end: 2025-01-04 08:00:00
period: 1h
basePeriod: 1h
exchanges: [{"eid":"Futures_Binance","currency":"BTC_USDT"}]
*/

//@version=5
strategy("Demo GPT - Adjusted Swing Trading for SBI", overlay=true, commission_type=strategy.commission.percent, commission_value=0.1, slippage=3)

// Input Parameters
rsiLength = input.int(14, minval=1, title="RSI Length")
rsiOverbought = input.int(60, minval=50, maxval=100, title="RSI Overbought Level") // Relaxed level
rsiOversold = input.int(40, minval=0, maxval=50, title="RSI Oversold Level")       // Relaxed level
bbLength = input.int(20, minval=1, title="Bollinger Bands Length")
bbMult = input.float(2.0, minval=0.1, maxval=5, title="Bollinger Bands StdDev Multiplier")
maLength = input.int(50, minval=1, title="Moving Average Length")

// RSI Calculation
rsi = ta.rsi(close, rsiLength)

// Bollinger Bands Calculation
bbBasis = ta.sma(close, bbLength)
bbDev = bbMult * ta.stdev(close, bbLength)
bbUpper = bbBasis + bbDev
bbLower = bbBasis - bbDev

// Moving Average
ma = ta.sma(close, maLength)

// Buy Signal: Price near or below lower Bollinger Band AND RSI below oversold level
buySignal = (close <= bbLower * 1.01) and (rsi < rsiOversold)

// Sell Signal: Price near or above upper Bollinger Band OR RSI above overbought level
sellSignal = (close >= bbUpper * 0.99) or (rsi > rsiOverbought)

// Date Range Inputs
startDate = input(timestamp("2018-01-01 00:00"), title="Start Date")
endDate = input(timestamp("2069-12-31 23:59"), title="End Date")
inDateRange = true

// Strategy Logic
if buySignal and inDateRange
    strategy.entry("Swing Long SBI", strategy.long)

if strategy.position_size > 0 and (sellSignal or close >= strategy.position_avg_price * 1.02)
    strategy.close("Swing Long SBI")

// Plotting
plot(bbBasis, title="Bollinger Bands Basis", color=color.blue)
plot(bbUpper, title="Bollinger Bands Upper", color=color.red)
plot(bbLower, title="Bollinger Bands Lower", color=color.green)
plot(ma, title="Moving Average", color=color.orange)
hline(rsiOverbought, "RSI Overbought", color=color.red, linestyle=hline.style_dotted)
hline(rsiOversold, "RSI Oversold", color=color.green, linestyle=hline.style_dotted)
plot(rsi, title="RSI", color=color.purple)

// Fill Bollinger Bands for Visualization
fill(plot(bbUpper), plot(bbLower), title="Bollinger Bands Background", color=color.rgb(33, 150, 243, 95))
관련
- 양적 거래 전략에 따른 다기술 지표 융합 추세
- 보린저 밴드 및 RSI 통합을 통해 향상된 평균 역전 전략
- 지능적인 시간 기반의 장기 단기 회전 균형 거래 전략
- 볼링거 밴드 + RSI + 멀티 MA 트렌드 전략
- 멀티테크니컬 인디케이터 시너지 거래 시스템
- 상위 윗부분의 윗부분의 윗부분의 윗부분의 윗부분의
- 고급 양적 거래 전략 RSI 분산 및 이동 평균을 결합
- 이동 평균 양적 전략 시스템으로 적응적인 볼링거 브레이크
- MA, SMA, MA 슬로프, 트래일링 스톱 손실, 재입구
- 볼링거 밴드, 이동 평균 및 RSI를 기반으로 한 단기 거래 전략
더 많은
- 볼링거 밴드 브레이크업 모멘텀 거래 전략
- 다중 지표 확률 기준 모멘텀 트렌드 거래 전략
- 여러 기간 EMA 트렌드 RSI 과잉 구매/ 과잉 판매 동적 최적화 전략과 함께
- 다기기 동적 신호 통합 ICT 스마트 구조 돌파구 전략
- 상대적 강도와 RSI에 기초한 전략을 따르는 동적 경향
- 다중 지표 동적 모멘텀 크로스 전략
- 융합 운동량 및 평균 역전 높은 주파수 양적 전략
- 동적 ATR 조정 EMA 크로스오버 전략
- 고급 압력 역전 및 촛불 겹치는 전략
- 이중 기하급수적인 이동 평균 모멘텀 크로스오버 거래 전략
- 모멘텀 트렌드 이치모쿠 클라우드 거래 전략
- 볼링거 브레이크아웃 거래 전략과 함께 멀티 이동 평균 슈퍼 트렌드
- 다중 지표 동적 이동 평균 크로스오버 양적 전략
- 전략에 따라 RSI 동력과 부피 추세와 함께 두 기간 이동 평균
- RSI 트렌드 돌파구 및 추진력 강화 거래 전략
- 양적 거래 전략에 따른 이중 EMA 크로스오버 동적 경향
- 적응 트렌드 흐름 다중 필터 거래 전략
- 동적 이중 기술 지표 초판-초입 확인 거래 전략
- 다중 지표 동적 트레일링 스톱 거래 전략
- 듀얼 EMA 스토카스틱 오시레이터 시스템: 트렌드 추적과 모멘텀을 결합한 양적 거래 모델