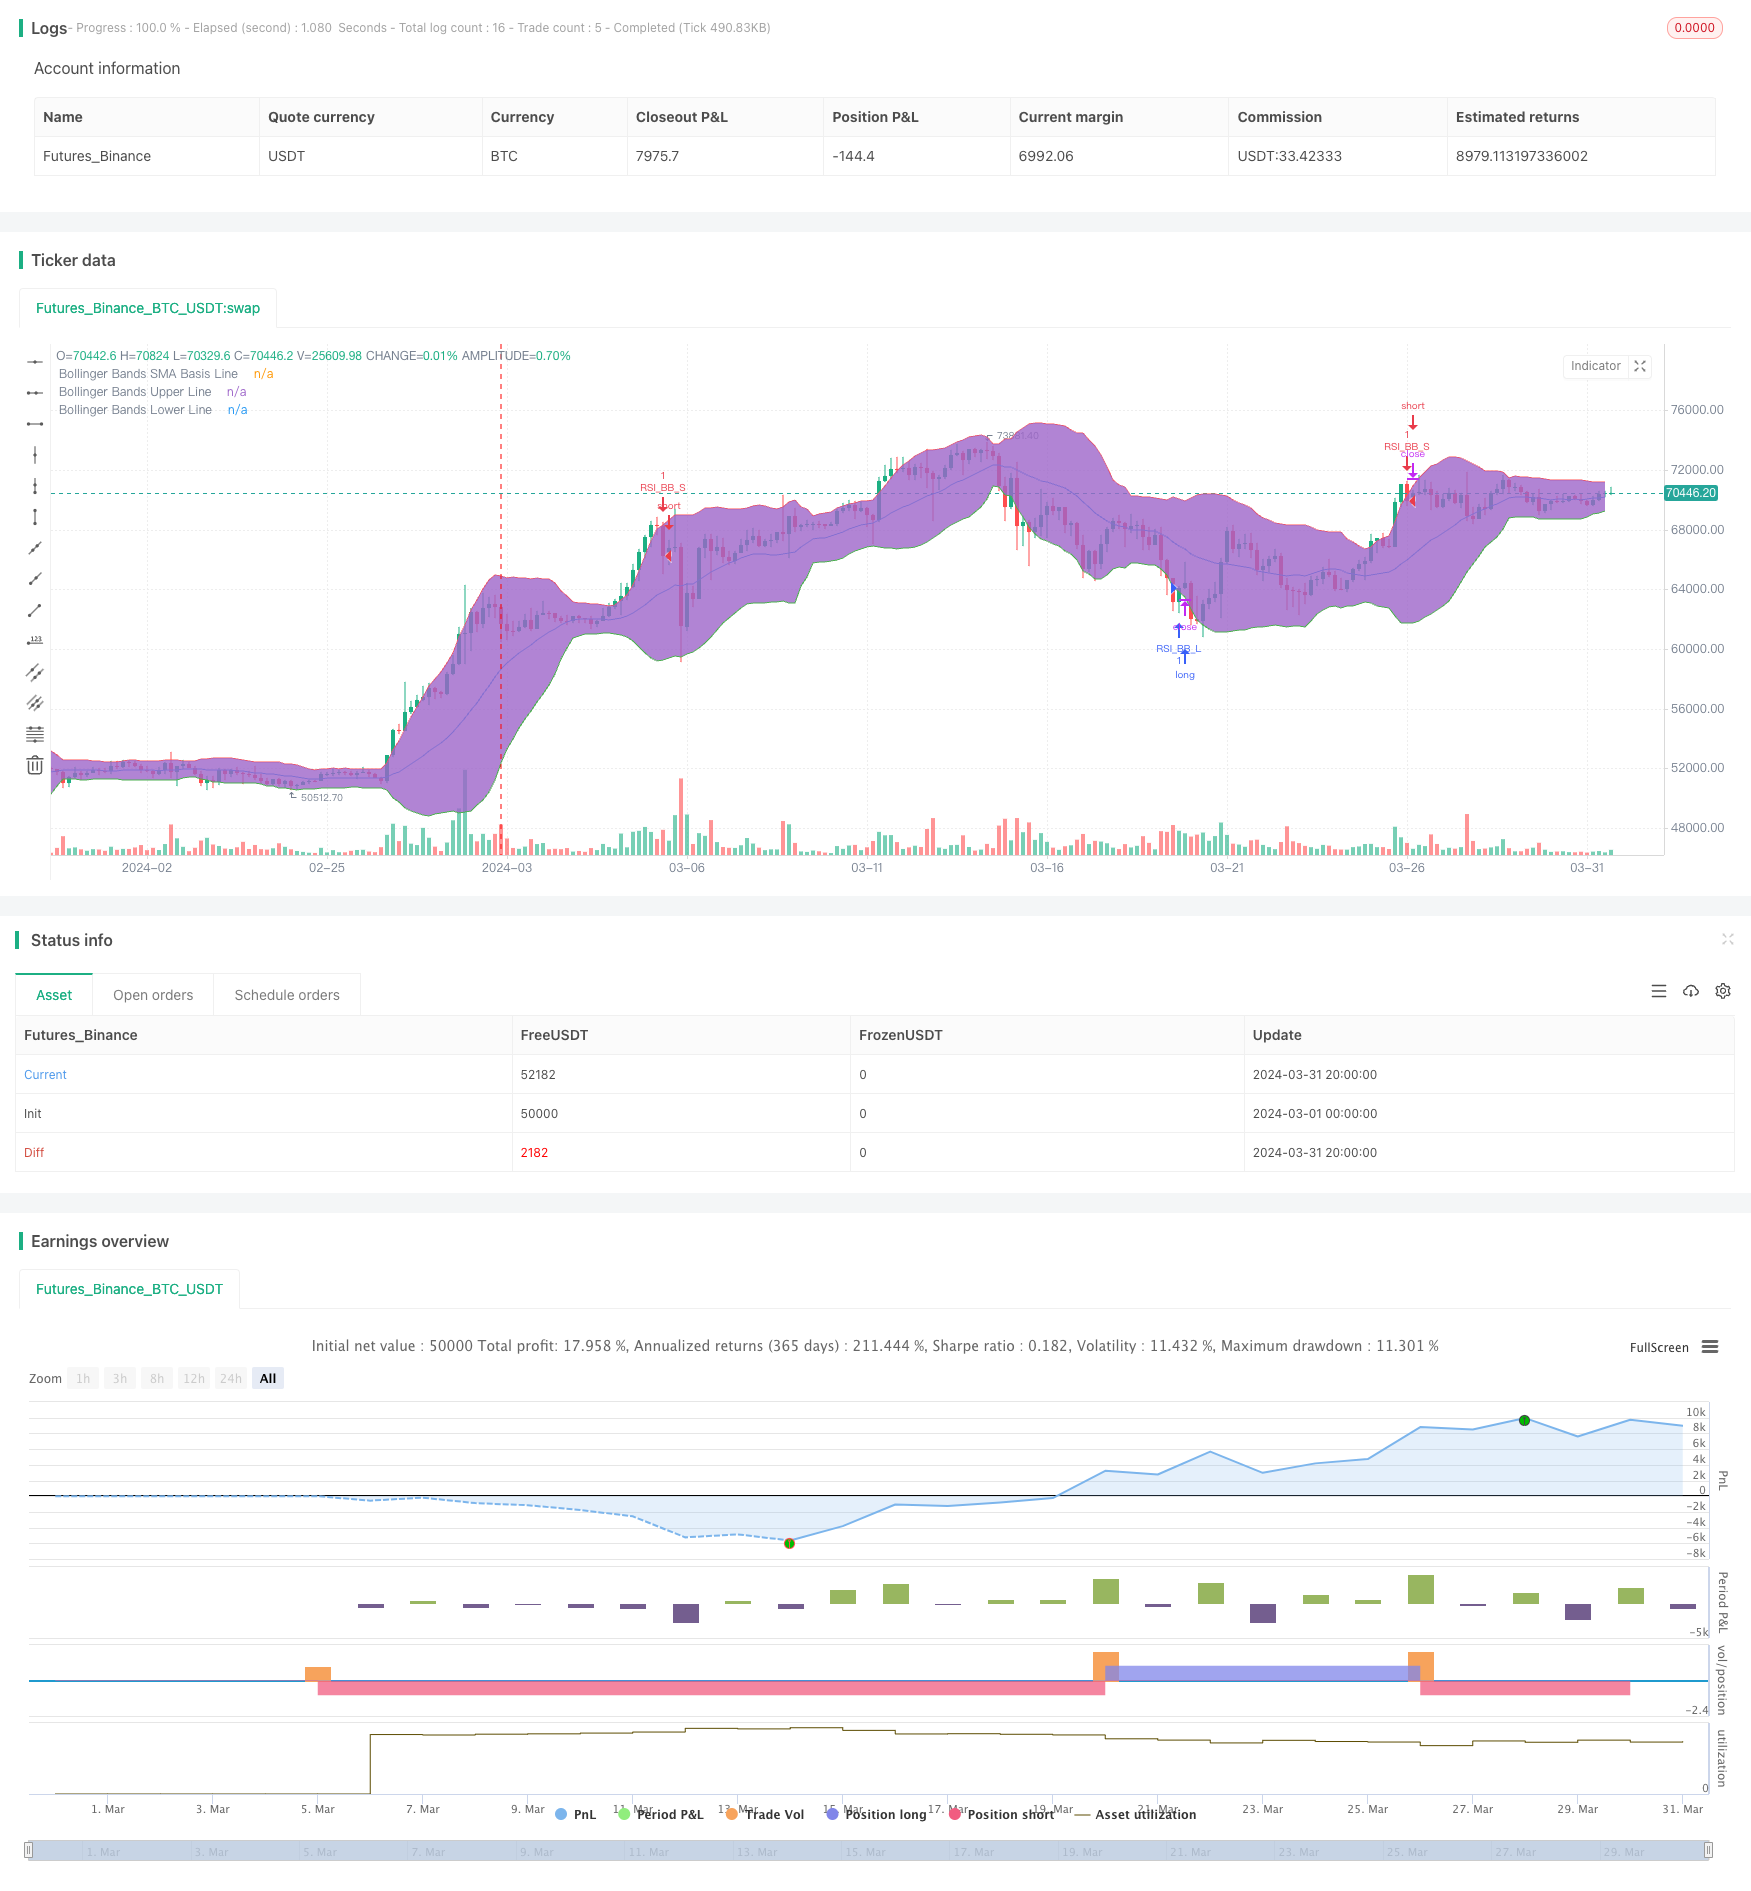
RSI dan Bollinger Bands Strategi Ganda
Penulis:ChaoZhang, Tarikh: 2024-04-03 17:54:52Tag:RSIBBSMAstdev

Ringkasan
Strategi ini menggabungkan Indeks Kekuatan Relatif (RSI) dan penunjuk teknikal Bollinger Bands. Ia menghasilkan isyarat beli apabila harga jatuh di bawah Bollinger Band yang lebih rendah dan isyarat jual apabila harga meningkat di atas Bollinger Band yang lebih tinggi. Strategi ini hanya mencetuskan isyarat perdagangan apabila kedua-dua penunjuk RSI dan Bollinger Bands secara serentak berada dalam keadaan oversold atau overbought.
Logika Strategi
- Mengira nilai RSI berdasarkan parameter RSI yang ditetapkan.
- Gunakan formula Bollinger Bands untuk mengira Bollinger Bands tengah, atas, dan bawah.
- Tentukan sama ada harga penutupan semasa menembusi Band Bollinger atas atau bawah.
- Tentukan sama ada nilai RSI semasa di atas ambang overbought atau di bawah ambang oversold.
- Menghasilkan isyarat membeli atau menjual yang sepadan apabila kedua-dua Bollinger Bands dan penunjuk RSI memenuhi syarat masing-masing.
Kelebihan Strategi
- Menggabungkan penunjuk trend dan momentum untuk penilaian keadaan pasaran yang lebih komprehensif.
- Menggunakan dua penunjuk sebagai penapis secara berkesan mengurangkan kebarangkalian isyarat palsu.
- Logik kod yang jelas dan tetapan parameter yang fleksibel, sesuai untuk persekitaran pasaran dan gaya perdagangan yang berbeza.
Risiko Strategi
- Dalam pasaran yang berbelit-belit, strategi ini boleh menghasilkan lebih banyak perdagangan yang rugi.
- Tetapan parameter yang tidak betul boleh menyebabkan prestasi strategi yang buruk dan memerlukan pengoptimuman berdasarkan keadaan sebenar.
- Strategi ini tidak merangkumi stop-loss, berpotensi mendedahkan ia kepada risiko pengeluaran yang signifikan.
Arahan Pengoptimuman Strategi
- Mengoptimumkan parameter RSI dan Bollinger Bands berdasarkan ciri pasaran dan pilihan peribadi.
- Memperkenalkan penunjuk teknikal tambahan seperti MACD, purata bergerak, dll., Untuk meningkatkan kebolehpercayaan isyarat.
- Menetapkan paras stop-loss dan mengambil keuntungan yang munasabah untuk mengawal risiko perdagangan tunggal.
- Untuk pasaran yang bergelombang, pertimbangkan untuk menambah lebih banyak syarat atau mengurangkan saiz kedudukan untuk mengurangkan kos yang berkaitan dengan perdagangan yang kerap.
Ringkasan
RSI dan Bollinger Bands Double Strategy menggabungkan penunjuk trend dan momentum untuk memberikan penilaian yang agak komprehensif terhadap keadaan pasaran dan menghasilkan isyarat perdagangan yang sesuai. Walau bagaimanapun, strategi ini mungkin kurang berprestasi di pasaran yang bergolak dan tidak mempunyai langkah kawalan risiko, jadi berhati-hati diperlukan apabila menerapkannya untuk perdagangan langsung. Dengan mengoptimumkan parameter, memperkenalkan penunjuk lain, dan menetapkan tahap stop-loss dan mengambil keuntungan yang munasabah, kestabilan dan keuntungan strategi ini dapat ditingkatkan lagi.
/*backtest
start: 2024-03-01 00:00:00
end: 2024-03-31 23:59:59
period: 4h
basePeriod: 15m
exchanges: [{"eid":"Futures_Binance","currency":"BTC_USDT"}]
*/

//@version=4
strategy("Bollinger + RSI, Double Strategy (by ChartArt) v1.1", shorttitle="CA_-_RSI_Bol_Strat_1.1", overlay=true)

// ChartArt's RSI + Bollinger Bands, Double Strategy - Update
//
// Version 1.1
// Idea by ChartArt on January 18, 2015.
//
// This strategy uses the RSI indicator
// together with the Bollinger Bands
// to sell when the price is above the
// upper Bollinger Band (and to buy when
// this value is below the lower band).
//
// This simple strategy only triggers when
// both the RSI and the Bollinger Bands
// indicators are at the same time in
// a overbought or oversold condition.
//
// In this version 1.1 the strategy was
// both simplified for the user and
// made more successful in backtesting.
//
// List of my work:
// https://www.tradingview.com/u/ChartArt/
//
//  __             __  ___       __  ___
// /  ` |__|  /\  |__)  |   /\  |__)  |
// \__, |  | /~~\ |  \  |  /~~\ |  \  |
//
//

///////////// RSI
RSIlength = input(14,title="RSI Period Length")
RSIoverSold = 30
RSIoverBought = 70
price = close
vrsi = rsi(price, RSIlength)


///////////// Bollinger Bands
BBlength = input(20, minval=1,title="Bollinger Period Length")
BBmult = input(2.0, minval=0.001, maxval=50,title="Bollinger Bands Standard Deviation")
BBbasis = sma(price, BBlength)
BBdev = BBmult * stdev(price, BBlength)
BBupper = BBbasis + BBdev
BBlower = BBbasis - BBdev
source = close
buyEntry = crossover(source, BBlower)
sellEntry = crossunder(source, BBupper)
plot(BBbasis, color=color.blue,title="Bollinger Bands SMA Basis Line")
p1 = plot(BBupper, color=color.red,title="Bollinger Bands Upper Line")
p2 = plot(BBlower, color=color.green,title="Bollinger Bands Lower Line")
fill(p1, p2)

// Entry conditions
crossover_rsi = crossover(vrsi, RSIoverSold) and crossover(source, BBlower)
crossunder_rsi = crossunder(vrsi, RSIoverBought) and crossunder(source, BBupper)

///////////// RSI + Bollinger Bands Strategy
if (not na(vrsi))
    if (crossover_rsi)
        strategy.entry("RSI_BB_L", strategy.long, comment="RSI_BB_L")
    else
        strategy.cancel(id="RSI_BB_L")

    if (crossunder_rsi)
        strategy.entry("RSI_BB_S", strategy.short, comment="RSI_BB_S")
    else
        strategy.cancel(id="RSI_BB_S")
- Sistem Perdagangan Pemberitahuan Volatiliti Dinamik Multi-Indikator
- Bollinger Bands RSI Strategi Perdagangan
- Strategi Penembusan Bollinger Bands
- Strategi Penembusan Bollinger Bands
- Bollinger Band Crossover dengan Slippage dan Strategi Kesan Harga Gabungan
- Bollinger Bands Entry yang tepat dan Strategi Kawalan Risiko
- Adaptive Bollinger Bands Strategi Pengurusan Posisi Dinamik
- Bollinger Bands dan RSI Strategi Dagangan Gabungan
- Bollinger Bands dan RSI Strategy Dagangan Dinamis Gabungan
- Bollinger Bands dan RSI Crossover Trading Strategy
- Moving Average Crossover + Strategi Momentum Garis Perlahan MACD
- Strategi DCA dinamik berasaskan jumlah
- Strategi Pengesan Lembah MACD
- N Bars Breakout Strategi
- Strategi Perdagangan Frekuensi Tinggi Cryptocurrency Berrisiko Rendah dan MACD
- Bollinger Bands Strategi Isyarat Ekstrem RSI
- RSI Strategi Dagangan Dua Sisi
- KRK ADA 1H Strategi Slow Stochastic dengan lebih banyak entri dan AI
- Strategi Dagangan Stop Loss dan Take Profit Berkualiti Piramida Berasaskan Volume MA
- MACD TEMA Crossover Strategi
- VWMA-ADX Momentum dan Strategi Lama Bitcoin Berasaskan Trend
- Trend Multi-Indikator Berikutan Strategi Pengurusan Risiko Dinamik
- Ruda Momentum Trend Strategi Dagangan
- Strategi silang purata bergerak berganda
- Strategi Bollinger Bands yang Dipinda
- Strategi Penembusan Perubahan Harga Sempadan Dinamik
- Strategi Penembusan Rata-rata Bergerak Ganda
- Perdagangan momentum dengan strategi crossover purata bergerak berganda
- Strategi Dagangan BTC Berbilang Penunjuk
- Strategi Beli/Jual TD Penembusan dan Retracement Berturut-turut