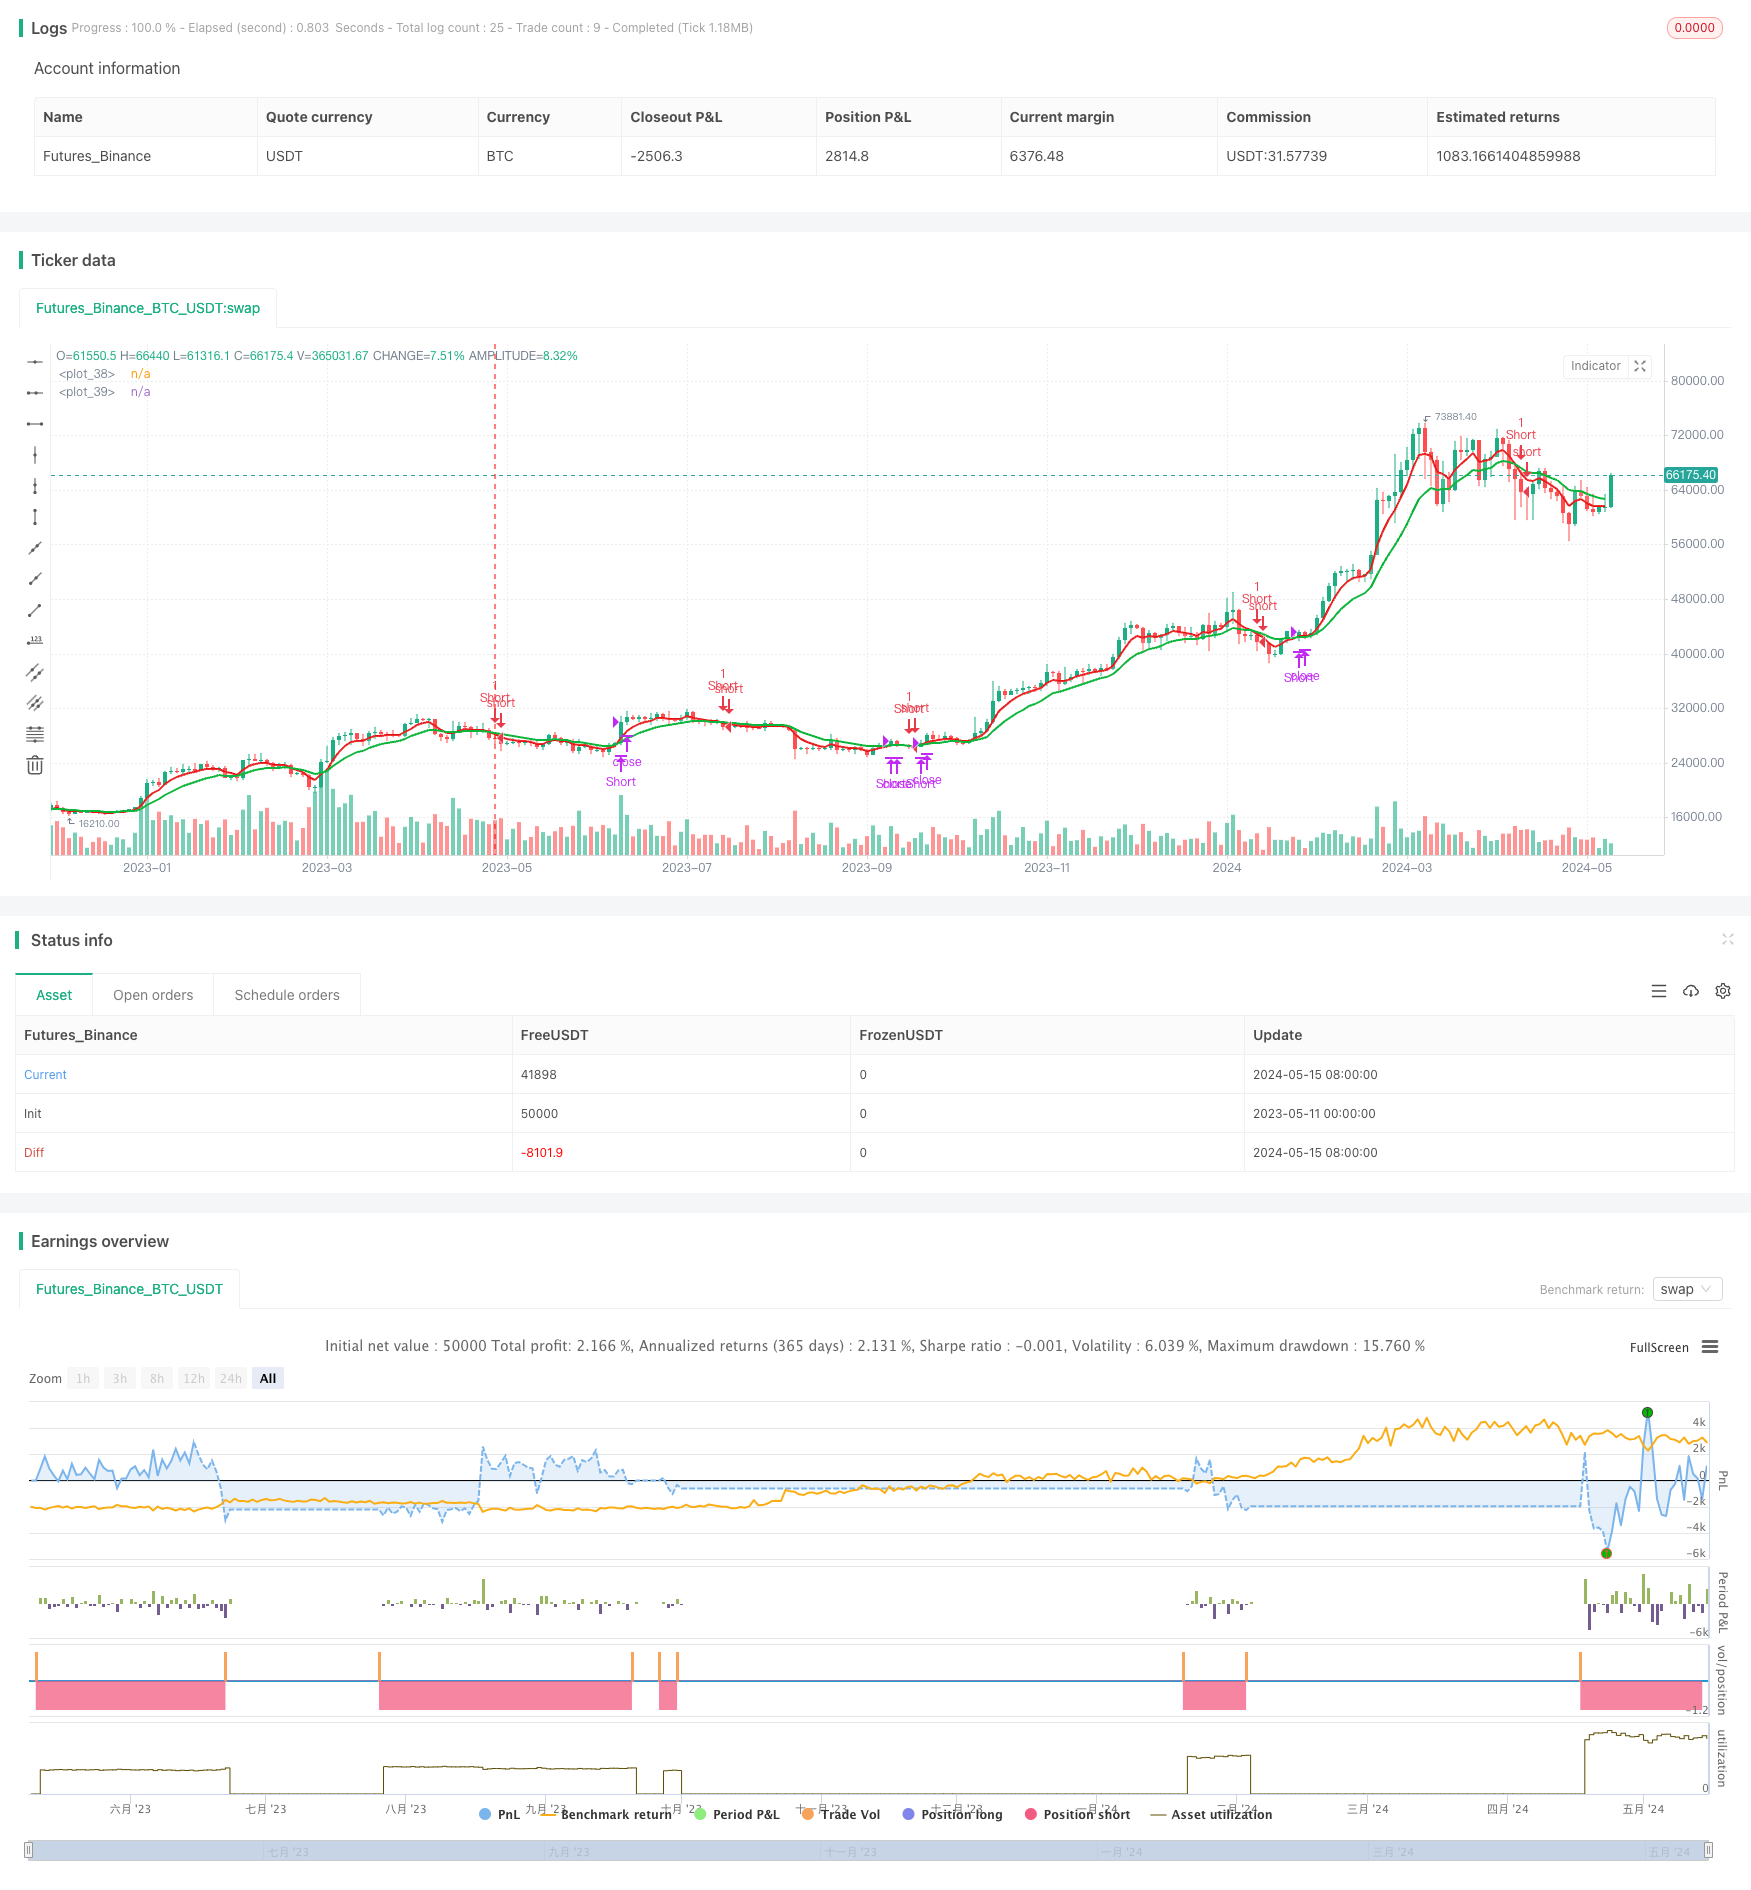
Gambaran keseluruhan
Strategi ini menggunakan persilangan purata bergerak indeks 5 hari ((EMA5)) dan purata bergerak indeks 13 hari ((EMA13) untuk menghasilkan isyarat perdagangan. Apabila EMA5 di atas memakai EMA13, ia menghasilkan isyarat melakukan banyak; apabila EMA5 di bawah memakai EMA13, ia menghasilkan isyarat melakukan kosong. Strategi ini bertujuan untuk menangkap perubahan trend jangka pendek dan menggunakan persilangan dua purata bergerak untuk menentukan titik masuk dan keluar.
Prinsip Strategi
Inti strategi ini adalah untuk menghasilkan isyarat dagangan menggunakan persilangan purata bergerak indeks (EMA) dari dua kitaran yang berbeza. EMA adalah penunjuk teknikal yang biasa digunakan, ia memberikan berat yang lebih tinggi kepada data harga yang lebih baru, dan oleh itu lebih tepat untuk mencerminkan perubahan harga berbanding dengan purata bergerak sederhana (SMA). Apabila EMA jangka pendek (seperti EMA5) melintasi EMA jangka panjang (seperti EMA13), menunjukkan kenaikan harga yang kuat, menghasilkan isyarat plurality; sebaliknya, apabila EMA jangka pendek melintasi EMA jangka panjang, menunjukkan kenaikan harga yang kuat, menghasilkan isyarat kosong.
Kelebihan Strategik
- Mudah difahami: Strategi ini hanya menggunakan dua indikator EMA, asasnya mudah, mudah difahami dan dilaksanakan.
- Adaptif: Dengan menyesuaikan parameter kitaran EMA, ia dapat disesuaikan dengan keadaan pasaran dan jenis perdagangan yang berbeza.
- Kesesuaian yang tinggi: EMA bertindak balas lebih cepat terhadap perubahan harga berbanding SMA, yang membantu menangkap perubahan trend dengan cepat.
- Skala: Berdasarkan strategi ini, ia boleh digabungkan dengan petunjuk teknikal atau asas lain untuk mengoptimumkan lagi prestasi strategi.
Risiko Strategik
- Isyarat palsu: EMA yang bersilang boleh menghasilkan lebih banyak isyarat palsu ketika pasaran bergolak atau trend tidak jelas, menyebabkan perdagangan yang kerap dan kehilangan dana.
- Kelemahan: Walaupun EMA kurang ketinggalan berbanding SMA, tetapi masih terdapat kelemahan tertentu, mungkin terlepas masa masuk yang terbaik.
- Kurangnya penangguhan: Strategi ini tidak menetapkan syarat penangguhan yang jelas dan mungkin menanggung kerugian yang lebih besar jika keadaan berubah.
- Pengoptimuman parameter: Pilihan parameter kitaran EMA perlu dioptimumkan mengikut pasaran dan varieti yang berbeza, jika tidak, ia mungkin mempengaruhi prestasi strategi.
Arah pengoptimuman strategi
- Menambah penapis trend: berdasarkan isyarat silang EMA, penapis trend dilakukan dalam kombinasi dengan indikator trend jangka panjang (seperti EMA50) untuk mengurangkan isyarat palsu.
- Tetapkan hentian: Tetapkan hentian dinamik berdasarkan petunjuk seperti ATR, atau gunakan hentian peratusan tetap untuk mengawal kerugian maksimum dalam satu perdagangan.
- Parameter pengoptimuman: Mengoptimumkan parameter kitaran EMA dengan mengkaji semula data sejarah untuk mencari kombinasi parameter yang paling sesuai untuk pasaran dan varieti semasa.
- Gabungan dengan penunjuk lain: digunakan bersama dengan penunjuk teknikal lain (seperti RSI, MACD, dan lain-lain) untuk meningkatkan pengesahan dan kebolehpercayaan isyarat.
ringkaskan
EMA5 dan EMA13 strategi persilangan adalah mudah untuk menggunakan strategi trend pengesanan untuk menangkap perubahan trend harga melalui persilangan dua EMA tempoh yang berbeza. Keuntungan strategi ini adalah mudah, adaptif dan tepat pada masanya, tetapi juga terdapat risiko seperti isyarat palsu, ketinggalan dan kekurangan berhenti. Untuk mengoptimumkan lagi prestasi strategi, anda boleh mempertimbangkan untuk menambah penapis trend, menetapkan berhenti, parameter pengoptimuman, dan menggabungkan kaedah penunjuk teknikal lain.
/*backtest
start: 2023-05-11 00:00:00
end: 2024-05-16 00:00:00
period: 2d
basePeriod: 1d
exchanges: [{"eid":"Futures_Binance","currency":"BTC_USDT"}]
*/

// This source code is subject to the terms of the Mozilla Public License 2.0 at https://mozilla.org/MPL/2.0/
// © Milankacha

//@version=5
strategy('5-13 EMA by Naimesh ver04', overlay=true)

qty = input(1, 'Buy quantity')

testStartYear = input(2021, 'Backtest Start Year')
testStartMonth = input(1, 'Backtest Start Month')
testStartDay = input(1, 'Backtest Start Day')
testStartHour = input(0, 'Backtest Start Hour')
testStartMin = input(0, 'Backtest Start Minute')
testPeriodStart = timestamp(testStartYear, testStartMonth, testStartDay, testStartHour, testStartMin)
testStopYear = input(2099, 'Backtest Stop Year')
testStopMonth = input(1, 'Backtest Stop Month')
testStopDay = input(30, 'Backtest Stop Day')
testPeriodStop = timestamp(testStopYear, testStopMonth, testStopDay, 0, 0)
testPeriodBackground = input(title='Color Background?', defval=true)
testPeriodBackgroundColor = testPeriodBackground and time >= testPeriodStart and time <= testPeriodStop ? #00FF00 : na
testPeriod() => true


ema1 = input(5, title='Select EMA 1')
ema2 = input(13, title='Select EMA 2')
//ema3 = input(50, title='Select EMA 3')
//SL = input(70, title='Stoploss')
//TR = input(250, title='Target')

expo = ta.ema(close, ema1)
ma = ta.ema(close, ema2)
//EMA_50 = ta.ema(close, ema3)

//avg_1 = avg (expo, ma)
//s2 = ta.cross(expo, ma) ? avg_1 : na
//plot(s2, style=plot.style_line, linewidth=3, color=color.red, transp=0)

p1 = plot(expo, color=color.rgb(231, 15, 15), linewidth=2)
p2 = plot(ma, color=#0db63a, linewidth=2)
fill(p1, p2, color=color.new(color.white, 80))

longCondition = ta.crossover(expo, ma)

shortCondition = ta.crossunder(expo, ma)


if testPeriod()
    //strategy.entry('Long', strategy.long, when=longCondition)
    strategy.entry('Short', strategy.short, when=expo<ma)

//strategy.close("Long", expo<ma, comment= 'SL hit')
strategy.close("Short", expo>ma, comment= 'SL hit')


//plotshape(longCondition and close>EMA_50, title='Buy Signal', text='B', textcolor=color.new(#FFFFFF, 0), style=shape.labelup, size=size.normal, location=location.belowbar, color=color.new(#1B8112, 0))
//plotshape(shortCondition and close<EMA_50, title='Sell Signal', text='S', textcolor=color.new(#FFFFFF, 0), style=shape.labeldown, size=size.normal, location=location.abovebar, color=color.new(#FF5733, 0))