Estratégia de entrada avançada baseada em média móvel, suporte/resistência e volume
Autora:ChaoZhang, Data: 2024-06-14 15:40:46Tags:

Resumo
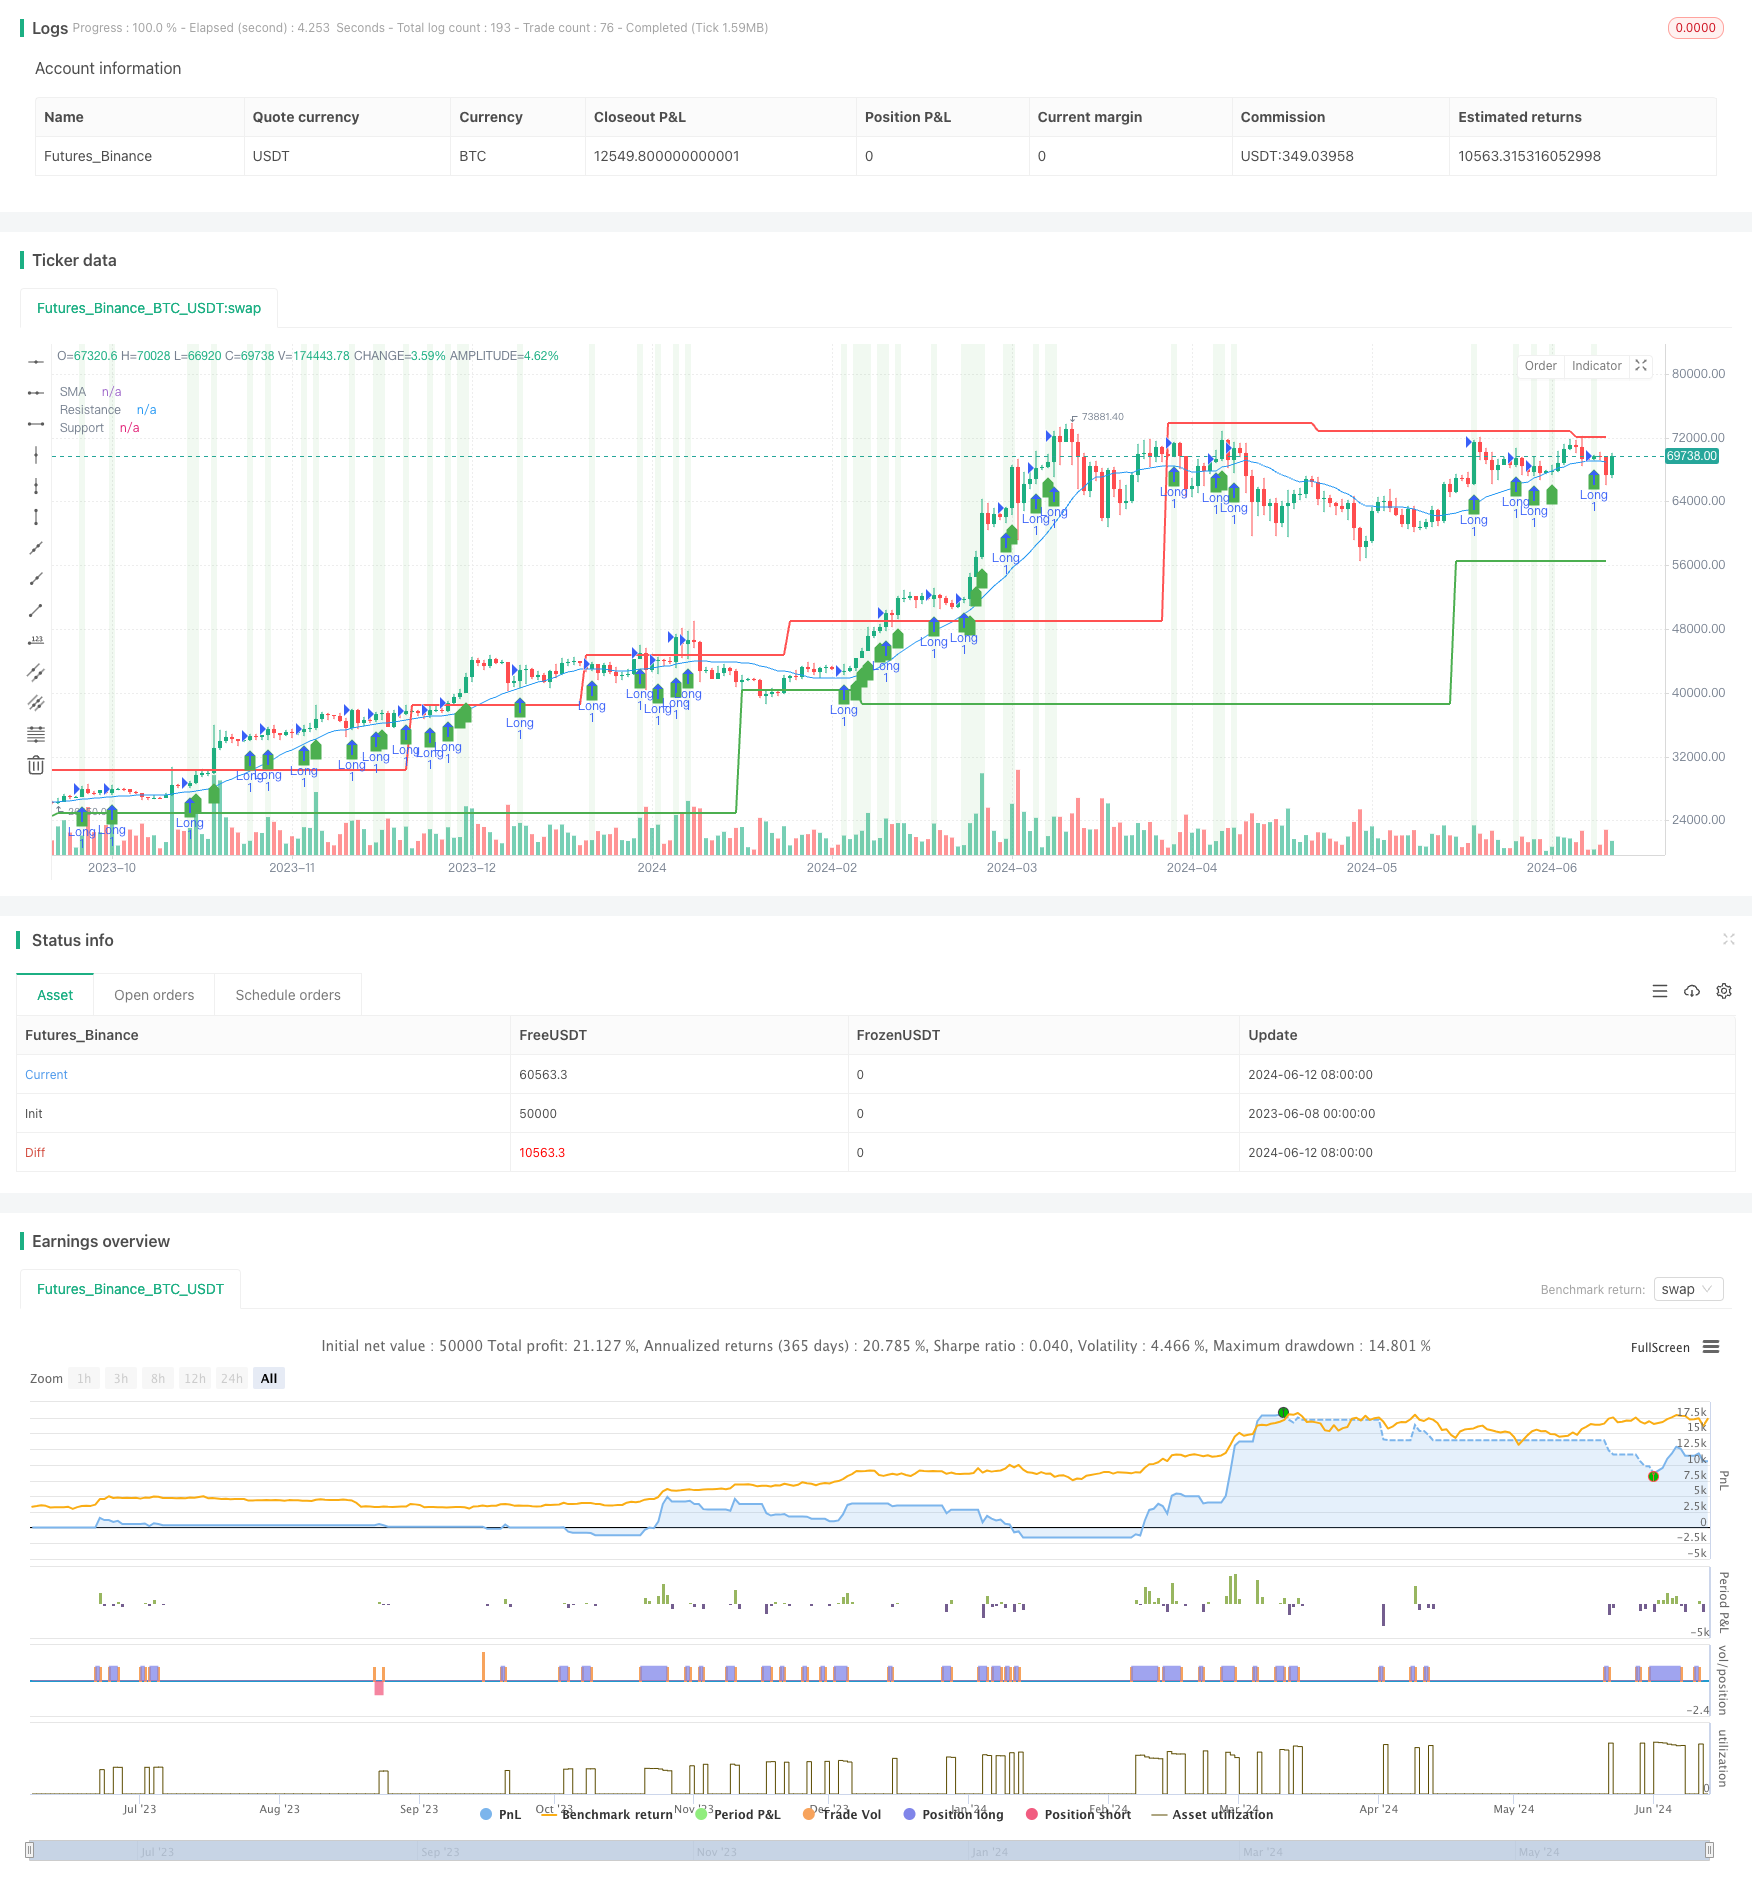
Esta estratégia combina três indicadores técnicos: média móvel simples (SMA), níveis de suporte e resistência e aumento do volume de negociação para construir uma estratégia de negociação abrangente.
Princípio da estratégia
- Calcular os níveis de SMA, suporte e resistência para um período especificado.
- Determine se o volume de negociação actual aumentou em relação ao período anterior.
- Condição de entrada longa: O preço de fechamento atual é superior ao preço de fechamento do período anterior, superior ao nível da SMA e do nível de suporte, e o preço está a uma certa distância do nível de resistência, acompanhado de um aumento do volume de negociação.
- Condição de entrada curta: O preço de fechamento atual é inferior ao preço de fechamento do período anterior, inferior ao nível da SMA e do nível de suporte, e o preço está a uma certa distância do nível de resistência, acompanhado de um aumento do volume de negociação.
- Condição de stop-loss: o preço de stop-loss longo é o preço de entrada multiplicado por (1 - percentagem de stop-loss), e o preço de stop-loss curto é o preço de entrada multiplicado por (1 + percentagem de stop-loss).
Análise das vantagens
- A combinação de múltiplos indicadores técnicos melhora a fiabilidade e a estabilidade da estratégia.
- Considerando tanto as rupturas de preços da SMA como os níveis de suporte/resistência permite uma melhor captura das oportunidades de tendência.
- A introdução do indicador de volume de negociação assegura que as rupturas de preços sejam acompanhadas de uma participação suficiente no mercado, aumentando a eficácia dos sinais.
- A definição de condições de stop-loss controla eficazmente o risco comercial.
Análise de riscos
- O cálculo dos níveis de suporte e resistência baseia-se em dados históricos e pode perder a sua eficácia durante as flutuações significativas do mercado.
- O indicador de volume de negociação pode apresentar flutuações anormais, levando a sinais falsos.
- A definição da condição stop-loss pode não evitar completamente as perdas em situações de mercado extremas.
Direcção de otimização
- Considerar a introdução de outros indicadores técnicos, como o índice de força relativa (RSI) ou a divergência de convergência da média móvel (MACD), para validar ainda mais a fiabilidade dos sinais de negociação.
- Otimizar o método de cálculo dos níveis de suporte e resistência, por exemplo, adotando uma abordagem mais dinâmica para se adaptar às diferentes condições do mercado.
- Suavizar o indicador de volume de negociação para reduzir o impacto das flutuações anormais na estratégia.
- Otimizar a definição das condições de stop-loss, tais como a utilização de um stop-loss final ou o ajuste dinâmico da percentagem de stop-loss com base na volatilidade do mercado.
Resumo
Esta estratégia combina os indicadores de SMA, níveis de suporte e resistência e volume de negociação para construir uma estratégia de negociação abrangente. A vantagem da estratégia reside em sua capacidade de capturar oportunidades de tendência enquanto controla o risco de negociação. No entanto, a estratégia também tem certas limitações, como sua adaptabilidade a situações extremas de mercado precisa de melhoria. No futuro, a estratégia pode ser melhorada introduzindo outros indicadores técnicos, otimizando o método de cálculo para níveis de suporte e resistência, suavizando o indicador de volume de negociação e otimizando as condições de stop-loss para melhorar sua estabilidade e lucratividade.
/*backtest
start: 2023-06-08 00:00:00
end: 2024-06-13 00:00:00
period: 1d
basePeriod: 1h
exchanges: [{"eid":"Futures_Binance","currency":"BTC_USDT"}]
*/

//@version=4
strategy("Advanced Entry Conditions with Support/Resistance, SMA, and Volume", overlay=true)

// Inputs
length = input(20, title="SMA Length")
stopLossPerc = input(1, title="Stop Loss Percentage", type=input.float) / 100
leftBars = input(15, title="Left Bars")
rightBars = input(15, title="Right Bars")
distanceThresh = input(1, title="Distance Threshold from Support/Resistance", type=input.float) / 100

// Calculations
smaValue = sma(close, length)
highUsePivot = fixnan(pivothigh(leftBars, rightBars)[1])
lowUsePivot = fixnan(pivotlow(leftBars, rightBars)[1])

// Volume Calculation
volumeIncrease = volume > volume[1]

// Entry Conditions
longEntryCondition = close[0] > close[1] and close[1] > smaValue and close[0] > smaValue and close[0] > lowUsePivot and close[1] > lowUsePivot and abs(close[0] - highUsePivot) > distanceThresh and volumeIncrease
shortEntryCondition = close[0] < close[1] and close[1] < smaValue and close[0] < smaValue and close[0] < lowUsePivot and close[1] < lowUsePivot and abs(close[0] - highUsePivot) > distanceThresh and volumeIncrease

// Calculate stop loss levels
longStopLoss = close * (1 - stopLossPerc)
shortStopLoss = close * (1 + stopLossPerc)

// Strategy Logic
strategy.entry("Long", strategy.long, when=longEntryCondition)
strategy.exit("Exit Long", "Long", stop=longStopLoss)

strategy.entry("Short", strategy.short, when=shortEntryCondition)
strategy.exit("Exit Short", "Short", stop=shortStopLoss)

// Plotting
plot(smaValue, color=color.blue, title="SMA")
plot(highUsePivot, color=color.red, linewidth=2, title="Resistance")
plot(lowUsePivot, color=color.green, linewidth=2, title="Support")

plotshape(series=longEntryCondition, location=location.belowbar, color=color.green, style=shape.labelup, title="Long Entry")
plotshape(series=shortEntryCondition, location=location.abovebar, color=color.red, style=shape.labeldown, title="Short Entry")

// Background Color
bgcolor(longEntryCondition ? color.new(color.green, 90) : shortEntryCondition ? color.new(color.red, 90) : na)
- Estratégia de negociação quantitativa de curto prazo baseada em indicadores de crossover de média móvel dupla, RSI e estocásticos
- Estratégia de reversão do Ponto Baixo do RSI
- Fisher Transform Tendência de limiar dinâmico Seguindo estratégia
- Estratégia de reversão média
- Estratégia quantitativa de negociação do EMA100 e do NUPL relativa aos lucros não realizados
- Estratégia de negociação baseada no oscilador estocástico
- Estratégia combinada simples: Ponto de Pivot SuperTrend e DEMA
- Estratégia de filtragem da tendência da EMA
- Estratégia de cruzamento da média móvel
- Estratégia de ruptura intradiária baseada em pontos baixos de 3 minutos
- EMA RSI MACD Dinâmica Take Profit e Stop Loss estratégia de negociação
- G-Trend EMA ATR Estratégia de negociação inteligente
- Tendência Seguindo uma estratégia baseada na média móvel de 200 dias e no oscilador estocástico
- Estratégia de tendência do RSI
- Estratégia de Scalping de Momentum Crossover da EMA
- Estratégia de fuga do BB
- VWAP e RSI Dynamic Bollinger Bands Take Profit and Stop Loss estratégia
- Chande-Kroll Stop Dinâmica ATR Tendência Seguindo a Estratégia
- Esta estratégia gera sinais de negociação baseados no fluxo de dinheiro de Chaikin (CMF)
- Estratégia de inversão da barra de pin filtrada de tendência